A Dynamic Manufacturing Process Model Using
Balanced Loops To Achieve Each Goal On
Each Workstation
Insights from a study case
1 Ing. Carlos LeopoldoRojas Delgado.
Master Degree Student Department of Multidisciplinary
Studies University of Guanajuato
Yuriria, Mexico. [email protected]
2 Dr. Roberto Baeza
Serrato.
Research Professor Department of Multidisciplinary
Studies University of Guanajuato
Yuriria, Mexico. [email protected]
3 Dra. Rocío Alfonsina
Lizárraga Morales.
Research Professor Department of Multidisciplinary
Studies University of Guanajuato
Yuriria, Mexico. [email protected]
4 Ing. Daniel Alejandro
Quintero Carrillo.
Department of Processes. Suelas Leal S.A. Buenos Aires, Argentina. [email protected]
Abstract— A dynamic model to analyze the complexity associated with the manufacturing system and to achieve the goals on each workstation of the process through the dynamics systems methodology is proposed. The paper focused on a new suggested statement into dynamics systems theory to develop balanced loops with the explicit description of the initiatives and their side-effects. This proposal allows to know on the corrective actions and adjustment time to take. In the first phase, the problem is articulated. In the second phase is the representation of diagram causal loop (DCL) that helps to define the dynamic hypothesis. In the third phase, the simulation model is formulated and Forrester diagram is showed. In the results, the simulation model is analyzed and the simulation runs. Finally, we discuss about conclusions and suggestions. This article presents the development of a dynamic model of system of footwear sole injection production; the implementation take place in a footwear company in Buenos Aires, Argentina. The results show an important support into decision making in the company.
Keywords—system dynamics; balanced loops; side-effects; sole manufacturing process.
I. INTRODUCTION
The increasing specialization in the footwear industry has led to large increase of footwear sole production [1]. This is a term related to the injection process for footwear sole manufacturing in which is used thermoplastic materials to provide a better way to produce, reducing many operations in comparison to classical methods. However, the necessity of efficiency and effectiveness in the manufacturing system is highly important to strategy business. New technologies and some methods have been considered to facilitate knowledge management in organizations [2]. System Dynamics is a systems simulation methodology based on information feedback and delays, for simulation and analysis of complex problems [3]. Thus, in this paper is analyzed through the development of balanced loops, the
achievement of goals to determine the number of training sessions in 5s which are needed to reduce processing time on each workstation. All above, supporting by the system dynamics methodology. System dynamics is a powerful method to gain useful insight into situations of dynamic complexity and policy resistance[4]. In this case, is consider the processing time reduction by the implementation of different initiatives related to lean philosophy in specific the staff training in 5s lean tool. Additionally, the side effects on the implementation are detailed. On the other hand, in respect of the mentioned implementations. Lean manufacturing offers a wide set of lean mechanisms and tools to achieve these goals [5]. We take considerations about the lean philosophy due the reputation of its application and the action line of the organization. This paper research proposes a new suggested statement into dynamic systems theory to provide a different structure in the development of feedback loops specifically in balanced loops and to support decision making process in the company. In the following section, we give a brief review of previous studies related to modeling manufacturing systems and the implementation of business strategy tools.
II. ALITERATURE REVIEW
After an important search, different investigations have been found in the approach of subjects such as; engineering design, medical equipment maintenance procedure planning, adoption of new technologies and other topics related with the aspects that are treated in this research.
balanced loops to achieve goals such as; planned maintenance quality, defects resolution, uptime and others. In the research paper [8] is used the system dynamics methodology to support decision-making for mobile banking adoption by bank’s customers. The stock and flow model displayed balanced loops to achieve the use of technology through set goals such as; advertising effectiveness, customer satisfaction and intention of use. The results explained different scenarios to validate the model and this can demonstrate the dynamic behavior of the real system in developing new banking services.
In reference [9] the author used a system dynamics simulation to develop a sustainable tuna processing industry. The modeling in this case, explain the balanced loops due the complexity on the tuna catch and the available resources additionally the balanced loop corresponding to the population and the death. Simulation results showed the importance of integrating industry, socioeconomic and government policy to development effective efficient and sustainable fish resource management. In [3] the authors offered a simulation model to the comprehension the dynamics of the renewable energy technology adoption. The model consists in four stock variables such as; potential adopters, semi adopters, adopters, former adopters and others auxiliary variables. The negative balancing loop arises from market saturation. In this regard, the more the adopters, the less the potential adopters in the market place. The results showed that the model is a useful tool for policy makers when formulating medium- to long-term strategies regarding renewable energy technologies.
These previous studies have structured the negative feedback loop just with a simply activity or variable which modifies the corrective action. So, we propose a balanced loop with the explicit description of activities and initiatives to detail the achievement of the goal. The theoretical framework in [4], the literature review and the dynamics systems theory have been important to establish the basis of this study.
III. METHODOLOGY
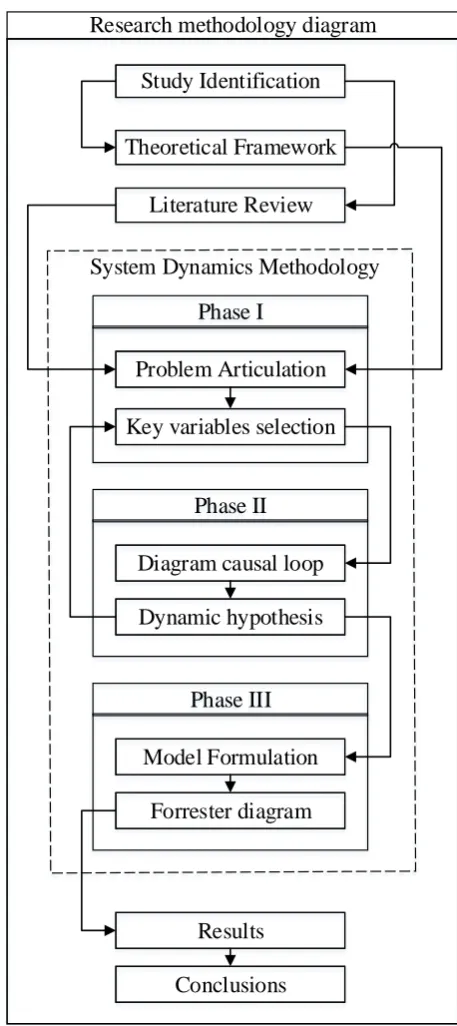
The research methodology is based on main steps of the system dynamics approach. The application of this method has been widely used by many sectors. The systems thinking science offers a holistic approach to understand the interactions between factors within a system[10]. In fig. 1, we show a diagram to explain the research methodology.
This article presents the development of the methodology as following; This consists in 11 stages. Including the system dynamics methodology.
After the study identification and based on theoretical framework and literature review, the problem is articulated and key variables are selected in phase I, in phase II is mapped the diagram causal loop and the dynamic hypothesis is defined.
The model is formulated and is showed the Forrester diagram in phase III. Finally, the results are explained and brought conclusions.
Phase I
Phase II
Diagram causal loop
Dynamic hypothesis
Problem Articulation
Key variables selection
Study Identification
Theoretical Framework
Phase III
Model Formulation
Forrester diagram
System Dynamics Methodology
Research methodology diagram
Results
Conclusions
Literature Review
Fig 1.Research methodology diagram
IV. PHASE I
A. Problem Articulation
problem at present, due to various internal factors, such as; the sequence of operations, standardization, order and cleanliness on workstations. The company requires a larger amount in the processing operations time for each activity. This means that the efficiency of the thermoplastic injection line is low-slung. We used balanced loops to achieve goals reducing the time on each operation in the line through the implementation of initiatives related to 5s tool Lean. Hence, is determined the number of staff training sessions in 5s that are needed.
B. Key variables selection
For the development of the model, we consider key variables such as the different activities of the operation process which includes; move bag from mixing area to grinding station, pour mixed material into the mill, grind mixed material, discharge mixture from the mill, pour mixture into 80 kg bags, set up bags in the transfer car. The initiatives to improve each one of them by applying the staff training in 5s methodology and their side effects because of the efficiencies.
V. PHASE II
A. Diagram causal loop
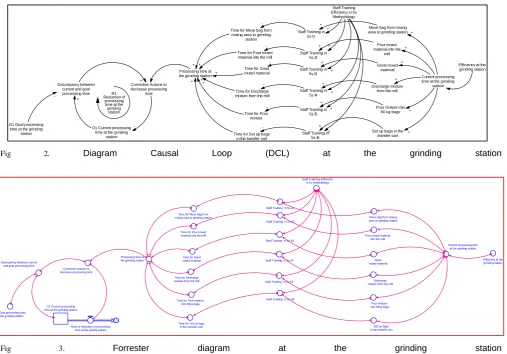
In Fig. 2 is presented a diagram causal loop (DCL) at the grinding station to explain the dynamic hypothesis. The diagram consists in a balanced loop with the explicit description of activities, initiatives and side-effects; We analyzed it from right to the left to clarify the interactions of variables.
B. Dynamic hypothesis
The relationship between auxiliary variables of Efficiency at grinding station and current processing time have a negative polarity. So, an increment in the efficiency reduces the current processing time. The increment in the current processing time increases the time on each activity because of the positive polarity.
The connection between the Staff Training Efficiency and each of one initiatives have positive polarity. Which means that if there is an increment in the efficiency increases each of one initiatives for Staff Training in 5s methodology.
The increment on each initiative reduce the time on each activity according to the negative polarity. If
increase the time on each activity increase the processing time owing the positive polarity.
An increment in the processing time reduces the corrective actions due the negative polarity. An increment on corrective actions it reduces the current processing time O1 due the negative polarity. The increment in O1 increases the discrepancy variable because of the positive polarity. The increment over the discrepancy increases the corrective actions due the positive polarity. Finally, an increment over G1 reduces the discrepancy because of the negative polarity
VI. PHASE III
A. Model Formulation
The structure of the model contains for each station in the line; a stock variable for the current processing time, the goal set by the company, the discrepancy and the corrective actions as auxiliary variables which form the balanced loop. There are also different variables such as; Efficiency of the current processing time, the different activities of each station and the initiatives corresponding to the training in methodology 5s. In Fig. 3, we show Forrester diagram to understand the mentioned.
B. Forrester diagram
The model execution shows the interaction of the variables. To explain how it works, we divided the model in five parts explaining from the right to left in the following description; The initial part corresponds to the side effects which are the efficiency variables, in this variable is setting a random value from 0 to 100. In the second part is described the different activities for the current processing time. On each variable is established a conditional statement scale which depends to the value on the before linked variable. The scale in this case defines the proportion of time allocated to each activity as mentioned above depending on efficiency. Third part represents the initiatives, for one of them is established a conditional statement scale which depends to the value on the before two linked variables, in this situation the scale defines the improved time because of the implementation of the initiatives.
Fig 2. Diagram Causal Loop (DCL) at the grinding station
Fig 3. Forrester diagram at the grinding station
linked variable, the sum of all activities with improved times is the improved processing time.
The final part is the balanced loop, which is structured to reduce processing time, the corrective action equation is based on the identification about the proportion between discrepancy and the sum of time improved on each activity because of the initiatives implemented. In this case, this determine the number of staff training sessions in the 5s lean tool. To finish the explanation, the discrepancy equation is represented by subtraction of the current processing time minus the goal established.
VII. RESULTS
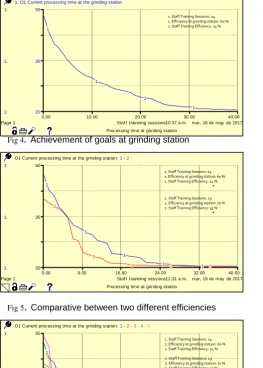
The simulation run for a time horizon of 40, shows in Fig. 4, the behavior of the processing time at the grinding station while are applying the initiatives to improve it.
The result obtained represents the number of sessions to take account while is reduced the processing to goal set by the company, in this case the graph represents in axis y the processing time on minutes and in the axis x the staff training sessions. Thus, in accordance with the graph, for the grinding station is necessary 24 sessions of staff training in the 5s methodology.
Further, in Fig. 5; the graph on the right present the
efficiency variables on each simulation run take a different value. Which means if there is a higher value on the efficiency at grinding station then the current time at grinding station is less. This explain how the station can begins with a different current time at the grinding station due the efficiency value.
On the other hand, if there is a higher value on the staff training efficiency, the time on each activity is reduced due that value. So, are needed less sessions of staff training. This explains how the behavior of the negative slope becomes greater pronounced if the training efficiency is high or less pronounced if the efficiency is low. All above, explains the uncertainty in the model, to show this, we show in Fig. 6, a comparative graph with 5 different simulation runs. In the 3 curve it shows, how the efficiency at grinding station and staff training efficiency are higher, so, are needed less staff training sessions.
O1 Current processing time at the grinding
station
Corrective Actions to decrease processing
time Discrepancy between
current and goal processing time
G1 Goal processing time at the grinding
station
-+
-+
Processing time at the grinding station
Time for Move bag from mixing area to grinding
station
Time for Pour mixed material into the mill Time for Grind mixed material
Time for Discharge mixture from the mill
Time for Pour mixture
Time for Set up bags in the transfer cart + +
+ + + +
-Staff Training Efficiency in 5s Methodology
Staff Training in 5s I1
Staff Training in 5s I2 Staff Training in
5s I3
Staff Training in 5s I4
Staff Training in 5s I5
Staff Training in 5s I6
-+
+
+
+
+
+
Move bag from mixing area to grinding station
Pour mixed material into the
mill Grind mixed
material
Discharge mixture from the mill
Pour mixture into 80 kg bags
Set up bags in the transfer cart +
+
+
+
+
+
Current processing time at the grinding
station +
+
+
+
+
+
Efficiency at the grinding station
-B1
Reduction of processing time at the grinding
station
O1 Current processing time at the grinding station G1 Goal processing time
at the grinding station Discrepancy between current
and goal processing time
Rate of reduction of processing time at the griding station Corrective Actions to decrease processing time
Time for Move bag from mixing area to grinding station
Time for Pour mixed material into the mill
Staff Trainning Efficiency in 5s methodology
Time for Grind mixed material
Staff Training in 5s A1
Time for Discharge mixture from the mill
Time for Pour mixture into 80kg bags
Move bag from mixing area to grinding station
Pour mixed material into the mill Staff Training in 5s A2
Time for Set up bags in the transfer cart
Staff Training in 5s A3
Grind mixed material Staff Training in 5s A4
Staff Training in 5s A5 Discharge
mixture from the mill
Pour mixture into 80kg bags
Set up bags in the transfer cart Staff Training in 5s A6
Processing time at the grinding station
Current processing time at the grinding station
Fig 4
.
Achievement of goals at grinding stationFig 5
. Comparative between two different efficiencies
Fig 6
.
Comparative to show the side-effectsVIII. CONCLUSIONS
The adoption of improvement tools on the business strategy are very important in many sectors. The paper focused on a new suggested statement into dynamics systems theory to develop balanced loops with the explicit description of the initiatives and their side-effects. Therefore, this research paper offered a strategic dynamic model to achieve the goals established by the management.
The model was developed for a case study in the footwear industry, which analyzed the number of training sessions to be considered as corrective actions in the improvement of the processing time at each workstation.
The obtained results, shows that are needed 24 staff training sessions in the 5s lean tool to reduce the
processing time with efficiencies of 60 % at the grinding station and 24 % for the staff training efficiency.
In addition, the side-effects proposed in this research are related to the different values of efficiencies in the model. Those side-effects allow to know in which levels of efficiency are needed less staff training sessions. This could be in the future implemented as policies of the model.
For future studies, this model can serve as a basis for determining how many training sessions should be taken with the proposed initiatives to achieve the goal and would act as a plan of staff training.
REFERENCES
[1] L. Alexandrescu, M. Daniela, S. Institutul, and I.
National, “Modernizing footwear sole injection equipment and establishing injection parameters for new
types of compounds,” in ICAMS 2010 - 3rd International
Conference on Advanced Materials and Systems, 2010,
no. January 2016, pp. 337–342.
[2] S. Kanjanabootra, B. Corbitt, M. Nicholls, B. Corbitt, and
M. Nicholls, “Evaluating knowledge management systems efficacy and effectiveness in a design science context,” 2013.
[3] M. Mutingi and S. Matope, “System dynamics of
renewable energy technology adoption,” 2013 IEEE Int.
Conf. Ind. Technol., pp. 1512–1516, 2013.
[4] J. D. Sterman, Business Dynamics Systems Thinking and
Modeling for a Complex World. Boston Burr Ridge, IL:
Jeffrey J. Shelsfud Senior, 2000.
[5] E. Fatma et al., “Cost performance dynamics in lean
production leveling,” J. Manuf. Syst., vol. 33, no. 4, pp. 613–623, 2013.
[6] D. Kasperek, C. Lichtenberg, S. Maisenbacher, C.
Hollauer, M. Omer, and M. S. Maurer, “Structure-based System Dynamics Analysis of Engineering Design Processes - A case study,” 9th Annu. IEEE Int. Syst.
Conf. IEEE SysCon15, 2015.
[7] S. Mekki, M. A. Wahed, K. K. Wahba, and B. K. Ouda,
“A system dynamics based model for medical equipment
maintenance procedure planning in developing
countries,” 2012 Cairo Int. Biomed. Eng. Conf., pp. 104– 108, 2012.
[8] E. Abbasi, M. Bastan, and A. M. Ahmadvand, “A System
Dynamics Model for Mobile Banking Adoption.,” in 12th
Int. Conf. Ind. Eng. (ICIE 2016), January 25-26, 2016;
Kharazmi Univ. - Tehran, Iran, no. Icie, 2016., 2016, no.
Icie.
[9] E. Fatma, “Development of Sustainable Tuna Processing
Industry using System Dynamics Simulation,” Procedia
Manuf., vol. 4, no. April 2016, pp. 107–114, 2015.
[10] H. Zhang, J. Calvo-Amodio, and K. R. Haapala, “A
conceptual model for assisting sustainable manufacturing through system dynamics,” J. Manuf. Syst., vol. 32, no. 4, pp. 543–549, 2013.
11:31 a.m. mar, 16 de may de 2017 Processing time at grinding station
Page 1
0.00 8.00 16.00 24.00 32.00 40.00 Staf f trainning sessions
1: 1: 1:
20 35 50
O1 Current processing time at the grinding station: 1 - 2 -
1
1
1
1
1
2
2
2 2 2
11:47 a.m. mar, 16 de may de 2017 Processing time at grinding station
Page 1
0.00 8.00 16.00 24.00 32.00 40.00 Staf f trainning sessions
1: 1: 1:
20 35 50
O1 Current processing time at the grinding station: 1 - 2 - 3 - 4 - 5 -
1
1
1
1 1
2
2
2 2 2
3
3
3 3 3
4
4
4
4 4
5
5
5 5 5
10:37 a.m. mar, 16 de may de 2017 Processing time at grinding station
Page 1
0.00 10.00 20.00 30.00 40.00
Staf f trainning sessions
1: 1: 1:
20 35 50
1: O1 Current processing time at the grinding station
1
1
1
1
1. Staff Training Sessions: 24 1. Efficiency at grinding station: 60 % 1. Staff Training Efficiency: 24 %
1. Staff Training Sessions: 24 1. Efficiency at grinding station: 60 % 1. Staff Training Efficiency: 24 %
2. Staff Training Sessions: 19 2. Efficiency at grinding station: 70 % 2. Staff Training Efficiency: 35 %