Point Process based models for rainfall
T h esis s u b m itte d to th e U niversity of London for th e degree of D octor of P hilosophy in th e F aculty of Science
by
A n astasia K akou
D e p a rtm e n t of S ta tistic a l Science U n iv ersity College London
ProQuest Number: 10106696
All rights reserved
INFORMATION TO ALL USERS
The quality of this reproduction is dependent upon the quality of the copy submitted. In the unlikely event that the author did not send a complete manuscript and there are missing pages, these will be noted. Also, if material had to be removed,
a note will indicate the deletion.
uest.
ProQuest 10106696
Published by ProQuest LLC(2016). Copyright of the Dissertation is held by the Author. All rights reserved.
This work is protected against unauthorized copying under Title 17, United States Code. Microform Edition © ProQuest LLC.
ProQuest LLC
789 East Eisenhower Parkway P.O. Box 1346
A ck n ow led gem en ts
My sincere thanks are offered to my supervisor Valerie Isham, for her guidance and m otivation throughout the course of this research.
I am grateful to my colleagues on this project, Sir David Cox, Paul N orthrop, Chris tian Onof, Howard W heater and Ignasio Rodriguez-Iturbe for their continuing collabora tion, and mostly to Richard Chandler for his assistance in the com puter programm ing, for reading parts of my thesis and for many valuable discussions. Also, I would like to thank the research students and members of staff of the D epartm ent of Statistical Science who have created a relaxed and enjoyable atmosphere in which to study. In particular, I thank Kostas Skouras for valuable discussions.
I am greatly indebted to P. C. G. VassiHou for arousing my interest in stochastic prossesses, and for his support and encouragement during the last six years, resulting in the commencement and completion of my postgraduate studies at the University of London.
I am grateful to my sisters, Agni and Olympia, and my parents for their care and love th a t helped me carry on, and to Pavlos for making more exciting the writing up.
A b stra ct
In this thesis, we study the evolution of rainfall at a single site and over a network of sites by generalising existing point process based models.
Stochastic models based on clustered point processes, such as the Neyman-Scott and the Bartlett-Lewis processes, have been used recently in the description of the behaviour of rainfall at a fixed point in space. In such models, storms are idealised as cluster origins th a t arrive in a Poisson process and are followed by a number of rain cell origins, the cluster members. A rectangular pulse is associated with each rain cell origin, having independent random duration and intensity. In this thesis, a class of models with rain cell duration and intensity being dependent random variables has been developed and the main properties have been derived.
For the description of the evolution of a rainfall event at m any distinct spatial lo cations, we consider a m aster clustered point process which is decomposed into sub processes according to a marking mechanism, depending on the location(s) th a t are af fected by a storm and its rain cells. Each cluster of the sub-processes is randomly tra n s lated in time, in order to allow different sites to experience the same event at different times. Some of the model’s param eters remain the same at all generated sub-processes, while others vary in a stochastic or deterministic way. We follow two approaches in m od elling the probability th at a storm or a rain cell affects a particular subset of sites. One is to describe the spatial structure of a rainfall event by assigning to each of its elements a band of random width, location and orientation, th a t intersects the catchment area. Alternatively, the probability th a t two sites experience the same event can be expressed as a determ inistic function of the distance between the sites.
C o n te n ts
1 S to ch a stic R ainfall M o d els 7
1.1 In tro d u c tio n ... 7
1.2 Temporal evolution at a single lo c a tio n ... 9
1.3 Spatial structure of a single e v e n t... 15
1.4 Model development in continuous space and t i m e ... 16
1.5 Multi-site m o d e ls ... 20
1.6 The p r o j e c t ... 22
2 D a ta A n a ly sis 24 2.1 Temporal correlations ... 26
2.2 Between-sites c o r r e la tio n s ... 30
2.2.1 Zero time l a g ... 31
2.2.2 Nonzero time lags ... 32
2.3 Topographic e ffe c ts ... 34
2.3.1 Ground altitude ... 34
2.3.2 Spatial c h a r a c te r is tic s ... 37
2.4 C o n c lu sio n s... 40
3 S in g le-site m o d els 41 3.1 In tro d u c tio n ... 41
3.2 Theoretical model ... 44
3.2.1 D e s c r ip tio n ... 44
3.2.2 Second-order p r o p e r t i e s ... 45
3.3 Exponential d e p e n d e n c e ... 47
3.3.1 Model with E { X | X) = / 48 3.3.2 Model with E [ X | X) = / X 50 3.4 Model f i t t i n g ... 50
3.4.1 Generalised m ethod of moments ... 51
3.4.2 Spectral m e t h o d ... 52
3.5 Discussion of the r e s u l t s ... 54
4 M u lti-site a n alysis o f rainfall 63 4.1 In tro d u c tio n ... 63
4.2 Fixed time displacement of c lu s te rs ... 64
4.3 Aggregated p ro c e s s ... 69
4.4 Random d is p la c e m e n t... 72
4.5 Empirical modelling of some between-site i n t e r a c t io n s ... 75
4.6 Random rainfall b a n d s ... 76
4.7 Cell classification o n l y ... 79
4.8 Random d ire c tio n ... 82
4.9 Probability of zero rainfall at two sites... 85
4.9.1 Storms with fixed time displacements at various sites... 85
4.9.2 Random storm f e a t u r e s ... 94
4.10 A lternative multi-site m o d e l s ... 95
4.10.1 Storm and rain cell c la ssific a tio n ... 95
4.10.2 Bartlett-Lewis based multi-site m o d e ls ... 98
4.11 S u m m a r y ...100
5 F ittin g o f m u lti-site m o d els 102 5.1 M ethods a p p l i e d ... 102
5.2 Model fitting to three s ite s ... 104
5.2.1 P aram eter e s ti m a t e s ... 106
5.2.2 Assesment of f i t ... 109
A T ables o f m o n th ly su m m a r y sta tistics 118
B P r o p e r tie s o f th e a ggregated p rocess o f sin g le site m o d els 121
C C ross-co rrela tio n fu n ction for m o d el w ith random W 124 C .l k = 0...125 C.2 k = l ...126 C.3 k > 2 ...128
C h a p te r 1
S to c h a s tic R a in fa ll M o d e ls
1.1
In tro d u ction
Rainfall modelling had traditionally been a research area of disciplines in the physical sciences like hydrology, meteorology, climatology and atmospheric physics. Over the last few decades however, after the fundamental work of Le Cam (1961), probabilitists and statisticians have been motivated to introduce a new way of approaching the evolution of rainfall events, by developing a stochastic approach.
Following Cox and Isham (1994), we distinguish three broad types of m athem atical models for rainfall,
• the empirical statistical models in which the relationships between the explanatory variables are represented via empirical equations (Stein, 1986);
• the models of dynamic meteorology in which the physical processes are described using the theories of fluid dynamics and thermodynamics and large systems of nonlinear differential equations are solved numerically (Mason, 1986);
• the interm ediate stochastic models in which a modest number of param eters, th a t are related to physical characteristics, are used to represent the evolution of the rainfall process.
In this study, we sta rt with an analysis of rainfall d ata collected over short recording intervals, and our aim is to describe the main properties of the observed process using stochastic models th a t have a small number of physically interpretable param eters. Such models can then be used to produce synthetic d ata for use as inputs for other hydrological processes, like rainfall run-off models in the design of storm-drainage systems.
Precipitation areas are usually classified according to their spatial extent. A hierar chical structure has been observed in most rainfall systems, where a precipitation area of a given scale has one or several smaller scale areas of more intense precipitation embedded within it. Waymire and G upta (1981a) give a very good description of the stru ctu re of rainfall in space and time. According to this, areas greater than about km^ are re ferred to as synoptic areas, and generally have a lifetime of one to several days. Synoptic areas contain large subsynoptic precipitation areas, called large mesoscale areas (LMSA), th a t have a spatial extent ranging from 10^ to lO'^ km^, last for several hours and usually appear as elongated bands. The precipitation intensity inside an LMSA is always higher than the region surrounding it. One level down the hierarchy of the rainfall organisa tion are small mesoscale precipitation areas (SMSA), th at build and dissipate within an LMSA, range from 10^ to 10^ km^ in horizontal extent and have an average lifetime of a few hours. Both LMSA and SMSA contain identifiable regions of cumulus convective precipitation, known as convective cells, whose areas depend upon the storm and range from 10 to 30 km^ and whose durations are of the order of several minutes to about half an hour. Convective cells within LMSA appear in clusters, which is a result of the movement of air masses of different tem peratures. The rainfall intensity within a cell is always higher than th a t of the region surrounding it. Although the above classification is based on observations on cyclonic storms, a similar type of multi-level representation can also be used for convective rainfall, with a wide range of storm types exhibiting similar characteristics. So, a hierarchical structure has been observed in the spatial extent, the tem poral development and the intensity of many rainfall systems.
of rainfall intensity over smaller sub-regions. Depending on the application, stochastic rainfall models may examine marginal behaviour and properties of the process, such as its tem poral evolution at fixed points in space, or the spatial structure of a single rainfall event. Ideally, we expect th a t models th a t describe only the tem poral or only the spatial behaviour of the process can be derived as special cases of fully spatial-tem poral models. This is not always an easy task. Some of the problems were pointed out by Valdes, Rodriguez-Iturbe, and G upta (1985), who used a m ultidim ensional model th a t produces moving storm s with realistic mesoscale features, to simulate rainfall in space and time. The rainfall intensities of the simulated process are measured at fixed gauge stations, and then three different one-dimensional tem poral models are fitted. None of the three models reproduces in a satisfactory manner the characteristics of the multi-dimensional model. A question th a t arises is whether the spatial-tem poral model th a t is used to simulate rainfall is indeed capable in reproducing all physical features of a precipitation event, and thus whether it should be used to assess the performance of the tem poral models.
Although the spatial and temporal aspects of rainfall are linked in a dynamic way, models th a t describe one or the other or both of these aspects have been developed independently and in parallel. In what follows, we present some of the research th a t has been done during the last couple of decades, in modelling the various features of the evolution of precipitation fields.
1.2
T em p oral evolu tion at a sin gle location
One key issue in modelling the temporal evolution of rainfall at a fixed spatial location, is the representation of the process at various time scales using a single set of param eters. For example, one may wish to describe the physical attributes of the rainfall intensity at a fixed point for hourly, daily and weekly periods. It is desirable th a t the integration, over different time intervals, of the instantaneous process coming from a m athem atical model, will represent realistically the characteristics of the integrated rainfall process.
approaches to describing the above characteristics. Rodriguez-Iturbe, Cox, and Isham (1987a) s ta rt their study with a Poisson process based model, in which a rectangular pulse with random intensity and duration is associated with each point. The results of fitting such simple stochastic models to d ata suggest th a t there is a lot of dependence between rainfall intensities over disjoint time intervals, and a high probability of rainy periods occurring close to each other. One way to incorporate this dependence is to assume a high-order Markov chain model, either in discrete or in continuous time, th a t governs the alternation between wet and dry time intervals. A nother way is to consider models based on cluster point processes th a t are overdispersed compared to a simple Poisson process.
M a r k o v ch a in b a s e d m o d e ls
Stern and Coe (1984) used a two state, discrete time, second-order Markov chain model for the analysis of daily rainfall data, where the states correspond to periods of rain below and above a certain threshold. The authors argue th a t the assum ption of stationarity is inappropriate, even for periods as short as one m onth. For this reason, each day of the year is fitted separately, using d ata from a 53-year record, and a time series for each transition probability is produced. The amount of rain above a predeterm ined threshold, during a wet day, is assumed to have a gamma distribution with time dependent mean. Two cases are examined, one where the mean rainfall intensity per rainy day is independent of the history of the process, and the other where the mean depend stochastically on the state (i.e. ‘dry ’ or ‘w et’) of the two previous days. Surprisingly, the former, rather than the la tter, seems to be in accordance with the data, but this is not a typical result. In order to incorporate the tem poral variability of the model’s param eters, a curve, th a t has the form of either a generalised linear model or a Fourier series, is fitted to each tim e series. A disadvantage of this analysis is th a t the model can not easily be extented to cope with more frequent recording intervals. Also, its performance has not been tested on second order properties of the rainfall intensity.
associated with clouds th a t have the potential, not always realised, to become disturbed and deposit rain on the ground. Wet and dry spells are always succeeded by transitional periods, so th e transition m atrix is specified by a single param eter. The model has three more param eters, the exponential sojourn rates for each state. A rainfall event is defined as a sequence of wet spells and transitional periods, thus allowing showers to occur in clusters but not to overlap. The distribution of the length of a rainfall event and of a dry period, which is a sequence of dry spells and transitional periods, have been derived. A shower’s intensity is exponentially distributed, constant throughout its lifetime and inde pendent of its duration. The author questions the assumption of independence between intensities of showers by examining a model with correlated intensities and a correlation function th a t decays exponentially with the time lag between the showers. The first and second order properties of the total rainfall intensity for models with independent and with correlated shower intensities are derived. The conclusion drawn from fitting the models is th a t the la tter reproduces the observed properties, of hourly up to daily recording intervals, very accurately.
C lu s te r p o in t p r o c e s s b a s e d m o d e ls
Poisson Process
I»
> 4 M
-are iid exponential
Clustering models
storm origine ('parents') shown in blue Cells in storms ('offspring') shown in red
1) Bartlett-Lewis
4^’M -' M—^
-à— à *--- "#
J 4 |Y,} form finite renewal processes
2) Neyman-Scott
I . ^ T. .
—----0—
#-and jy,i are iid
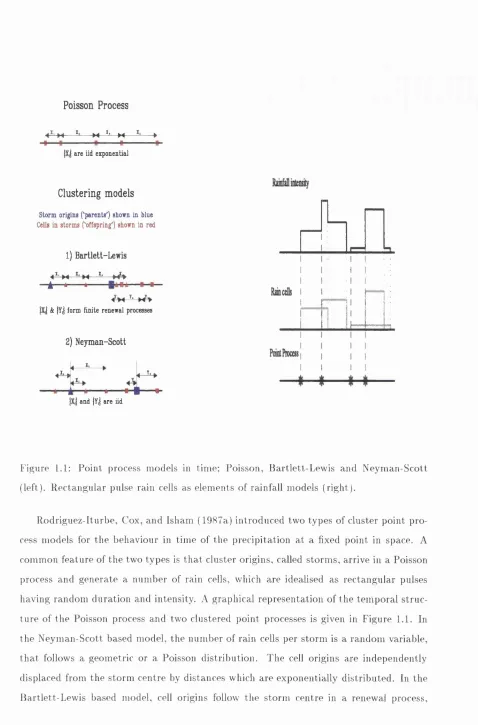
F igure 1.1: P o in t process m o d e ls in tim e; P o isso n , B a r tle tt- L e w is a n d N e y m a n - S c o t t
(left). R e c t a n g u l a r pulse ra in cells as e le m e n ts o f rainfall m odels (r ig h t) .
R o d r ig u e z - I tu r b e , Cox, a n d Is h a m (1 9 8 7 a ) i n t r o d u c e d tw o t y p e s o f c lu s te r p o in t p r o
cess m o d e ls for t h e b e h a v io u r in tim e o f t h e p r e c ip ita tio n a t a fixed p o in t in space. A
c o m m o n f e a t u r e of t h e tw o t y p e s is t h a t c lu s te r orig in s, called s t o r m s , arriv e in a P oisson
process a n d g e n e r a t e a n u m b e r of ra in cells, w hich a re id ealised as r e c t a n g u l a r pulses
h av in g r a n d o m d u r a t i o n a n d intensity. A g r a p h ic a l r e p r e s e n t a t i o n o f t h e t e m p o r a l s t r u c
t u r e of t h e Poisson process a n d tw o c lu s te re d p o in t p rocesses is given in F ig u re 1.1. In
t h e N e y m a n - S c o t t b ased m o d e l, t h e n u m b e r o f ra in cells p e r s t o r m is a r a n d o m variable,
t h a t follows a g e o m e tric or a Poisson d is t r i b u t i o n . T h e cell origins a re i n d e p e n d e n tly
d isp la c e d from t h e s t o r m c e n tr e by d is ta n c e s which a r e e x p o n e n tia lly d i s t r i b u t e d . In t h e
centre in a renewal process, usually Poisson, which term inates after an exponential time. In both cases, the total rainfall intensity at a specific time is the sum of the intensities of all active rain cells. The assumption th a t rain cells have a finite lifetime, makes these models appropriate for the study of properties related to dry periods. Since rainfall d a ta are available in aggregated form, the continuous-tim e process is discretised by taking the cumulative rainfall totals over disjoint time intervals of fixed length. The second-order properties for the continuous and the aggregated process, and the probability th a t an a r bitrary tim e interval of fixed length is dry, have been derived. The Bartlett-Lewis based model is fitted to monthly rainfall d ata from Denver, Colorado, and is compared to a Poisson-based model in which storms have a rectangular profile. The results show th a t the former performs much b etter than the latter, and that it preserves the main proper ties of the process at aU levels of aggregation, the only exception being the probability of zero rainfall during an arbitrary interval, which is overestimated.
A more detailed comparison between the three point process models with rectangular pulses was carried out by Rodriguez-Iturbe et al. (1987b). This analysis shows th a t the Poisson based model can be used for the description of the rainfall process only at a fixed level of aggregation, preferably larger than a typical duration of a storm . On the other hand, the Neyman-Scott and the Bartlett-Lewis based models are capable of reproducing, using a single set of param eters, the statistical properties of tem poral rainfall at various scales of aggregation, ranging from one hour to one day. These models also perform well with regard to the extreme values of rainfall, but they give poor estim ates of the probabiltiy of zero rainfall at an arbitrary time interval of fixed length.
Entekhabi, Rodriguez-Iturbe, and Eagleson (1989) applied the above idea to a Neyman- Scott model and obtained similar results.
After the development and the analytical exploration of the modified Neyman-Scott and Bartlett-Lewis models, there was a need for a detailed and extensive comparison be tween all the cluster-based rectangular pulses models. Such a comparison was carried out by Velghe et al. (1994), who consider three classes of models, namely the Bartlett-Lew is, the Neyman-Scott with a geometric distribution and th at with a Poisson distribution for the number of cells per storm. For each class, the original model, with constant param eter for the cell duration, and the modified one, with a random param eter, are examined. The rainfall d a ta used are from Denver, Colorado, A reassuring result is th a t the modified models give better estimates, as compared to the original ones, of the zero depth proba bility, the correlation structure, several conditional distribution characteristics and of the extreme value properties. Minor differences in the performance are found between the original models, with the geometric Neyman-Scott one being shghtly superior. Concern ing the modified models, it is observed th a t the Bartlett-Lewis one is very sensitive to the sets of moments used in the param eter estimation, and that the geometric Neyman-Scott model, in general, performs b etter than the others.
A generalised Neyman-Scott rectangular pulses model has been developed recently by Cowpertwait (1994), th a t allows the rain cells to be of a number of different types, with a certain probability associated to the occurrence of each type. The distributions of cell intensity and duration depend on the cell type, so the generalised model provides a correlation between these two characteristics of the generated rain cells. However, given the type of the cell, all the variables involved are mutually independent. The case where cells can be of two types, ‘heavy’ or ‘light’, is examined in some detail and the model is fitted to rainfall d ata of different months separately. In order to ensure a smooth seasonal variation in the param eter estim ates, it is assumed th a t each param eter varies across the year according to a harmonic relationship. As a result, the to tal number of param eters is reduced, but the estimates of the statistical properties of the rainfall intensity are less accurate. Compared to the original Neyman-Scott model, in term s of the extrem e values distribution, the generalised model produces a better fit to the historical values.
was also explored by Onof and W heater (1993), who fitted a Bartlett-Lew is based model with random rain cell duration to British rainfall data. It is suggested th a t it is possible to use a polynomial curve or a Fourier series for a smoother representation of the above variability, on a daily rather on a monthly basis, and to obtain satisfactory results.
In many hydrological applications, such as the rehabilitation of storm sewer systems, properties such as the probability of dry speU sequences of given length and the extreme values distribution are of particular interest. Cowpertwait et al. (1996) used a Neyman- Scott rectangular pulse model, with fixed rain cell duration param eter, and found th a t the tw o-param eter WeibuU distribution for the rain cell intensity, instead of its special case the exponential distribution, gives good agreement between the simulated and ob served daily annual maximum rainfalls. Also, it is observed th a t when the wet and dry spell transition probabilities, rather than the lag 1 autocorellations, are included in the generalised method of moments fitting procedure (a description of which can be found in Section 3.4), the estimates of the dry spell sequences are improved.
1.3
S p atial stru ctu re o f a single event
non-linearly with distance. A few generalisations of this model are examined. The first is to allow some param eters, such as the mean intensity at the cell centre, to vary randomly between storms. The second is to incorporate more flexible and realistic spread functions either by letting some of the param eters be random , varying from cell to cell, or by allowing for each rain cell a random fluctuation in intensity around the decaying trend from the cell centre. Finally, a clustering mechanism for the spatial distribution of rain cells is considered. In particular, a model with a Neyman-Scott two-dimensional process for the allocation of rain cells in space and with an isotropic quadratic exponential spread function is studied in more detail.
Poisson spatial models, such as the ones described above, were applied to air mass thunderstorm rainfall by Eagleson et al. (1987), who used observations from a dense network of raingauge stations. In order to produce a random rainfall field, the station observations are interpolated onto a rectangular grid. The bias of the correlation esti mates th a t is produced from the interpolation is investigated and seems negligible. Also, the assumptions of homogeneity and isotropy of the random field are verified. Three dif ferent spread functions are tested, namely, a quadratic exponential, a simple exponential and a linear function. Storm days are identified and the three models are fitted to each storm separately. It is observed th a t the param eter estimates present a variability among storms and thus the mean rainfall intensity at the cell centre is assumed to be random . This generalisation improved significantly the fitting of the two models with exponential type spread function, for which the second-order properties can be derived analytically. An overall conclusion is th a t the Poisson process models developed by Rodriguez-Iturbe, Cox, and Eagleson (1986) are capable in reproducing im portant features of the spatial distribution of to tal storm precipitation, at least for storm types th a t are essentially stationary in space.
1.4
M o d el d ev elo p m en t in continuous sp ace and tim e
by space-time rainfall. They also stressed the fact th a t the tools of point process theory can facilitate algebraic operations and make further m athem atical exploration possible. They formulated a quite general and abstract model th a t reflects the main features of the hierarchical rainfall structure. The large-scale elements of the process, the cluster potentials, arrive in the three-dimensional time-space according to a point process, and have a spatial extent of given radius. A similar generating mechanism exists for the smale-scale elements, the rain cells, th a t occur within the cluster potentials. The rainfall intensity at a point in space and time, due to a single cell, is a deterministic function of th e age of the cell and the distance away from the cell centre. Cluster potentials and rain cells are allowed to move with different velocities. The total rainfall intensity at a specific tim e and ground location is the sum of the intensities contributed by all rain cells th a t arrived in the past over the region of interest.
or frozen field hypothesis, th a t states th a t the temporal autocovariance at a fixed point in space should be of the same form as the spatial autocovariance at a fixed point in time, with the ‘tim e’ argument of the former converted into the ‘spatial’ argum ent of the la tter by multiplication by a typical velocity.
Phelan and Goodall (1990) introduced a generalised version of the previous model th a t has the same clustering mechanism, but allows some of the rain cell characteristics, such as the rain intensity at the cell origin, the aging rate, the planar velocity and the spatial extent, to be mutually independent random variables. The w ater content of a rain ceU has now a Gaussian surface in space, and a double exponential shape in time, which captures both the intensive and the dissipative stages of a rain cell. The scale, orientation and anisotropy of the rain cells are estimated by applying a linear transform ation th a t takes a rain cell of spherically symmetric covariance structure having unit scale to one with the estim ated covariance structure. The model is fitted to individual tropical storm s using hourly radar d ata and the analysis is focused on the geometry and kinetics of a sample intensity process. The rain cells are identified by direct inspection of the radar images. In order to estim ate the param eters, the model is decoupled in time and each hour is analysed separately. At a fixed time, the intensity, spatial location and dispersion of each rain cell are estim ated using the least squares method, yielding a time series of fitted characteristics for each one. Then, the model is recoupled and the remaining param eters, th a t is, the velocity and the aging rate, are estim ated again by ordinary least squares. The conclusion drawn from the fitting is th at the hypothesis of time invariant cell characteristics needs further investigation. In general, models th a t require m anual identification of individual rain cells are not very promising in analysing long sequences of rainfall systems.
and are located over the area of study in a spatial Poisson process. The model was fitted to rainfall d ata from a network of five raingauge stations. Two param eter estim ation procedures are developed, one based on maximising the likelihood function, and the other on the method of moments. In both cases, the spatial and the tem poral param eters are estim ated separately. A serious disadvantage of this approach is th a t there is not a time continuum since spatial features of the rainfall are assumed independent between days. Thus, this model could not be used successfully in studying rainfall d ata of a small tem poral resolution, such as hourly or five minutes, since it does not take into account the tem poral correlation between successive periods.
Cox and Isham (1988) explored a simple point process based model, where storm s consist of single rain cells th a t arrive in a Poisson process in space and time. Rain cells are idealised as cylinders of random radius th a t move with constant random velocity and die after a random time. The intensity of a cell is constant during its lifetime but varies stochastically between cells. The innovation of this formulation is th a t the rain cells have a finite spatial extent and duration which implies th a t the probability th a t there is no rainfall at a point in space and time is non-zero. The authors derived a general expression for the spatial-tem poral covariance function under the assum ption th a t aU the variables involved in the model are m utually independent. Further to this result and under the additional assumptions th a t the rain cell’s duration and radius are exponentially distributed and the velocity has a gam m a distribution, several statistical properties of the process are determined, including the spatial covariance at a fixed point in time and the temporal covariance at a fixed point in space, as well as properties related to the probability of non-zero rainfall at various points in space and time. Cox and Isham (1988) also considered a cluster-based spatial-tem poral model in which storm centres arrive in a Poisson process in space and time, and cells occur in a Bartlett-Lew is process in time, at the same spatial location as the storm origin. An analytic expression for the spatial-tem poral covariance function is not available, but other properties such as the variance of the marginal rainfall intensity can be derived approximately under reasonable assumptions.
three-dimensional space-time. Following each storm centre, rain cell origins arrive in a tem poral Bartlett-Lewis-type cluster, th a t is, they arrive in a Poisson process, th a t starts w ith a cell located in time at the storm centre, and term inates after an exponential time. All rain cell origins within the storm are displaced from the storm centre according to a spatial displacement distribution. Two such distributions have been studied — one where the cell origins are uniformly distributed over a random ellipse centred on the storm centre, the other where the displacements follow a bivariate Gaussian distribution. Both these variants of the model have the flexibility to produce a wide range of storm structures, ranging from rain bands to more widespread rainfall. Each cell is elliptical in shape, with a random m ajor axis, and deposits rain at a constant intensity on all points in space covered by its defining ellipse during its lifetime. The elliptical peripheries of the rain cells are scaled versions of the storm ellipse, or the elliptical contours of the bivariate Gaussian distribution. The intensity, the duration and the m ajor axis of a ceU are mutually independent random variables. AU ceUs within a storm and the storm centre itself, move with the same random velocity. CeU clusters belonging to distinct storms are independent. Northrop (1996) derived explicit expressions for the second order properties — mean, variance and covariance density — of the process, and an approxim ate expression for the probabiUty th a t a randomly chosen pixel, of arb itrary size, is dry at a given time. The models are fitted to radar d ata from W ardon HiU, South-West England, and have proved to be capable of reproducing the main spatial- tem poral features of the rainfaU field.
1.5
M u lti-site m o d els
m ultivariate models, th a t describe the relationships between rainfall intensity at different sites and also preserve the structure of the single site models for their marginal processes at each site. The literature on multivariate or multi-site models is limited. This is partly because research effort has concentrated on the development of satisfactory single site models, and partly because progress in multi-site modelling requires an extensive analysis of d ata collected from a carefully designed network of raingauge stations. The network should ideally consist of a large number of stations, located close enough together to capture the within rain cell dependences, and should occupy a large area, so th a t several spatial features of the rainfall structure can be observed.
Among the first who explored this area of rainfall modelling are Cox and Isham (1994), who used some rectangular pulses point process models for a single site and modified them to allow the study of more than one, say n, sites. More specifically, it is assumed th a t there is a m aster point process of storms which evolve independently of each other, and th a t each storm can affect a subset of the n sites with a certain probability. From the between sites characteristics, for simplicity, only second order properties between pair of sites are considered. So, if initially the analysis is restricted to two sites, three subprocesses are generated from the m aster Poisson process, and each storm origin belongs to one of them depending on the site(s) it affects. A key issue is how the subprocesses are related, in other words, what assumptions should be made about the dependence between the evolution of the rainfaU processes at distinct sites.
observed. A more realistic, interm ediate model th a t has the Bartlett-Lewis structure in time was constructed by Cox and Isham (1994), who assumed th a t the Poisson process of cell origins is the same at all affected sites but the storm truncation mechanism acts independently at each site. Also, the intensities of cells with a common origin but at different sites are independent, but the durations of such cells are dependent and are scaled versions of the same exponential variable. The common param eter for the cell duration can either be constant or vary randomly for different storms. The theoretical cross-correlation function is derived, and allows a varying degree of dependence between the rainfall intensity at the two sites for different param eter sets. Such an approach, where some of the rainfall characteristics are kept the same for all subprocesses and others vary in a stochastic or deterministic way, is very promising. However, a detailed d a ta analysis is a prerequisite to provide guidelines for appropriate assumptions.
1.6
T h e p roject
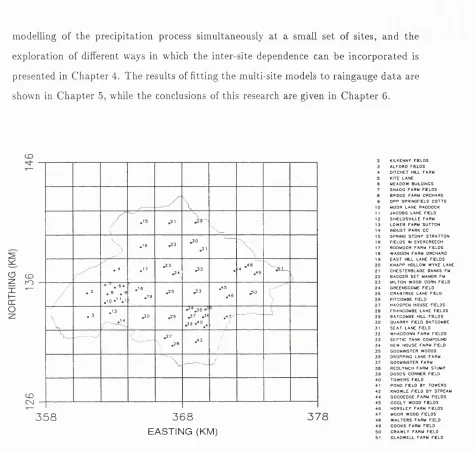
The work presented in this thesis has being carried out as part of the Hydrological R adar Experiment (HYREX) project, funded by the N atural Environment Research Council. A carefully designed dense network of 49 raingauge stations has been installed in the Brue river catchm ent, in South-West England, covering an area of roughly 140 km^. The gauges are 0.2 mm tipping buckets and the way they operate is th a t rain is accum ulated in each bucket until it is filled out. Then, the water is released, the time is recorded and the bucket is ready for the next measurement. So, the raingauge d ata available are sequences of times when a bucket tipped, from which rainfall intensity aggregated over disjoint time intervals can be calculated. A radar station, located close to this network, is m onitoring the region every 5 minutes. R adar d ata are collected for 5 x 5 km^ pixels up to a distance of 210 km from the station, and for 2 x 2 km^ pixels up to a distance of 75 km. Both types of d ata are available from September 1993.
m odelling of t h e p r e c ip ita tio n process s im u lta n e o u s ly a t a sm all set o f sites, a n d th e
e x p lo r a tio n o f different ways in which t h e in te r-s ite d e p e n d e n c e c a n be i n c o r p o r a t e d is
p r e s e n te d in C h a p t e r 4. T h e re su lts of fittin g t h e m u lti-site m odels t o r a in g a u g e d a t a a re
sh o w n in C h a p t e r 5, while t h e conclusions of th is research are given in C h a p t e r 6.
CO
O CO Z ro
X Ë o CO CNJ \ / \ >
. ' 6 ^ 0
.3 1 X
. 4
. 2 3 . 2 4
. 3 2
• .4 9
/
/
/
. 2 . 8 . 9 . 1 0 * ’ ' . 1
. 1 8 . ' 9
. 2 5 . 3 3 . ♦ 5
. 4 6 . 5 0
r
\
's
. 3 . ' 3
^ 0 . 2 6 . 3 7 . 3 ( . 3 9
. 4 7
-/
'
-___________ / / . 2 7
\ . 2 8
.4 2 /
1
X J
3 5 8 3 6 8
E A S T I N G (KM)
3 7 8
KILKENNY F E L D S ALFORD FIELDS DITCMET HfLL FARM MEADOW BUILOtNCS SN A C C FARM F E L D S BRIDGE FARM ORCHARD O P P SPRIN G FELD COTTS MOOR LANE PADDOCK JA C O B S LANE FELD SM IELDSVELE FARM LOWER FARM SUTTON INDUST PARK CC SPRING STONY STRATTON FIELDS IN EVERCREECH ROOMOOR FARM FE L D S WADDON FARM ORCHARD E A ST HEL LANE FIELDS K N APP HOLLOW WYKE LANE CHESTERBLA DE BANKS FU BADGER SE T MANOR FU MILTON WOOD CORN FELD CREENSCOME FIELD CR AB TREE LANE FELD P1TC 0M 8E FIELD H A OSPEN HOUSE FE L D S FRANCOMBE LANE FE L D S BATCOMBE HILL F E L D S QUARRY FIELD BATCOMBE SE A T LANE FIELD WHAOOONN FARM FIELDS SE P T IC TANK COMPOUND NEW HOUSE FARM FIELD GOOMINSTER WOODS DROPPING LANE FARM GODMINSTER FARM REOLYNCH FARM STUMP DODOS CORNER FELD TO W ERS FELD POND F E L D BY TOWERS KNOWLE FIELD BY STREAM COOOEDCE f a r m f ie l d s
COGLY WOOD F E L D S H O RSLEY FARM F E L D S MOOR WOOD FIELDS W ALTERS FARM FIELD CO O K S FARM FIELD CRAWLY FARM FELD GLADWELL FARM FELD
F ig u re 1.2: T h e m a p of th e B ru e c a t c h m e n t a r e a w ith th e lo c a tio n s a n d n a m e s o f t h e
C h a p te r 2
D a t a A n a ly sis
Our research interest is the stochastic modelling of the tem poral evolution of rainfall at a single point in space and also at a number of spatially separated locations. Before doing any theoretical work, it is im portant to carry out a substantial am ount of d a ta analysis, which will provide guidehnes for the theoretical model development. The d a ta we have available are from a network of raingauge stations (Figure 1.2), which covers an area of about 140 km^, expanded around the basin of the river Brue and has an altitude range from 35 to 193 meters. Since the area is topographically inhomogeneous, it is crucial to know w hether the statistical properties of the rainfall intensity are influenced by the spatial location and the elevation of the sites. This is one of the three broad areas of our d ata analysis. The second area involves the investigation of the tem poral and seasonal variation of th e rainfall intensity at a fixed point in space. Finally, we are interested in the between-site properties and how they are related to the separation distance and the orientation of the sites. This wiU provide inform ation about some spatial characteristics of the rainfall, such as the storm velocities in different seasons.
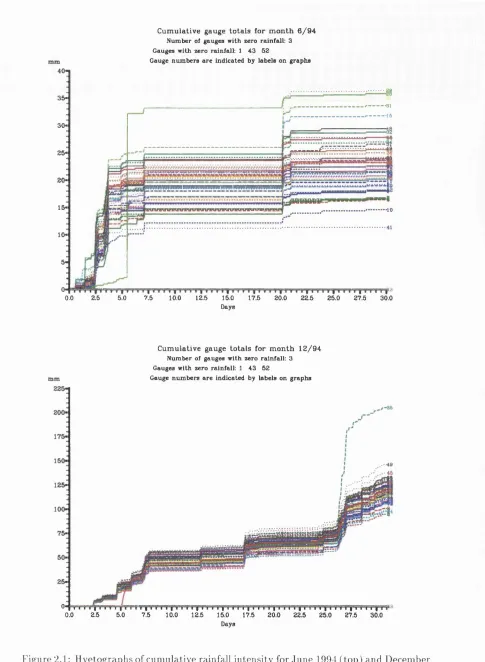
C um ulative gauge to ta ls for m o n th 6 / 9 4
N um ber of gauges w ith zero ra in fa ll: 3 G auges w ith zero ra in fa ll: 1 43 52
Gauge n u m b e rs a r e in d ic a ted by lab els on g ra p h s
40-1
3 5
-•91
•1 5
3 0
2 6
-20
-; aJiummiA) ...
15- r iM i r s u v i u u w u i f V U W M iu i u w u i u a x ••10
10
-
5-0.0 2.5 5.0 7.5 10.0 12.5 15.0 17.5 20.0 22.5 25.0 27.5 30.0 Days
C um ulative gauge to ta ls for m o n th 1 2 /9 4
N u m b er of gauges w ith zero ra in fa ll: 3 Gauges w ith zero ra in fa ll: 1 43 52
Gauge n u m b e rs a r e in d ic a ted by lab els on g ra p h s m m
0 11 1 i n I I I I ^ I M 11 > M 11 r v T r f T i I n I I I 111 n 11 1 11 I 1 1 I I 1 1 1 I I 111I 111
0.0 2.5 5.0 7.5 10.0 12.5 15.0 17.5 20.0 22.5 25.0 27.5 30.0 Days
F ig u re 2.1: H y e t o g r a p h s of c u m u la tiv e rainfall in te n s ity for J u n e 1994 ( t o p ) a n d D e c e m b e r
there is more variability in the rainfall intensity between gauges. In addition to our gauge quality assessment, reports have been supplied by the In stitu te of Hydrology for each station, with a list of the periods during which a technical problem was reported. Suspect gauges have been excluded from any subsequent d a ta analysis.
2.1
T em p oral correlation s
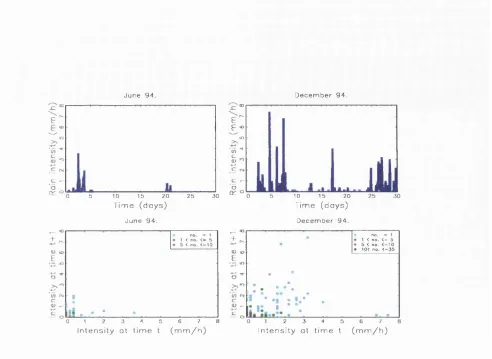
We examine the tem poral characteristics of rainfall at a single site, and dem onstrate the results for June 1994 and December 1994, a typical summer and winter m onth respec tively, and for one raingauge of the whole network. In this context the rainfall intensity is to be regarded as an instantaneous quantity, measured in millimetres per hour. The d ata available are measurements of the to tal rainfall intensity during disjoint intervals of fixed length h. Let us denote by tn the n-th tim e interval of a sequence and by Yn
the aggregated rainfall intensity during tn. W ith reference to the hourly tim e series in Figure 2.2, we notice the clustered structure of the process, as well as the differences in the arrival rate and the intensity of a rainfall event between the two m onths. W hen the d ata are aggregated over larger time intervals, the tim e series become sm oother, there are more rainy intervals and the accumulated rainfall intensity is higher during rainy periods.
In addition to the time series, one can plot the aggregated rainfall intensity, dur ing interval tn against th a t of tn+k- In such graphs the origin has a high frequency, th a t corresponds to transition between dry intervals, and there are fewer points further away from it. The time-ordering is lost, but it is easy to observe the relationship between rainfall intensities at time intervals separated by lag k, which is related to the lag k cor relation function. The plots of the rainfall intensities during successive intervals, shown in Figure 2.2 for the same m onths as previously, are fairly symmetric relative to the diag onal, suggesting th a t the rates at which storms build and dissipate are similar. Because near the origin there are multiple points, in this graph, different symbols represent points with different multiplicity, while the atom at the origin has a frequency of 671 in June and 552 in December.
J u n e 9 4 . D e c e m b e r 9 4 .
1 0 2 0 2 5 5 0
i m e ( d a y s )
J u n e 9 4 .
o
c
2 4 5 6 7 a
Q 1
I n t e n s i t y a t t i m e t ( m m / h )
E
o ct: o
E ]
m
ULmk.A
10 1 5 2 0
T i m e ( d a y s )
D e c e m b e r 9 4 .
1 < n o . <= 5 5 < n o . < * 1 0 10< n o . < - 3 5
1 2 3 4 5 5 7
I n t e n s i t y a t t i m e t ( m m / h )
F ig u re 2.2: H ourly tim e series o f rainfall in te n sitie s ( t o p ) , p lo ts of h o u rly rainfall i n t e n
sities d u r in g successive intervals ( b o t t o m ) .
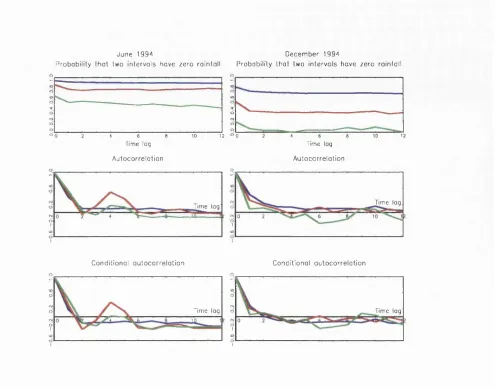
dry, poo{k) = f ( ) / - = 0), a n d th e i r g ra p h ic a l r e p r e s e n t a t i o n for different k. W i t h
reference t o F ig u re 2.3, we n o tic e t h a t t h e a u t o c o r r e l a t i o n ' y{k) d ecay s fairly r a p id ly for
sm all lags a n d stabilizes a t values close t o zero, b u t t h e p r o b a b ility poo{k) r e m a in s a lm o s t
c o n s t a n t for all tim e lags, a n d e x h ib its only a slight d r o p fro m t h e value r e s u ltin g f ro m lag
zero. T h e l a t t e r su g g e s ts t h a t d r y in te rv a ls a p p e a r a lm o s t r a n d o m l y in t im e a n d t h u s t h e
c o n d itio n a l p ro b a b ility F{\ ' n+k = 0 | F / = 0) is e ssen tially in d e p e n d e n t o f A;, for p o sitiv e
values o f k, a n d a s y m p t o t i c a l l y we h a v e poo{k) = poo(O)^, w h e re poo(O) = P ( F / = 0) is
t h e p r o b a b ility t h a t a n a r b i t r a r y tim e in te rv a l of a given le n g th is dry. A s im ilar p a t t e r n
( n o t p r e s e n te d h e re ), is e x h ib ite d by t h e p r o b a b ility p++(& ) = P { Y n > 0, > 0),
which ta k e s very sim ilar values for all p o sitiv e k a n d it is a p p r o x i m a t e l y e q u a l t o t h e
s q u a r e of p + + (0) = P ( } / > 0).
A c o rre la tio n m e a s u r e t h a t , in g e n e ra l, pro v id es m o r e in f o r m a t i o n a b o u t t h e s t r u c t u r e
o f t h e rainy p erio d s is t h e c o n d itio n a l lag k a u t o c o r r e l a t i o n , w hich is c a lc u la te d keeping
J u n e 1 9 9 4 D e c e m b e r 1 9 9 4
P r o b a b i l i t y t h a t tw o i n t e r v a l s h a v e z e r o r a i n f a l l P r o b a b i l i t y t h a t tw o i n t e r v o l s h o v e z e r o r a i n f a ll
CO
--- »
°
4 6 a 10 12 ° o
rime lag
A u t o c o r r e l a t i o n
Time lag
C o n d i t i o n a l a u t o c o r r e l a t i o n
Time lag
O I
10 12
Time lag
A u t o c o r r e l a t i o n
Time lag
C o n d i t i o n a l a u t o c o r r e l o t i o n
Time lag
F ig u re 2.3: C o r r e la tio n m e a s u r e s a g a in s t t im e lag, of h o u rly (b lu e ), 6-h o u rly ( re d ) a n d
daily (g re e n ) rainfall d a t a , for J u n e 1994 (left) a n d D e c e m b e r 1994 (rig h t) .
7(A:) = c o r r lV n , Vn+A:|^n > > 0}. H owever, since we o b se rv e d t h a t for all p o sitiv e tim e lags, p+ + (& ) is a p p r o x i m a t e l y in d e p e n d e n t o f k a n d eq u a l to F{ Yn > 0)^ = we
ex p e c t t h a t ^ ( k ) is a p p r o x i m a t e l y p r o p o r t i o n a l t o 7(A:), a n d c an be w r i t t e n as
. _ p++(At) EjYr^Yn+k) - pI Ej Vnf
p \ cov{rn,i;+fc} var(y;,|};, > o)
pI v a r(F ^
7(Ai).
var(y^|Fri > 0)
T h e p lo ts of 7(A;) a g a in s t t h e tim e lag k, for t h r e e levels o f a g g r e g a tio n h, a re illu s t r a t e d
in F ig u re 2.3. T h e p a t t e r n s o f t h e tw o c o r r e la tio n f u n c tio n s a re in d e e d very sim ila r a n d
th e closer t o o n e is t h e p ro b a b ility p_|_, t h e closer a re t h e values o f 7(&) a n d j { k ) .
In J u n e , t h e c o rr e la tio n of h o u rly d a t a decay s s h a rp ly , in d ic a tin g a fairly s h o r t lifetim e
Pr(an arbitrary interval is dry)
n o
° 0 4 8 12 16 20 2 4
P r ( s u c c e s s i v e intervals are dry)
°o 4 8 12 16 20 2 4
M o n t h s M o n t h s
CN <N
a 12 16
M o n t h s
a 12 16
M o n t h s
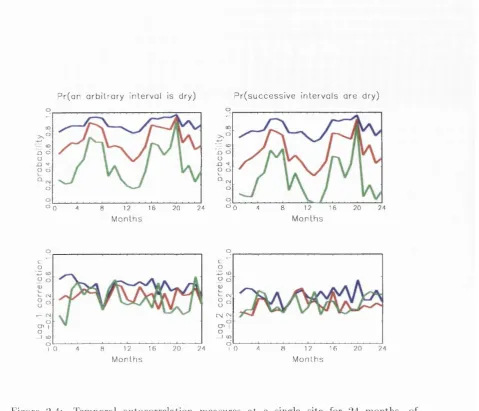
Fig u re 2.4: T e m p o r a l a u t o c o r r e l a t i o n m e a s u r e s a t a single site for 24 m o n t h s , of
h o u rly !b lu e ), 6-h o u rly (r e d ) a n d daily ( g re e n ) rainfall d a t a : p ro b a b ilitie s poo(O) ( t o p
left) an d poo(^) ( t o p rig h t) a n d c o rre la tio n s y ( l ) ( b o t t o m left) a n d 7(2) ( b o t t o m r ig h t)
very s te e p d ro p of j i k ) a n d j ( k ) t o j u s t below zero for sm all t i m e lags, a n d t h e n t h e
following p e a k a t lag 4, which c o r r e s p o n d s to 24 h o u rs. Such b e h a v io u r is q u ite c o m m o n
in s u m m e r m o n t h s , w hen rain is falling d u r in g c e r t a i n h o u rs o f t h e day, usually in t h e
a f te r n o o n . T h e lag 1 c o rre la tio n of daily d a t a is also very hig h , which p o in ts t o t h e
conclusion t h a t d ry p e rio d s t e n d t o last a long t i m e a n d a r e i n t e r r u p t e d by c lu ste rs of ra in y
days. O n t h e o t h e r h a n d , t h e c o rre la tio n fu n c tio n s p ro d u c e d fro m t h e D e c e m b e r d a t a
set a re q u ite s m o o t h , a n d in c o n t r a s t w ith t h e s u m m e r m o n t h s , on ce th e y reach values
close to zero th e y r e m a in fairly s ta b le . Also, t h e rainfall in te n s itie s b e tw e e n successive
days a re a lm o s t u n c o r r e la te d .
F ig u re 2.4 illu s tr a te s t h e sea so n a l variability of t h e p ro b a b ilitie s poo(O) a n d />oo(l)
from January 1994, labeled no. 1, The former exhibit an obvious seasonal pattern, with high values in summer and low values in winter, while the la tte r do not show any dependence with season. It might be interesting to note th a t in August both lag 1 and lag 2 correlations, for all three levels of aggregation (1 ,6 and 24 hours), are very close to zero, mainly because rainfall events during this m onth are sporadic and have very short lifetimes.
2.2
B etw e e n -site s correlation s
In the previous section we looked at some tem poral correlation measures of the rainfall intensity at a fixed point in space. The main purpose, however, of planning and setting up the network of raingauge stations is to study the joint properties of rainfall at several locations and to gain insight into the spaitial structure of an event. The quantities we calculate are between-site properties only, and more specifically, our attention is focused on the following three measures:
• the lag k cross-correlation, ‘Jij{k), between the rainfall intensity at site i, Y n \
observed during an arbitrary time interval of fixed length h, and the one at site j ,
^n+k'> observed kh time units later during a period of the same length;
• the probability th a t two sites, i and j , are both dry, P o o \k ) = F(vJ^^ = = 0),
or both rainy, p+^^(k) = > 0), during arb itrary periods of the
same fixed length h separated by time lag
k-• the lag k cross-correlation, calculated from the pairs th a t have both observations positive, ^ij{k) = corr{T^^\ > 0}, usually referred to as condi
tional cross-correlation.
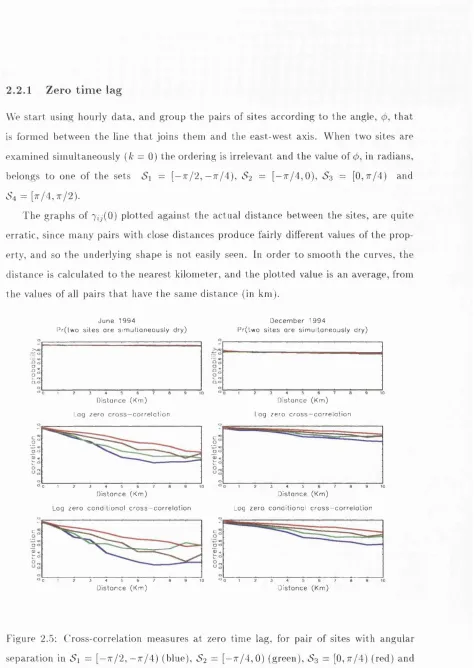
2.2.1 Zero t i m e lag
We s t a r t using h o u rly d a t a , a n d g r o u p t h e p a irs o f sites a c c o rd in g t o t h e angle, t h a t
is fo rm ed b e tw e e n t h e line t h a t jo in s t h e m a n d t h e e a s t- w e s t axis. W h e n tw o sites a re
e x a m in e d s im u lta n e o u s ly {k = Q) t h e o r d e rin g is irrelev an t a n d t h e value o f </>, in r a d ia n s ,
b elongs t o o n e o f t h e sets = [—t t / 2 , —t t / 4 ) , c>2 = [—7 t / 4 , 0 ) , S3 = [0 ,7 t/4 ) and
^4 = [7r /4,7r /2).
T h e g r a p h s o f 7i j (0) p l o t t e d a g a in s t t h e a c t u a l d is t a n c e b e tw e e n t h e sites, a re q u ite
e r r a t i c , since m a n y p a irs w ith close d i s ta n c e s p r o d u c e fairly different values of t h e p r o p
e rty , a n d so t h e u n d e rly in g s h a p e is n o t easily seen. In o r d e r t o s m o o t h t h e cu rv es, t h e
d i s ta n c e is c a lc u la te d t o t h e n e a r e s t k ilo m e te r, a n d t h e p l o t t e d value is a n a v e ra g e , from
t h e values of all p a irs t h a t have t h e s a m e d is ta n c e (in k m ) .
J u n e 1 9 9 4
P r ( l w o s i t e s a r e s i m u l t a n e o u s l y d r y )
D e c e m b e r 1 9 9 4
P r ( t w o s i t e s a r e s i m u l t a n e o u s l y d r y )
D i s t a n c e ( K m ) a g z e r o c r o s s —c o r r e l a t i o n
°o
D i s t a n c e ( K m )
L a g z e r o c o n d i t i o n a l c r o s s - c o r r e l a t i o n
°o
D i s t a n c e ( K m ) L a g z e r o c r o s s - c o r r e l a t i o n
D i s t a n c e ( K m )
Log z e r o c o n d i t i o n o l c r o s s - c o r r e l a t i o n
D i s t a n c e ( K m ) D i s t a n c e ( K m )
F ig u re 2.5: C ro s s - c o r r e la tio n m e a s u re s a t zero t im e lag, for p a ir o f sites w ith a n g u la r
s e p a r a t i o n in S \ =
[ -
t t/
2,
-
7t/
4)
( b lu e ), S2 =[ -
7t/
4,
0)
( g r e e n ) , S3 = [0,7r /4) ( re d ) a n dFigure 2.5 shows the plots of some cross-correlation measures against distance, where the four curves correspond to the different angular separation between sites. The prob abilities p^^(O) and pf|!'^(0) (the la tte r not presented here), do not change appreciably
with the distance or angle, reflecting the fact th a t the Brue area is fairly small compared to the spatial extent of a rainfall event and once a storm hits the catchm ent, it visits all locations more or less simultaneously. On the other hand, the cross-correlation function,
7îj(0), decreases with distance, implying the existence of small-scale elements within the
rainfall event th a t do not cover the whole area, and thus produce high correlations for nearby sites. These elements have a smaller size during summer months th an during winter months, so th a t 7tj(0) decays more sharply in the former than in the la tte r case.
Also, the cross-correlation, 7 i j ( 0 ) , th a t is derived conditionally upon the pair of non-zero
observations, has the same p attern as the unconditional one, but lower values. One of the most interesting features of the graphs is th a t the cross-correlation of the pairs th a t have an angle, ç5>, in the set S3 = [0,7t /4), decays less slowly with distance, compared to
the other sets, while the pair of sites with in <Si = [—t t / 2 , —7 r / 4 ) , which is orthogonal to
^3, has the most rapidly decreasing pattern. This suggests the existence of a prevaihng
orientation, but before drawing any further conclusion we should look at the non-zero lag cross-correlations, which provide more inform ation about the velocity of a storm ’s movement.
2 .2 .2 N o n z e r o t i m e la g s
When two sites are examined in different periods {k / 0), the ordering is im poratant and the angle <f> takes values in the interval [—7 r , 7 r ) , which is partitioned into eight intervals
each of length 7t /4. The cross-correlation function for each one of th e eight groups is
calculated, with distances rounded to the nearest kilometer. Instead of having a graph with eight curves, which would be rather messy to read, we keep the four sets <Si,. . . , «S4
defined earlier, and we assign to each pair of sites a directional distance, which is the actual Euclidean distance if (j) belongs in [—t t / 2 , t t / 2 ] , or its negative value if (f>+Tr belongs
in [—7t /2, t t /2]. So for instance, two points with negative directional distance th a t belong
in group «S3, have an angular separation between —tt and —37t /4, in radians.
J u ne 1994
I ag 1 conditional c r o s s - c o r r e l a t i o n
D ec em b er 1994 Log 1 conditional c r o s s - c o r r e l a t i o n
I
Directional d is ta n c e (Km) I ag 2 conditional c r o s s - c o r r e l a t i o n
- I : 10 - 8 - 6 - 4 - 2 0 2 4
Directional d is ta n c e (Km) Lag 2 conditionol c r o s s - c o r r e l o t i o n
o M
0
O 6
10 -6 B •4 -2 0 2 6 8 10 12
Directional d is ta nc e (Km) Log J conditionol c r o s s - c o r r e l a t i o n
<j S
10 8 5 2 0 2 6 8 10 12
- 1 0 - 8 - 6 - 4 - 2 0 2 4
Directional d is ta n c e (Km) Log 3 conditional c r o s s - c o r r e l a t i o n
Directional d is ta nc e (Km) Directional d is ta n c e (Km)
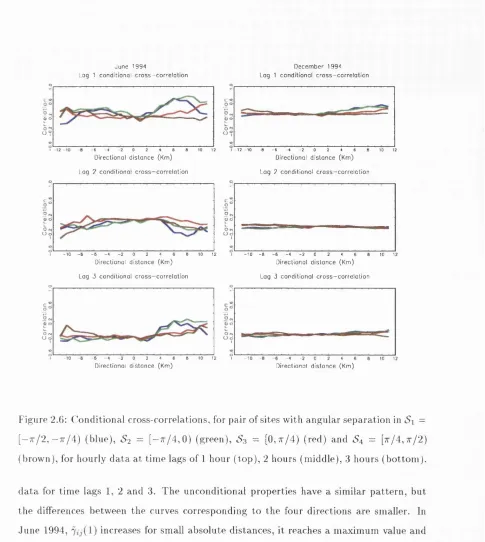
F ig u re 2.6: C o n d itio n a l cro ss-c o rre latio n s , for p a ir o f sites w ith a n g u l a r s e p a r a t i o n in =
[ -
7t/
2, -
7t/
4)
(b lu e ) , j>2 = [ -7r /4,0) ( g re e n ), 4S3 = [0,7r /4) (r e d ) a n d S4 = [7r /4,7r /2)( b r o w n ) , for h o u rly d a t a a t t i m e lags of 1 h o u r ( t o p ) , 2 h o u r s ( m id d le ) , 3 h o u r s ( b o t t o m ) .
d a t a for tim e lags 1, 2 a n d 3. T h e u n c o n d itio n a l p r o p e r tie s h a v e a sim ilar p a t t e r n , b u t
t h e differences b e tw e e n t h e cu rv es c o r r e s p o n d in g to t h e four d ire c tio n s a re sm aller. In
J u n e 1994, in creases for sm all a b s o l u t e d is ta n c e s , it reach es a m a x i m u m value a n d
th e n it s t a r t s d r o p p in g . F rom t h e lo c a tio n a n d t h e h e ig h t o f t h e p e a k , it is possible
t o o b t a i n in f o r m a t i o n a b o u t s t o r m m o v e m e n t a n d t h e degree o f c o rre la tio n b e tw e e n t h e
rainfall in t e n s i t y a t various sites. T h e cu rv e t h a t c o r r e s p o n d s to t h e lag 1 co n d itio n a l
c ro s s -c o rre la tio n o f g r o u p S3 t a k e s its m a x i m u m value for t h e p a irs t h a t a r e f u r t h e s t
a p a r t in t h e B r u e a r e a , a n d it would be very in t e r e s t i n g t o know if it would c o n tin u e to
in crease for la r g e r d is ta n c e s . T h e g r a p h s show t h a t s t o r m s w ith d ire c tio n f ro m n o r th - w e s t
th a t are a distance of roughly 8km apart.
It is believed th a t the initially unexpected increase in the lag 3 cross-correlation for pairs of sites with positive directional distance, is due to the clustering of storm s and the arrival of a new storm , th a t has a general direction from west to east.
Having examined the cross-correlation functions of several other summer months, the conclusion we draw is th a t because of the relatively few storm arrivals during this season, the shapes of the functions are determined by a small number of events, and thus detailed inference about the movement of rainfall can not be made. Indeed, summer months with similar to tal rainfall intensity as June 1994, can produce different patterns for the joint-properties between pair of sites.
The cross-correlation functions for December 1994, on the other hand, remain fairly constant with distance, and there are no obvious differences in the p attern between the various groups of pairs, which is evidence of the very slow movement and wide-spread nature of winter rainfall. Similar things apply to the cross-correlation function of most of the winter months we have examined.
Overall, the conclusion from this analysis is th a t the velocity (speed and direction) of rainfall influences the joint-properties between sites, and thus should be included in the model construction.
2.3
T opographic effects
The topographic effects of the Brue area on the behaviour of the rainfall process have been examined using basic statistical tools and presented graphically. Our analysis is focused on the examination of two effects, the ground altitude and the location within the catchm ent area.
2 .3 .1 G r o u n d a l t i t u d e
The evolution of the process at the various sites for monthly periods, is described via some sum m ary statistics (Appendix A), such as the mean, /t, and standard deviation, s,
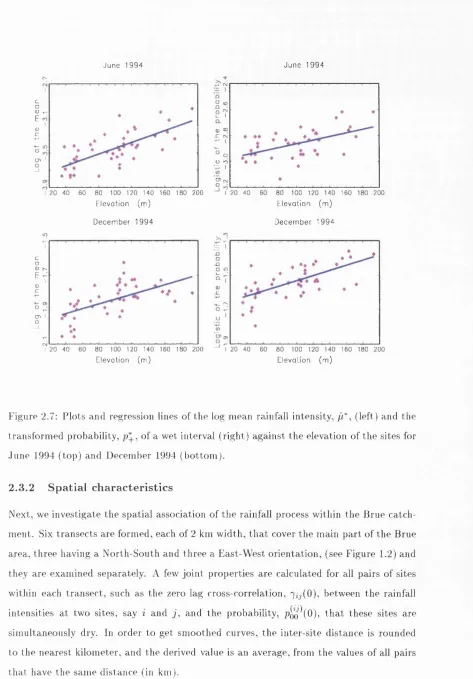
observations only. The time resolution of the d a ta used is 1 hour, since aggregation over larger time periods would smooth the overall p attern and reduce any difference between the sites. Because the variable is constrained to lie between the values 0 and 1, the logistic transform ation, p*^ = ln ( ^^+^ ), is used as a response variable in the regression model. Similarly, the other four statistics th a t take non-negative values, are transform ed using the natural logarithmic function. Each transform ed statistic, y* say, is initially plotted against the altitude, z, of the ground in m etres, for a visual inspection of the underlying pattern . For most m onths, the properties th a t show a linear relationship with the ground elevation are the mean, y* = ln(/i), and the probability, while there seems to be no correlation between the other three statistics and the elevation. So, a regression line, y* = a -f- x, is fitted to the transform ed mean and probability, and the results for June and December are presented here.
W ith reference to Figure 2.7 and Tables 2.1 - 2.2, we notice th a t the regression Hnes fitted to the d ata have statistically significant slopes and explain between about 30% and 50% of the to tal variation between the gauges, of each one of these statistics. So, in describing the behaviour of the rainfall process at several points in space, one should keep in mind th a t p art of the spatial variation of the process is due to the variation in altitude. The decision, however, of w hether to include the elevation of a site in the model building, should be made only with reference to a specific model. In many cases, the simplicity of a model is more desirable th an the incorporation of a factor th a t is not absolutely necessary.
fi* = - 3 . 7 8 2 2 + 0 . 0 0 3 4 x = 4 9 . 2 1 %
Predictor Coef. St.error t-ratio F-ratio
Constant Elevation -3.7822 0.0034 0.0554 0.0005
-6 8 . 2 2 1 1
6.4552
41.67
pI = -3.00 16 + 0.0014 X = 29.45%
Predictor Coef. St.error t-ratio F-ratio
Constant Elevation -3.0016 0.0014 0.0353 0.0003 -85.1129 4.2362 17.95
Table 2.1: Regression statistics for the log of the mean and the logistic of the probabihty th a t an arbitrary interval is rainy, for June 1994.
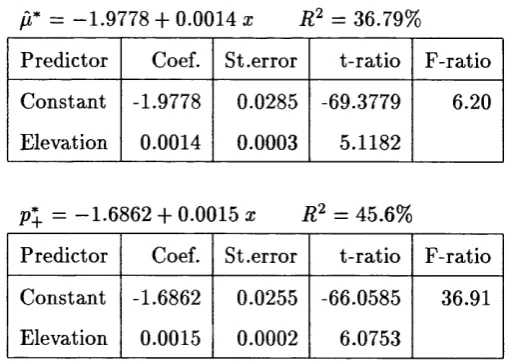
fi* = -1.9778 + 0.0014 X = 36.79%
Predictor Coef. St.error t-ratio F -ratio
C onstant Elevation -1.9778 0.0014 0.0285 0.0003 -69.3779 5.1182
6 . 2 0
pX = -1.68 62 + 0.0015 x = 45.6%
Predictor Coef. St .error t-ratio F-ratio
C onstant Elevation
-1.6862 0.0015
0.0255
0 . 0 0 0 2
-66.0585 6.0753
36.91