GURMUKHI TEXT EXTRACTION
FROM IMAGE USING
SUPPORT VECTOR MACHINE (SVM)
SUKHWINDER KAUR* GURPREET SINGH JOSAN**
*Lecturer, Department of Information technology
Satguru Ram Singh Government Polytechnic College for Girls, Rishi Nagar, Ludhiana-141001, Punjab (India)
**HOD & Assistant Professor, Department of Information Technology
Rayat & Bahra College of Engg. and Bio-Technology, Sahauran, Dist Mohali, Punjab (India)
ABSTRACT
Extensive research has been done on image classification for different purposes like face recognition, identification of different objects and identification/extraction of text from image having some background. Text identification is an active research area where by system tries to identify the text area in a given image. Text area identified is then passed to OCR system for further recognition of the text. This work is about classifying image area in two classes text and non text using SVM (support vector machine). We identified the features and train a model based on the feature vector which is then used to classify text and non text area in an image. The system reports 70.5% accuracy for caption text images, 70.43% for document text images and 50.40% for scene text image.
Key words: - SVM; connected components; gurmukhi text; text identification.
1. Introduction
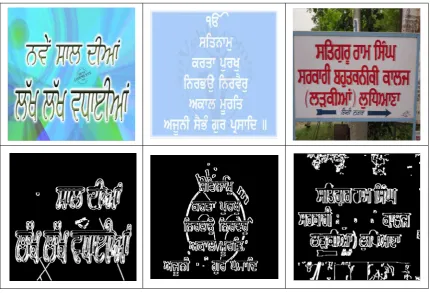
Text data present in images and video contain useful information for automatic annotation, indexing, and structuring of images. Extraction of this information involves detection, localization, tracking, extraction, enhancement, and recognition of text [Jung, et al. (2004)]. In image text can occur in following way: Document text image some part of image contain text and some image in this type of document image is embedded in document, Caption text image a caption, also known as a cutline, and is text that appears below the image. Most captions draw attention to something. Caption can consist of a few words of descriptions, or several sentences and Scene text Image in which text is embedded into the image as shown in fig. 1(a) to 1(c)
(a) (b) (c) Fig.1. (a) Document Text, (b) Caption Text (c) Scene Text
embedded and caption text. Our approach is to identify the features of gurmukhi script characters and then using these features. We train SVM for further classification of text in images. We target for identification of Gurmukhi text. We have used a hybrid method based on heuristic constraints, edge detection and connecting into clusters. We have used four step method to solve this problem: Processing the image to form connected components, finding out candidate text components , feature extraction and then in last step SVM is used to identify text components using various features ( height , width , area , horizontal and vertical difference between connected componets ). In section 2, we discuss the related work followed by description of Gurmukhi scripts and problems in identification of Gurmukhi text in Images. In section 4, our methodology is described; data set description, experiments and result are in last sections.
2. Related Work
This section provides the background about the text extraction systems and explores the work done by the researchers. An effective algorithm studied for character recognition in scene images. Scene images are segmented into regions by an image segmentation method based on adaptive thresh holding. Character candidate regions are detected by observing gray-level differences between adjacent regions. To ensure extraction of multi-segment characters as well as single-segment characters, character pattern candidates are obtained by associating the detected regions according to their positions and gray levels. A character recognition process selects patterns with high similarities by calculating the similarities between character pattern candidates and the standard patterns in a dictionary and then comparing the similarities to the thresholds. A relaxational approach to determine character patterns updates the similarities by evaluating the interactions between categories of patterns, and finally character patterns and their recognition results are obtained. Highly promising experimental results have been obtained using the method on 100 images involving characters of different sizes and formats under uncontrolled lighting. The system results 71.1% correct judgments of connected pattern components with out relaxation and 85.7% with relaxation [Ohya, et al. 1994].
A method through the binarization of gray-scale image for text extraction was introduced in late nineties. [Lee and Park, 1996]. In this methodology the character segmentation regions are determined by using projection profiles and tropographic features extracted from the gray-scale image. Then a nonlinear character segmentation path in each character segmentation region is found by using multi-stage graph search algorithm. Finally in order to confirm the non-linear character segmentation paths and recognition results, recognition based segmentation method is adopted. Through the experiments with various kinds of printed documents, it is convinced that the proposed methodology is very effective for the segmentation and recognition of touched and overlapped characters. This system gives recognition rate of 92.7% with 0% letter spacing, 91.7% with -4% letter spacing and 90.4% with -7% letter spacing.
Lu (1998) used directly the principal of erasing non-text regions from mixed text and graphic engineering drawings rather than extract text regions. This algorithm can be used for both Chinese and western characters, dimensions and symbols and has few limitations on the kind of engineering drawings and noise level. It is robust to text-graphics touching, text font and written orientations. [Wu and Manmatha, 1999] proposed a robust system to automatically detect and extract text in images from different sources including video, newspapers, advertisements, stock certificates, photographs and checks. Text is first detected using multi-scale texture segmentation and spatial cohesion constraints, then cleaned up and extracted using a histogram–based binarization algorithm. An automatic performance evaluation scheme is also proposed. The system detected 92% of characters with a height greater than 10 pixels.
A very interesting work on fast and robust text identification in image and video frame by Chen, et al (2000). The authors developed two-step method for text line extraction and SVM-based text identification. In the first step, candidate text regions are quickly extracted by using edge analysis and further segmented into text lines on the basis of baseline location and heuristic constraints at the aim of producing high text location rate and reasonable false alarms. In the second step the candidate text lines are identified by using a support vector machine (SVM) trained in a distance map feature space to lower the alarm rate. In this project SVM was trained on a database consisting of 6000 samples labelled as text or non-text using the software package developed at IDIAP and called SVMTorch. The algorithm is reported to achieve high identification rate, as well as low false rate. It also reported by authors that, in fast text line extraction phrase, this algorithm is faster than other fast text identification methods. The fast extraction algorithm correctly extract about 99.3% text lines but at the cost of high FFR (false region alarm rate) 15.4% and FPR (false pixel alarm rate) 2.13%. After applying the SVM identification FFR drops to 1.7% and FPR to 0.38% while preserving a high IR as 98.7%.
sequence before extracting the text regions, this method locates candidate caption text regions directly in the DCT compressed domain using the intensity variation information encoded in the DCT domain. Therefore, only a very small amount of decoding is required. The proposed algorithm takes about 0.006 second to process 240-350 images and achieves a recall rate of 99.17 percent while falsely accepting about 1.87 percent non text DCT blocks on a variety of MPEG compressed videos containing more than 2300 I-frames.
The algorithm for detecting devanagri text in diverse categories of digital images was beautifully prescribed [Kaushik and Jawahar, (2001)]. The authors decompose the input images into set of binary images where connected components are analysed for the possible presence of devangri characters. Structural characteristics of the devanagri script are statistically analysed for estimating the lower and upper bounds of the features employed. Results are demonstrated on real life images comprising of internet images, video scene and document pages. The spatial domain solution is a fast and excellently in the case of the binary images. In case author advise a method that would reduce all the problems to the analysis of the binary images that would be able to solve problems of varying nature. The solution proposed focussed attention on three specific aspects:
1. Reduce a multicoloured image into an image of few colours.
2. Obtaining a set of foreground images from this reduced colour images.
3. Analyzing each of these images for the presence of the Devanagri text based on the statistical aspects.
An efficient and computationally fast method to extract text regions from documents was developed by Audithen and co-workers. Authors employed Haar discrete wavelet transform (DWT) to detect edges and then line feature vector graph is generated based on the edge map and the stroke information is extracted. Finally text regions are generated and filtered according to line features. Experimental results show that, without increasing the computational cost, proposed method could suppress the false alarms notably. Furthermore, method can be easily customized for applications with different tradeoffs in recall and precision. The experimental results show that proposed detection method can achieve 94.8% detection rate and 7.1% false alarm rate [Audithen and Chandershekhar, 2009].
3. Gurmukhi Script
Gurmukhi script group the letters according to their sounds in to consonants and vowels .Gurmukhi script alphabet consists of 41 consonants, 12 vowels and 3 half characters which lie at the feet of consonants [Sharma and Singh, (1995)].
3.1 Consonants
The first three letters are unique because they form the basis for vowels shown in Table 1-(a). Table 1-(b) shows remaining consonants. In addition to these, there are six consonants created by placing a dot (bindi) at the foot (pair) of the consonant shown in Table 1-(c).
Table.1 Gurmukhi Script Consonants
ੳ ਅ ੲ
(a)
ਸ ਹ ਕ ਖ ਗ ਘ
ਙ ਚ ਛ ਜ ਝ ਞ
ਟ ਠ ਡ ਢ ਣ ਤ
ਥ ਦ ਧ ਨ ਪ ਫ
ਬ ਭ ਮ ਯ ਰ ਲ
ਵ ੜ
( b)
ਸ਼ ਖ਼ ਗ਼ ਜ਼ ਫ਼ ਲ਼
3.2 Vowels
All consonants are followed by an inherent ‘a’ sound (unless at the end of a word when the ‘a’ is usually dropped). This inherent vowel sound can be changed by using dependent vowel signs (Table 2) which attach to a baring consonant. In some cases, dependent vowel signs cannot be used – at the beginning of a word or syllable for instance – and so an independent (Table 3) vowel character is used instead.
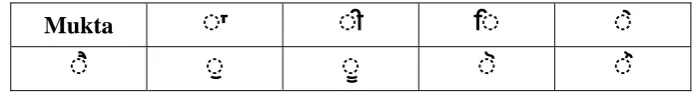
Table2. Dependent Vowels
Mukta
◌ਾ
◌ੀ
ਿ◌
◌ੇ
◌ੈ
◌ੁ
◌ੂ
◌ੋ
◌ੌ
Vowels are always pronounced after the consonant they are attached to. Thus, Sihari is always written to the left, but pronounced after the character on the right.
Table3. Independent Vowels
ਅ
ਆ
ਇ
ਈ
ਏ
ਐ
ਉ
ਊ
ਓ
ਔ
3.3 Subjoined consonants (Half characters)
Some Punjabi words require consonants 1to be written in a conjunct form, which takes the shape of a subscript to the main letter. The second consonant is written under the first as a subscript. There are only three commonly used subjoined letters and to distinguish them from their normal forms the word ਪੈਰ (pairin), which means belonging to the foot, is attached under the letter are shown in Table4
Table4. Subjoined Consonants
◌੍ਰ
◌੍ਹ
◌੍ਵ
A word in Gurmukhi script can be partitioned into three horizontal zones. The upper zone denotes the region above the headline, where the vowels reside, while the middle zone represents the area below the head line where the consonant and sub-parts of the vowels are present. The middle zone is the busiest zone. The lower zone represents the area below middle zone where some vowels and certain half characters lie at the feet of consonant as shown in Fig. 2.
Fig. 2 Three Zones of Gurmukhi Script Word
The distribution of Gurmukhi script in printed text is given as: 1. Upper zone 25.39%
2. Middle zone 70.71% 3. Lower zone 4.20%
3.4 Problems in identification of Gurmukhi text in images
Work for identification of English text in images has been discussed extensively in literature. Although this work provide initial understanding of the problem but it can not be extended as such for Indian languages. There are lots of differences among features of script in English and Gurmukhi which makes the task in hand a challenging one. Following points elaborate these differences:
width of word is not constant. For example: in word ‘PUNJABI’ all the characters P, U, N, J, A, B, and I form different regions where as word “ਪੰਜਾਬੀ” makes one complete isolated region. 2. In English, minimum height is fixed according to height of character but in Gurmukhi, minimum height of
the region can not be fixed according to the height of character. This is because Gurmukhi script have dependent vowels small in size as compared to character. For Example in English ‘A’, ‘B’, ‘C’ etc…. and in Gurmukhi ◌ੀ◌ਾ◌ੁ◌ੂ.
3. Gurmukhi script is divided into 3 zones: upper zone set, middle zone set and lower zone [Sharma and Singh, (1995)]. This division is shown in fig. 2. consonants always lie in the middle zone, vowels may be in upper or lower zone and may be part of middle zone and half character lie in the lower zone where some of the vowels in the upper zone are connected to middle and some are not connected they form separate components and the vowels in the lower zone are always isolate from the middle zone we have to identify these vowels as separate components where as all consonants and vowels are isolated in English.
4. We can not use any specific threshold value or range for the area of region due to variable length of Gurmukhi words, but in English every character form a separate component so size of word does not effect character area. For example in English there are words, ‘NO’, ‘YES’, ‘GOOD’ and ‘HELLO’ etc. and in Gurmukhi 'ਹਾਂ', 'ਨਹੀ', 'ਪੰਜਾਬ' and 'ਵਾਿਹਗੂਰੁ' .
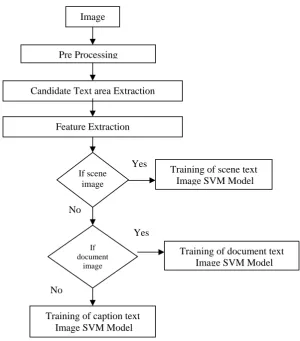
4. Proposed Text Extraction System
This method consists of four phases: Candidate text extraction, Feature extraction, Training SVM Model and SVM based text identification. Flow chart for training SVM model is shown in fig 3(a) and flow chart for testing the SVM model is shown in fig. 3(b).The system is trained with three types of image scene text image, document text image and caption text image. Three SVM model are generated for these three types of images. In section 4.1 we discuss candidate text region extraction, in 4.2 feature extractions and in 4.3 SVM based classification.
Yes
No
Yes
No
Fig. 3(a) Flowchart for training of SVM Model
Image
Pre Processing
Candidate Text area Extraction
Feature Extraction
If scene image
If document
image
Training of scene text Image SVM Model
Training of document text Image SVM Model
Yes
No
Yes
No
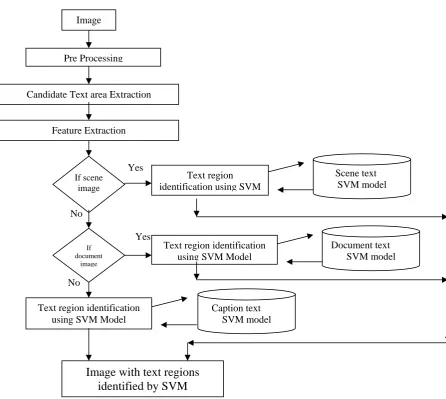
Fig. 3 (b) Flowchart for testing of SVM based text Extraction system
4.1.Candidate text region extraction
In this step image having Gurmukhi text is taken as input, text regions will be extracted from image by exploiting two characteristics. First, a visible character always forms some edges against its background. Second, a text string has a special set of features like height, horizontal alignment, ratio of height and width etc. After reading the image it is converted into gray scale image and then edges are detected using canny edge detector operator. Edge detection is a fundamental tool in image processing and computer vision, particularly in the areas of feature detection and feature extraction, which aim at identifying points in a digital image at which the image brightness changes sharply or more formally has discontinuities. In the ideal case, the result of applying an edge detector to an image may lead to a set of connected curves that indicate the boundaries of objects, the boundaries of surface markings as well as curves that correspond to discontinuities in surface orientation. Thus, applying an edge detection algorithm to an image may significantly reduce the amount of data to be processed and may therefore filter out information that may be regarded as less relevant, while preserving the important structural properties of an image. If the edge detection step is successful, the subsequent task of interpreting the information contents in the original image may therefore be substantially simplified.
After detecting edges morphological dilation is employed to connect edges into clusters. Dilation adds pixels to the boundaries of objects in an image; the number of pixels added to the objects in an image depends on the size and shape of the structuring element used to process the image. We have used 6x3 rectangle shape structuring element for horizontal dilation and 1x5 for vertical dilation. This shape is suitable for text detection because by increasing size of this element it forms large components and joins maximum components with each other in image and does not form isolate text and non-text components. Small structuring element generates extra
Image
Pre Processing
Candidate Text area Extraction
Feature Extraction
If scene image
If document
image
Text region identification using SVM
Text region identification using SVM Model
Text region identification using SVM Model
Scene text
SVM modelDocument text SVM model
Caption text SVM model
number of components which increase complexity of image by increasing no. of components for a word. Non text area usually formed by isolated or long vertical and horizontal edges do not occupy the same place in both vertical and horizontal dilated edge image at the same time , they can be removed by using an AND operation to vertical and horizontal dilated edge image . The image after each of above steps is shown in fig 4a -5d
Fig 4. a) Grey-scale Image
a b
c d
Fig5 a) Edges detected using Canny edge detector b) Horizontal dilation c) Vertical dilation d) AND result of a and b .
The resulting image contain both text and non-text components. The image is passed to preprocessing stage where some non text connected components are removed based on some features like
1. If height of component is less then 4 pixels then it is removed. The minimum height of 4 pixels is taken because of shape and small size of vowel in gurmukhi i.e. bindi which has minimum size.
2. If height of component is greater than 200 pixels then it is highly unlikely to be a character. Such components are removed.
3. The width to height ratio of the component is less then 50% then such components are removed. In case of smallest character or word, width should be at least 50% of the height. It is observed from experiment on characters and small words.
Fig 6. Candidate text region
The remaining components are considered as candidate text region. The SVM classification technique is used to further classify the text and non text region.
4.2. Feature extraction
In pattern recognition and in image processing, feature extraction is a special form of dimensionality reduction. When the input data to an algorithm is too large to be processed and it is suspected to be notoriously redundant (much data, but not much information) then the input data will be transformed into a reduced representation set of features (also named features vector). Transforming the input data into the set of features is called feature extraction. Similarly in present project the remaining components are considered as candidate text region. The SVM classification technique is used to further classify the text and non text region. The SVM classify the region based upon the features of component. A feature is a binary function of the form:-
f(x) = yi Where yi ϵ {0, 1} … (1)
Here x is an input feature and y denotes the value of that feature whether 0 or 1 .0 represents the non-text and region 1 represents text region. For each connected component a set of features is prepared known as vector, each vector marked with a label 0 or 1 where 0 is for non-text connected component and 1 is for text component. How these features are extracted is explained below:
A vector containing feature value is prepared for each component as follow
1. Minimum Height of component: This feature is based upon minimum height of component, if height is less then 30 pixels then set this feature value 0 and if greater than 30 pixels set it to 1. Height is calculated by performing horizontal projection and then counting number of non zero values in the projection result.
2. Difference between middle and upper zone: We find headline by obtaining horizontal projection of component as shown in fig 7. It is that part of component which has maximum value in horizontal projection. Headline seperates the upper and middle zone. The height of middle zone (difference between upper and lower zone) and upper zone (above the headline) is obtained using this headline. Gurmukhi text will always have greater height below the headline.
Fig.7 Horizontal Projection
3. Maximum height of component: This feature is based upon maximum height of component, if height is less then 200 pixels then set this feature value 1 and if greater than 200 pixels set it to 0. Height is calculated by performing horizontal projection and then counting number of non zero values in the projection result.
5. Height width ratio: If width of component is greater then 50% of height of component set this property to 1 otherwise set it to 0.
6. Ratio of the text to non text area: The next feature is the ratio of the text to non text area in connected component. If at least half the pixels out of total in region are in text area then this feature is set to 1 otherwise 0 [Kaushik and Jawahar].
7. Distance between two text lines: If vertical distance of neighboring connected components is between 5 to 30 then this property is set to 1 otherwise it is 0.
4.3.SVM based classification
SVM (support vector machine) is a technique motivated by statistical learning theory. It is used for classification. 1-SVMs are derived from classical SVMs for solving density estimation problems [Hoi and Chen]. We have considered 2-SVMs in the binary classification setting [Feng, et al.]. We are given training data {x1...xn} that are vectors in some space xϵ Rd. We are also given their labels {y1 ... yn} where yiϵ {-1, 1}. SVMs are simply hyper planes that separate the training data by a maximal margin. All vectors lying on one side of the hyper plane are labelled as -1; those on the other side are labelled as +1. Training instances that lie closest to the hyper plane are called support vectors. More generally, SVMs allow us to project the training data in space x to a higher dimensional feature space F via a Mercer kernel operator K. In other words, we consider the set of classifiers of the form:
… (2)
When f(x) ϵ 0 we classify x as +1 (class 1); otherwise we classify x as -1 (class 2). SVMs are designed for binary classification. On the basis of 7 features (given in sec 4.2) a training file is created that file is given to the SVM for training. It separates the vectors (set of futures) into two classes text and non-text on the basis of feature values by label. We use SVM software named libsvm 2.9.1 developed by Chung Chang and Chih-Jen Lin. Image in fig. 6 is given to svm for text identification; it contains 78 text components and 22 non-text. SVM model detects components as given in table 5.
Table 5. Components Detection in Sample Image
Components detected No. of components
Text as text 75
Text as non-text 3
Non-text as non-text 11
Non-text as text 11
From above table it is clear that there are 14 false detections and 86 true detections. In false detection it detects 3 text components as non text and removes them and 11 non text as text and keeps them in image. In true detections it detects 75 text components as text keep them in image and 11 non text components as non-text and remove them. The resulting image is given in fig. 8.
Fig 8. Components marked as text by SVM
Data set is a collection of data on which we can perform some operation to obtain useful results. We have collected heterogeneous images from various sources like internet, by camera from various places like school, university, sign boards etc. We have used these images for training and testing the system. All these images include Gurmukhi text and some objects other than text also. Data base includes 85 caption text images, 40 document text images and 67 scene text images. SVM is trained with 3900 no. of samples labeled as text and non-text components and is tested on 350 samples for caption text SVM model. SVM is trained with 1700 no. of samples labeled as text and non-text components and is tested on 300 samples for document text SVM model. SVM is trained with 3600 no. of samples labeled as text and non-text components and is tested on 420 samples for scene text SVM model.
5.2.Performance metrics
Metrics used to evaluate the performance of the system are Precision, Recall and F-Score. Precision and Recall rates have been computed based on the number of Correctly Detected Characters (CDC) in an image, in order to evaluate the efficiency and robustness of the algorithm. The metrics are as follows:
5.2.1. False Positives (FP)
False alarms are those regions in the image which are actually not characters of a text, but have been detected by the algorithm as text.
5.2.2 False Negatives (FN)
Misses are those regions in the image which are actually text characters, but have not been detected by the algorithm.
5.2.3 Precision rate (P)
It is defined as the ratio of correctly detected characters to the sum of correctly detected characters plus false positives as represented in equation below.
CDC (True Positive) P = --- X 100%
CDC+FP
5.2.4 Recall rate (R)
It is defined as the ratio of the correctly detected characters to sum of correctly detected characters plus false negatives as represented in equation below.
CDC (True Positive) R = --- X 100% CDC+FN
5.2.5 F-Score
It is the harmonic mean of precision and recall rate as represented in equation below. Precision * Recall
F-Score = 2 x --- Precision + Recall
5.3.Experimental Setup
Experiments are performed using various sets of features to find out the optimal set. To minimize the chance of biasness in results, three cases are developed by selecting data for training and testing from different portions and the results of three cases are averaged. Cases are as follows for three different types of images.
5.3.1. Caption text image
First case uses first 3900 samples (from 1 to 3900) for training and last 350 samples (from 3901 to 4250) for testing. In second case uses last 3900 samples (from 351 to 4250) for training and first 350 samples (from 1 to 350) for testing. In third case, 350 samples from middle i.e. From 1951 to 2300 are used for testing and rest of the samples are used for training. These samples are taken from 85 caption text images.
First case uses first 1700 samples (from 1 to 1700) for training and last 300 samples (from 1701 to 2000) for testing. In second case uses last 1700 samples (from 1701 to 2000) for training and first 300 samples (from 1 to 300) for testing. In third case, 300 samples from middle i.e. From 901 to 1200 are used for testing and rest of the samples are used for training. These samples are taken from 40 scene text images.
5.3.3 Scene text images
First case uses first 3600 samples (from 1 to 3600) for training and last 420 samples (from 3601 to 4020) for testing. In second case uses last 3600 samples (from 421 to 4020) for training and first 420 samples (from 1 to 420) for testing. In third case, 420 samples from middle i.e. From 1801 to 2220 are used for testing and rest of the samples are used for training. These samples are taken from 67 scene text images. In every case, different sets of features are developed starting from single feature and adding one feature incrementally in order to get following sets:
Set 1: It includes single feature that is first feature discussed in sec. 4.2. Set 2: It includes first 2 features i.e. 1 & 2 from sec 4.2
Set 3: It includes first 3 features 1, 2 & 3 from sec 4.2 Set 4: It includes first 4 features 1, 2, 3 and 4 from sec 4.2 Set 5: It includes first 5 features 1, 2, 3, 4 and 5 from sec 4.2 Set 6: It includes first 6 features 1, 2, 3, 4, 5 and 6 from sec 4.2 Set 7: It includes all from 1 to 7 features discussed in sec 4.2
SVM is trained with these sets one by one to find optimal set of feature. Results from various sets are given in next section.
5.4 Results
Accuracy percentage of different sets in different cases are given in table 6(a) to 6(c).
Table 6. (a) Accuracy for Caption text images
Set 1 Set 2 Set 3 Set 4 Set 5 Set 6 Set 7
Case 1 57.59 58.90 58.90 58.90 58.90 57.32 57.32
Case 2 65.96 67.53 67.53 67.53 67.53 68.32 68.89
Case3 81.15 82.19 82.19 82.19 82.19 72.25 84.29
Average 68.23 69.54 69.54 69.54 69.54 65.96 70.50
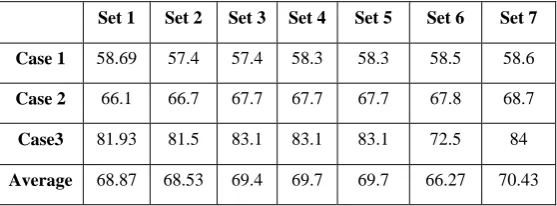
Table 6. (b) Accuracy for Document text images
Set 1 Set 2 Set 3 Set 4 Set 5 Set 6 Set 7
Case 1 58.69 57.4 57.4 58.3 58.3 58.5 58.6
Case 2 66.1 66.7 67.7 67.7 67.7 67.8 68.7
Case3 81.93 81.5 83.1 83.1 83.1 72.5 84
Table 6. (c) Accuracy for Scene text images
Set 1 Set 2 Set 3 Set 4 Set 5 Set 6 Set 7
Case 1 35.2 35.2 35.2 35.2 35.2 34.89 37.89
Case 2 40.12 42.25 42.25 42.25 42.25 42.25 45.8
Case3 62.35 62.5 62.5 62.5 62.5 60.87 67.52
Average 45.89 46.65 46.65 46.65 46.65 46.00 50.40
From above table, it is clear that set 7 which include all features, gives best result. The system gives 70.50% accuracy for caption text images, 70.43% for document text images and 50.40% for scene text images.
1. We can see that there is little difference between accuracy of document and caption text image and difference increase as compared with scene text image. In document and caption text images background is plane that’s why it reports same accuracy/detection rate, where as in scene text background is not plane it includes objects other than text and their edges are connected with some text components and they forms different shape as compared to text component and system failed to detect those components and accuracy/detection rate is decreased as compared to caption and document text image.
2. It is also clear from the results that there are some false detection the reason behind this is that some text components may fulfill the criteria of non-text and vise versa. It can be improved by more training of SVM.
5.5. Performance Analysis and Testing
The algorithm is tested on the oriented text in horizontal direction. The output images of the proposed algorithm in Figure 9, 10 and 11 consist of detecting text for caption text, document images and scene text respectively. The results obtained by the proposed algorithm on three types of sample images are presented in Table 7 where the number of true positives, number of false alarms/False positives, Number of false negatives/misses and the corresponding values for precision, Recall and F-score are listed. Average of all measures for three types of images has been listed in Table 8.
Fig 10 Text Extraction for Document text image
Table 7 Performance measures for the proposed method (for sample Images) Image Type Image Name TP/ Detections FP/False Alarms FN/
Misses Precision Recall F-Score
Document Image
Doc 47 29 22 9 56.86 76.32 65.17
Doc 43 57 14 11 80.28 83.82 82.01
Doc 23 42 14 19 75 68.85 71.79
Caption Image
Cap 56 11 18 1 37.93 91.67 53.66
Cap 18 14 21 3 40 82.35 53.85
Cap 48 9 36 3 20 75 31.58
Scene Image
Scene 9 11 4 3 73.33 78.57 75.86
Scene24 29 17 2 63.04 93.55 75.32
Scene13 31 43 10 41.89 75.61 53.91
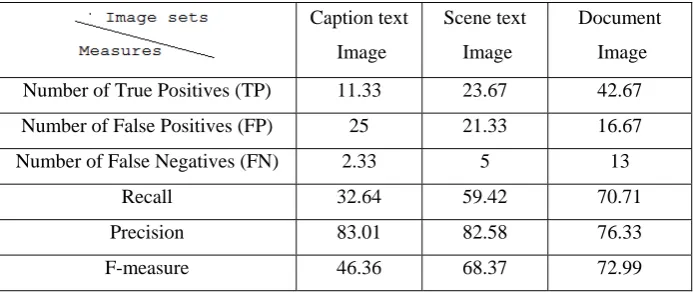
Table 8 Average performance measure for the proposed method
Caption text Image Scene text Image Document Image
Number of True Positives (TP) 11.33 23.67 42.67
Number of False Positives (FP) 25 21.33 16.67
Number of False Negatives (FN) 2.33 5 13
Recall 32.64 59.42 70.71
Precision 83.01 82.58 76.33
F-measure 46.36 68.37 72.99
After experimenting it has been found that the average F-score of caption text images dropped down when compared to scene text images & document images, because of large number of false positive alarms inside the image.
5.6 Discussion
There are systems which utilize color information to detect text in color images; the system described in this project does not use color. Our system starts by extracting edges from gray-scale image (strokes). In general color edges are also intensity edges. Thus, "strokes" which were originally in color are usually still present in the converted gray-scale image. It is possible that some of the characters may be printed in colors that have little monochrome contrast with the background, thereby causing our system difficulty. However, we believe (and our results show) that such characters are not common. The system presented is not sensitive to image resolution. It works particularly well in extracting text from textured and/or hatched background. However, it tends to have problems extracting very small text or text with poor contrast, as all systems do. Reasons for this include the difficulty of extracting strokes under these circumstances and also misclassification by the texture segmentation phase when the contrast is poor.
6. Conclusion
6.1 Future Work
Future works on this topic include the following:
1. System identifies some false components as text and fails to identify some true components. The main problem is with very small components like dependent vowels (which forms separate connected components). This is because they do not satisfy the conditions which are satisfied by characters. Accrucy can be improved by making some rules for these components. In future we try to improve the system performance by working in this direction.
2. One of major weakness of our algorithm resides on its assumption that all text is oriented in the same direction, which is by default horizontal. This makes the algorithm not suitable to deal with documents with multiple layout styles, which means modification is still needed to cope with more sophisticated cases.
3. Currently, we do not use the intensity information and color information to locate the text; since captions could have a large color contrast from their background and also the intensity contrast, the use of color information can improve the performance of the proposed method.
4. We plan to use OCR system to check the Recognition performance for the text images produced by the proposed method.
Acknowledgment
I would like to express my deep and sincere gratitude to my Guide Dr. Gurpreet Singh Josan, HOD & Assistant Professor, Department of Information Technology Rayat & Bahra College of Engg. and Bio-Technology, Sahauran, Dist Mohali for the continuous support of my work, for his patience, motivation, enthusiasm, and immense knowledge. I get the pleasure to present my cordial thanks for his consultation, which has been an invaluable resource throughout all levels of this work. His understanding, encouraging and personal guidance have provided a good basis for the present work. I would like to thank my family: my parents Mr. Dalip Singh Sidhu and Mrs. Rajinder Kaur Sidhu for supporting me throughout my life: and my husband, Mr. Dharminder Singh Cheema, for his encouragement and suggestions without which I would not have been in position to complete this project. Above all, I thank ‘GOD’ for making this mortal venture possible.
References
[1] Audithan, S.; Chandrasekaran, RM.(2009): Document Text Extraction from Document Images Using Haar Discrete Wavelet Transform European Journal of Scientific Research ISSN 1450-216X Vol.36 No.4, pp.502-512
[2] Chen, D.; Bourlard, H.; and Thiran, J. P.(2001): Text Identification in Complex Background using SVM, Proc. of IEEE Conference on Computer Vision and Pattern Recognition, Vol. 2, pp. 621-626.
[3] Feng, X.; Fang, J.; and Qiu, G.; (2003): “Color photo categorization using compressed histograms and Support” In International Conference on Image Processing ICIP’03.
[4] Hoi, C.; Chan, C. (2004): “Biased support vector machine for relevance feedback in Image Retrieval” In Proceedings International Joint Conference on Neural Networks. pp 3189-3194
[5] Jain, A. K.; Karu K. (1994): Learning Texture Discrimination Masks, IEEE Transactions on Pattern Analysis and Machine Intelligence, 4374-4379.
[6] Jung, K.; Kim, K.; Jain, A. K. (2004): Text information extraction in images and video: a survey, the journal of the Pattern Recognition society.
[7] Kaushik, V.; Jawahar, C.V. 2001: “Detection of Devanagiri Text in Digital Image using Connected Component Analysis” Proceeding of the national Conference on Document Analysis and Recognition (NCDAR) Mandya, India. Pp. 41--48.
[8] Lee S.W.; Lee D.; Park H.(1996): , A new methodology for gray-scale character Segmentation and recognition , IEEE transaction on pattern analysis and machine intelligence .
[9] Lehal, G. S.; Singh, C. (1999): “Feature Extraction and Classification for OCR of Gurmukhi Script” Vivek. Vol. 12. No. 2, pp. 2-12. [10] Lu, Z. (1998): Detection of Text Region from Digital Engineering Drawings, IEEE transaction on pattern analysis and machine
intelligence, vol- 20, no. 4.
[11] Ohya, J.; Shio A.; Akamatsu, S. (1994): Recognizing Characters in Scene Images, IEEE transactions on pattern analysis and machine intelligence. Vol. 16, no. 2, February 1994.
[12] Sharma, R. k.; Singh, A. (1995): Segmentation of Handwritten Text in Gurmukhi Script, International Journal of Image Processing, Volume (2).
[13] Wu, V.; Manmatha, R. (1999): Text Finder An automatic System to detect and recognize text in images.