ISSN Online: 2327-4379 ISSN Print: 2327-4352
DOI: 10.4236/jamp.2017.59159 Oct. 16, 2017 1892 Journal of Applied Mathematics and Physics
Automatic Alzheimer’s Disease Recognition
from MRI Data Using Deep Learning Method
Suhuai Luo
1*, Xuechen Li
2, Jiaming Li
3, for the Alzheimer’s Disease Neuroimaging Initiative
*1School of Electrical Engineering and Computing, The University of Newcastle, Callaghan, Australia 2School of Computer Science, Shenzhen University, Shenzhen, China
3Quantitative Imaging Research Team, CSIRO Data61, Marsfield, Australia
Abstract
Alzheimer’s Disease (AD), the most common form of dementia, is an incura-ble neurological condition that results in a progressive mental deterioration. Although definitive diagnosis of AD is difficult, in practice, AD diagnosis is largely based on clinical history and neuropsychological data including mag-netic resource imaging (MRI). Increasing research has been reported on ap-plying machine learning to AD recognition in recent years. This paper presents our latest contribution to the advance. It describes an automatic AD recognition algorithm that is based on deep learning on 3D brain MRI. The algorithm uses a convolutional neural network (CNN) to fulfil AD recogni-tion. It is unique in that the three dimensional topology of brain is considered as a whole in AD recognition, resulting in an accurate recognition. The CNN used in this study consists of three consecutive groups of processing layers, two fully connected layers and a classification layer. In the structure, every one of the three groups is made up of three layers, including a convolutional layer, a pooling layer and a normalization layer. The algorithm was trained and tested using the MRI data from Alzheimer’s Disease Neuroimaging Initia-tive. The data used include the MRI scanning of about 47 AD patients and 34 normal controls. The experiment had shown that the proposed algorithm de-livered a high AD recognition accuracy with a sensitivity of 1and a specificity of 0.93.
Keywords
Alzheimer’s Disease, AD, Recognition, Magnetic Resource Imaging, MRI, Deep Learning, Convolutional Neural Network, CNN
*Data used in preparation of this article were obtained from the Alzheimer’s Disease Neuroimaging Initiative (ADNI) database (ad-ni.loni.usc.edu). As such, the investigator within the ADNI contri-buted to the design and implementation of ADNI and/or provided data but did not participate in analysis or writing of this report. A complete listing of ADNI investigators can be found at: http://adni.loni.usc.edu/wp-content/uploads/how_to_apply/ADNI_Acknowledgement_List.pdf. How to cite this paper: Luo, S.H., Li, X.C.
and Li, J.M. (2017) Automatic Alzheimer’s Disease Recognition from MRI Data Using Deep Learning Method. Journal of Applied Mathematics and Physics, 5, 1892-1898. https://doi.org/10.4236/jamp.2017.59159
DOI: 10.4236/jamp.2017.59159 1893 Journal of Applied Mathematics and Physics
1. Introduction
Dementia describes a collection of symptoms that are caused by disorders af-fecting the brain. There are more than 46.8 million people worldwide with de-mentia today and 131.5 million predicted by 2050 [1]. There are many types of dementia, of which Alzheimer’s Disease (AD) is the most common form. Al-though considerable efforts have been made to unravel the pathophysiologic mechanisms of dementia and develop effective treatments, definitive diagnosis of dementia is mostly difficult. In searching for an effective way of diagnosing AD, some computer-aided systems have been investigated to diagnose AD. These systems are based on machine learning using clinical history information and neuropsychological data including magnetic resource imaging (MRI), structural MRI (sMRI), functional MRI (fMRI), and positron emission tomo-graphy (PET).
Deep learning (DL) simulates the hierarchical structure of human brain, processes data from lower levels to higher levels, and gradually composes more and more semantic concepts. As a new machine learning paradigm, deep learn-ing has been increaslearn-ingly explored in the development of technology for big data and artificial intelligence [2] [3] [4]. Some deep learning based algorithms have been proposed recently to recognise, or detect, AD. [5] presented a deep learning method consisted of sparse autoencoders and 3D convolutional neural networks. It can predict the disease status of a patient based on MRI scan. It achieved 95% accuracy when predicting between AD brains and healthy brains. [6] presented a multimodal neuroimaging feature extraction pipeline for multiclass AD diagno-sis. It developed a deep-learning framework using a zero-masking strategy to preserve all possible information encoded in imaging data. It achieved high ac-curacy of 87%. [7] outlined deep learning-based pipelines employed to distin-guish Alzheimer’s MRI and fMRI from normal healthy control data for a given age group. It almost perfectly distinguished Alzheimer’s patients from healthy normal brains. [8] proposed to predict the AD with a deep 3D convolutional neural network. The network was built upon a 3D convolutional autoencoder, which is pre-trained to capture anatomical shape variations in structural brain MRI scans. Experiments on the adopted MRI dataset with no skull-stripping preprocessing had shown that it outperformed several conventional classifiers by accuracy.
This paper introduces an automatic AD recognition algorithm that is based on deep learning on 3D brain MRI. In Section 2, we describe the algorithm in detail, including its major steps. In Section 3, we describe the results of the experiments of applying the proposed algorithm on real MRI data, and the related perform-ance discussion. Finally, in Section 4, we conclude by summarising the approach and pointing out possible future pursuits in the area.
2. Method
DOI: 10.4236/jamp.2017.59159 1894 Journal of Applied Mathematics and Physics system based on designing and training data. The test will give recognition result based on current input data. In particular, the recognition algorithm starts from using MRI data as input, pre-processes the data to increase recognition accuracy, then completes the recognition using convolutional neural networks. The fol-lowing subsections describe these steps.
2.1. Data Collecting and Pre-Processing
The proposed system is built and tested with the MRI data acquired from Alz-heimer’s Disease Neuroimaging Initiative (ADNI) database [9]. The primary goal of ADNI has been to test whether serial MRI, PET, other biological mark-ers, and clinical and neuropsychological assessment can be combined to measure the progression of mild cognitive impairment and early AD.
The data used include the MRI scans of about 47 AD patients and 34 normal controls (NC) from ADNI1. They are all from different subjects, making the recognition performance test more reliable. The scans are T1-weighted, acquired according to the ADNI acquisition protocol. They are 3D magnetization-pre- pared rapid gradient echo (MP-RAGE) sequence. The sequence was undergone a series of pre-processing including Gradwarp, B1 non-uniformity, N3, and scale.
Gradwarp is a system specific correction of image geometry distortion due to gradient non-linearity. B1 non-uniformity correction employs B1 calibration scans to correct the image intensity non-uniformity that results when RF trans-mission is performed with a more uniform body coil while reception is per-formed with a less uniform head coil. N3 is a histogram peak sharpening algo-rithm which is applied to all images. It is applied after grad warp and after B1 correction. N3 will reduce intensity non-uniformity due to the wave or the di-electric effect. In scaling, the image is scaled based on the spatial scale factors that are collected from a local phantom.
2.2. CNN Network Structure
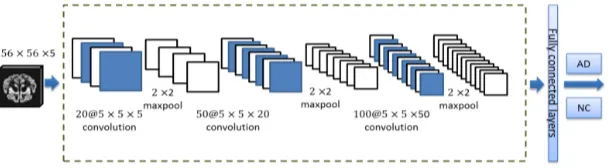
[image:3.595.223.529.625.709.2]The algorithm uses a convolutional neural network (CNN) to fulfil AD recogni-tion. The CNN architecture used in this study consists of three convolutional layers, of each is followed by normalization and spatial max-pooling [10]. The final layers of the network consist of fully connected layers and a classification layer. The network architecture was given in Figure 1. The size of filter was 5 × 5 in each convolutional layer. Max-pooling of size 2 × 2 was applied after the convolutional layers, halving the feature map sizes after the operations. Max-
DOI: 10.4236/jamp.2017.59159 1895 Journal of Applied Mathematics and Physics pooling reduces the number of free parameters and introduces small spatial in-variance in the network. The fully connected layers followed by a sigmoid logis-tic regression which outputs a score ranging between 0 and 1, indicating the probability of the slice to be AD. All network parameters are randomly initial-ized according to a normal distribution with variance 0.02. The network was trained using stochastic gradient descent with learning rate0.001. The cost func-tion was defined as follows:
( )
1(
)
(
)
C , B log log 1 log log 1
i i i i
i
l s = −
∑
=l s + −l −s(1) where
s
is the assigned pixel probability score, l is the reference pixel label and 𝐵𝐵is the size of mini-batch.2.3. CNN Network Training
2.3.1. Patch Extraction
The original MRI data had different sizes: 256 256 166× × and
192 192 160× × . To standardized the data, we reform all data into 56 56 56× × .
The MRI data consists of many slices. The starting and ending slices do not contain brain tissues. Therefore, we only extracted middle cross-section for AD detection [7]. The patch size we selected was 56 56 5× × , which means we
merged five neighboured slice as one patch. For each MRI data, seven sections centred at number 25 to 31 respectively were extracted as patches.
2.3.3. Data Augmentation
The MRI data do not have rotational invariance. Therefore, randomly rotation and mirror cannot be used for data augmentation. We generate additional training data using random zooming in and out and cropping. This is especially important as there are too few examples in the training set, and unbalanced number of AD and NC cases.
2.3.3. Training
We randomly selected 66% data for training and 33% for testing. Details were given in Table 1. Training is stopped when the accuracy on the validation data-set does not improve after three epochs. Both the training loss and validation loss started to drop after about 20 epochs and reached minimum and stable after about 40 epochs. The training loss reached zero and the validation loss con-verged at 0.02.
2.4. CNN Network Testing
When testing the proposed CNN, we also extracted seven middle cross-sections as patches. Since not all patches are abnormal in AD cases, only when all seven patches were classified as NC, we considered the data as NC. If one or more than one of the patches was/were classified as AD, we considered the data as AD.
2.5. Evaluation Metrics
DOI: 10.4236/jamp.2017.59159 1896 Journal of Applied Mathematics and Physics
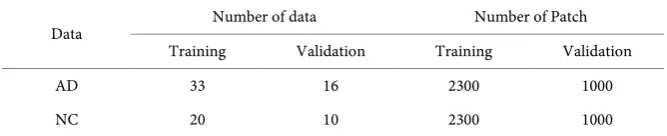
Table 1. Statistics on training and validation data.
Data Number of data Number of Patch Training Validation Training Validation
AD 33 16 2300 1000
NC 20 10 2300 1000
FP and FN represents true positive, true negative, false positive and false nega-tive respecnega-tively. Sensitivity is defined as
TP sensitivity
TP FN
= + Specificity is defined as
TN specificity
TN FP
= +
According to the definition, the sensitivity reflects how many AD cases were detected accurately. Higher the sensitivity, less AD cases were missing. The specificity reflects how many NC cases were detected accurately. Higher the specificity, less normal cases were misrecognized as AD. Using these two metrics together, the performance of the proposed method can be evaluated comprehen-sively.
3. Experimental Results
The AD recognition performance of the proposed method was tested on ADNI1 data. The testing data consist of 17 AD cases and 16 NC cases. 119 and 112 patches were extracted for AD and NC cases, respectively. 37 AD patches were classified as NC and 2 NC patches were classified as AD. The sensitivity at patch level is 0.69 and specificity is 0.98. When using the AD detection rule which were mentioned in testing section, the case level sensitivity is 1 and specificity is 0.93. The details were given in Table 2 and Table 3 respectively, where GT means ground truth.
4. Conclusions
DOI: 10.4236/jamp.2017.59159 1897 Journal of Applied Mathematics and Physics
Table 2. The experiment result at patch level.
Number of patches Number of patches Sensitivity Specificity
AD (GT) 82 37
0.69 0.98
NC (GT) 6 96
AD (CNN) NC (CNN)
Table 3. The experiment result at case level.
Number of patches Number of patches Sensitivity Specificity
AD (GT) 17 0
1 0.93
NC (GT) 3 13
AD (CNN) NC (CNN)
delivered a high AD recognition accuracy with a sensitivity of 1and a specificity of 0.93. Future study will include searching for more efficient data processing and CNN structure, and testing on more cases.
Acknowledgements
Data collection and sharing for this project was funded by the Alzheimer’s Dis-ease Neuroimaging Initiative (ADNI) (National Institutes of Health Grant U01 AG024904) and DOD ADNI (Department of Defense award number W81XWH-12-2-0012). ADNI is funded by the National Institute on Aging, the National Institute of Biomedical Imaging and Bioengineering, and through ge-nerous contributions from the following: AbbVie, Alzheimer’s Association; Alz-heimer’s Drug Discovery Foundation; Araclon Biotech; BioClinica, Inc.; Biogen; Bristol-Myers Squibb Company; CereSpir, Inc.; Cogstate; Eisai Inc.; Elan Phar-maceuticals, Inc.; Eli Lilly and Company; EuroImmun; F. Ho mann-La Roche Ltd and it’s a liated company Genentech, Inc.; Fujirebio; GE Healthcare; IXICO Ltd.; Janssen Alzheimer Immunotherapy Research & Development, LLC.; John-son & JohnJohn-son Pharmaceutical Research & Development LLC.; Lumosity; Lundbeck; Merck & Co., Inc.; Meso Scale Diagnostics, LLC.; NeuroRx Research; Neurotrack Technologies; Novartis Pharmaceuticals Corporation; Pfizer Inc.; Piramal Imaging; Servier; Takeda Pharmaceutical Company; and Transition Therapeutics. The Canadian Institutes of Health Research is providing funds to support ADNI clinical sites in Canada. Private sector contributions are facili-tated by the Foundation for the National Institutes of Health (www.fnih.org). The grantee organization is the Northern California Institute for Research and Education, and the study is coordinated by the Alzheimer's Therapeutic Re-search Institute at the University of Southern California. ADNI data are disse-minated by the Laboratory for Neuro Imaging at the University of Southern Cal-ifornia.
References
[image:6.595.204.540.187.249.2]DOI: 10.4236/jamp.2017.59159 1898 Journal of Applied Mathematics and Physics
[2] Arnold, L., Rebecchi, S., Chevallier, S. and Paugam-Moisy, H. (2011) An Introduc-tion to Deep Learning. ESANN 2011 Proceedings, European Symposium on Artifi-cial Neural Networks, Computational Intelligence and Machine Learning, Bruges, Belgium, 27-29 April 2011, 477-488.
[3] Najafabadi, M.M., Villanustre, F., Khoshgoftaar, T.M., Seliya, N., Wald, R. and Muharemagic, E. (2015) Deep Learning Applications and Challenges in Big Data Analytics. Journal of Big Data, 2, No.1. https://doi.org/10.1186/s40537-014-0007-7 [4] Liu, P., Su, S. and Chen, M. (2015) Deep Learning and Its Application to General
Image Classification. International Conference on Informative and Cybernetics for Computational Social Systems (ICCSS), 7-10.
[5] Payan, A. and Montana, G. (2015) Predicting Alzheimer’s Disease: A Neuroimaging Study with 3d Convolutional Neural Networks. arXiv preprint arXiv:1502.02506. [6] Liu, S., Liu, S., Cai, W., Che, H., Pujol, S., Kikinis, R., Feng, D. and Fulham, M.J.
(2015) Multimodal Neuroimaging Feature Learning for Multiclass Diagnosis of Alzheimer’s Disease. IEEE Transactions on Biomedical Engineering, 62, 1132-1140.
https://doi.org/10.1109/TBME.2014.2372011
[7] Sarraf, S., Anderson, J. and Tofighi, G. (2016) Deep AD: Alzheimer’s Disease Classi-fication via Deep Convolutional Neural Networks Using MRI and fMRI. bioRxiv, p. 070441.
[8] Hosseini, E., Asl, R.K. and El Baz, A. (2016) Alzheimer’s Disease Diagnostics by Adaptation of 3D Convolutional Network. IEEE International Conference on Image Processing (ICIP).
[9] The Alzheimer’s Disease Neuroimaging Initiative (ADNI).
http://www.adni-info.org/