Predicting Salient Updates for Disaster Summarization
Chris Kedzie and Kathleen McKeown Columbia University
Department of Computer Science
{kedzie, kathy}@cs.columbia.edu
Fernando Diaz Microsoft Research [email protected]
Abstract
During crises such as natural disasters or other human tragedies, information needs of both civilians and responders often re-quire urgent, specialized treatment. Moni-toring and summarizing a text stream dur-ing such an event remains a difficult prob-lem. We present a system for update sum-marization which predicts the salience of sentences with respect to an event and then uses these predictions to directly bias a clustering algorithm for sentence se-lection, increasing the quality of the up-dates. We use novel, disaster-specific features for salience prediction, including geo-locations and language models repre-senting the language of disaster. Our eval-uation on a standard set of retrospective events using ROUGE shows that salience prediction provides a significant improve-ment over other approaches.
1 Introduction
During crises, information is critical for first re-sponders, crisis management organizations, and those caught in the event. When the event is sig-nificant, as in the case of Hurricane Sandy, the amount of content produced by traditional news outlets, government agencies, relief organizations, and social media can vastly overwhelm those try-ing to monitor the situation. Crisis informatics (Palen et al., 2010) is dedicated to finding methods for sharing the right information in a timely fash-ion during such an event. Research in this field has focused on human-in-the-loop approaches rang-ing from on the ground information gatherrang-ing to crowdsourced reporting and disaster management (Starbird and Palen, 2013).
Multi-document summarization has the poten-tial to assist the crisis informatics community. Au-tomatic summarization could deliver relevant and
salient information at regular intervals, even when human volunteers are unable to. Perhaps more im-portantly it could help filter out unnecessary and irrelevant detail when the volume of incoming in-formation is large. While methods for identifying, tracking, and summarizing events from text based input have been explored extensively (Allan et al., 1998; Filatova and Hatzivassiloglou, 2004; Wang et al., 2011), these experiments were not devel-oped to handle streaming data from a heteroge-neous environment at web scale. These methods also rely heavily on redundancy which is subop-timal for time sensitive domains where there is a high cost in delaying information.
In this paper, we present an update summariza-tion system to track events across time. Our sys-tem predicts sentence salience in the context of a large-scale event, such as a disaster, and integrates these predictions into a clustering based multi-document summarization system. We demonstrate that combining salience with clustering produces more relevant summaries compared to baselines using clustering or relevance alone. Our experi-ments suggest that this is because our system is better able to adapt to dynamic changes in input volume that adversely affect methods that use re-dundancy as a proxy for salience.
In addition to the tight integration between clus-tering and salience prediction, our approach also exploits knowledge about the event to determine salience. Thus, salience represents both how typi-cal a sentence is of the event type (e.g., industrial accident, hurricane, riot) and whether it specifies information about this particular event. Our fea-ture representation includes a set of language mod-els, one for each event type, to measure the typi-cality of the sentence with regard to the current event, the distance of mentioned locations from the center of the event, and the change in word frequencies over the time of the event. While we evaluate these features in the domain of disasters,
this approach is generally applicable to many up-date summarization tasks.
Our approach achieves a statistically significant improvement in ROUGE scores compared to mul-tiple baselines. Additionally, we introduce novel methods for estimating the average information gain each update provides and how completely the update summary covers the event it is tracking; our system’s updates contain more relevant informa-tion on average than the competing baselines.
The remainder of the paper is organized as fol-lows. We begin with a review of related work in the information retrieval and multi-document summarization literature. Section 3 outlines the details of our salience and summarization models. Next we describe our data (Section 4) and experi-ments (Section 5). Finally, we discuss our results (Section 6) and conclude the paper.
2 Related Work
A principal concern in extractive multi-document summarization is the selection of salient sentences for inclusion in summary output (Nenkova and McKeown, 2012). Existing approaches generally fall into one of three categories, each with specific trade-offs with respect to update summarization.
First, centrality-focused approaches (including graph (Erkan and Radev, 2004), cluster (Hatzivas-siloglou et al., 2001), and centroid (Radev et al., 2004) methods) are very natural for retrospective analysis in the sense that they let the data “speak for itself.” These methods equate salience with centrality, either to the input or some other ag-gregate object (i.e. a cluster center or input cen-troid). However, they rely chiefly on redundancy. When applied to an unfolding event, there may not exist enough redundant content at the event onset for these methods to exploit. Once the event onset has passed, however, the redundancy reduction of these methods is quite beneficial.
The second category, predictive approaches, in-cludes ranking and classification based methods. Sentences have been ranked by the average word probability, average TF*IDF score, and the num-ber of topically related words (topic-signatures in the summarization literature) (Nenkova and Van-derwende, 2005; Hovy and Lin, 1998; Lin and Hovy, 2000). The first two statistics are easily computable from the input sentences, while the third only requires an additional, generic back-ground corpus. In classification based methods,
model features are usually derived from human generated summaries, and are non-lexical in na-ture (e.g., sentence starting position, number of topic-signatures, number of unique words). Sem-inal work in this area has employed na¨ıve Bayes and logistic regression classifiers to identify sen-tences for summary inclusion (Kupiec et al., 1995; Conroy et al., 2001). While these methods are less dependent on redundancy, the expressiveness of their features is limited. Our model expands on these basic features to account for geographic, temporal, and language model features.
The last category includes probabilistic (Haghighi and Vanderwende, 2009), information theoretic, and set cover (Lin and Bilmes, 2011) approaches. While these methods are focused on producing diverse summaries, they are difficult to adapt to the streaming setting, where we do not necessarily have a fixed summary length and the corpus to be summarized contains many irrelevant sentences, i.e. there are large portions of the corpora that we specifically want to avoid.
Several researchers have recognized the impor-tance of summarization during natural disasters. (Guo et al., 2013) developed a system for detect-ing novel, relevant, and comprehensive sentences immediately after a natural disaster. (Wang and Li, 2010) present a clustering-based approach to efficiently detect important updates during natural disasters. The algorithm works by hierarchically clustering sentences online, allowing the system to output a more expressive narrative structure than (Guo et al., 2013). Our system attempts to unify these system’s approaches (predictive ranking and clustering respectively).
3 Method
Our update summarization system takes as input
a) a short query defining the event to be tracked (e.g. ‘Hurricane Sandy’), b) an event category defining the type of event to be tracked (e.g. ‘hur-ricane’), c) a stream of time-stamped documents presented in temporal order, andd) an evaluation time period of interest. While processing docu-ments throughout the time period of interest, the system outputs sentences from these documents likely to be useful to the query issuer. We refer to these selected sentences asupdates.
– hurricane force wind warnings are in effect from Rhode Island Sound to Chincoteague Bay
– over 5000 commercial airline flights sched-uled for October 28 and October 29 were cancelled
Figure 1: Example nuggets from Hurricane Sandy.
an event. Events are often composed of a vari-ety of sub-events. For example, the Hurricane Sandy event includes sub-events related to the storm making landfall, the ensuing flooding, the many transportation issues, among many others. An ideal system would update the user about each of these sub-events as they occur. We refer to these sub-events as thenuggetsassociated with an event. A nugget is defined as a fine-grained atomic sub-event associated with an event. We present 2 example nuggets associated with the Hurricane Sandy event in Figure 1. Each event has anywhere from 50 to several hundred nuggets in total in our gold dataset. We describe how these nuggets are found in Section 4.
Throughout our treatment of our algorithm, the
salienceof an update captures the degree to which it reflects an event’s unobserved nuggets. Assum-ing that we have a text representation for each of our nuggets, the salience of an updateu with re-spect to a set of nuggetsN is defined as,
salience(u) = maxn∈Nsim(u, n) (1)
wheresim(·)is the semantic similarity such as the cosine similarity of latent vectors associated with the update and nugget text (Guo and Diab, 2012).
3.1 Update Summarization
Our system architecture follows a simple pipeline design where each stage provides an additional level of processing or filtering of the input sen-tences. We begin with an empty update summary U. At each hour we receive a new batch of sen-tencesbt from the stream of event relevant
docu-ments and perform the following actions:
1. predict the salience of sentences in bt
(Sec-tion 3.2),
2. select a set of exemplar sentences in bt by
combining clustering with salience predic-tions (Section 3.3),
3. add the most novel and salient exemplars to U (Section 3.4).
The resultant list of updatesU is our summary of the event.
3.2 Salience Prediction 3.2.1 Features
We want our model to be predictive of sen-tence salience across different event instances so we avoid event-specific lexical features. In-stead, we extract features such as language model scores, geographic relevance, and temporal rele-vance from each sentence.
Basic Features We employ several basic
fea-tures that have been used previously in supervised models to rank sentence salience (Kupiec et al., 1995; Conroy et al., 2001). These include sen-tence length, the number of capitalized words nor-malized by sentence length, document position, and number of named entities. The data stream comprises text extracted from raw html docu-ments; these features help to downweight sen-tences that are not content (e.g. web page titles, links to other content) or more heavily weight im-portant sentences (e.g., that appear in prominent positions such as paragraph initial or article ini-tial).
Query Features Query features measure the
relationship between the sentence and the event query and type. These include the number of query words present in the sentence in addition to the number of event type synonyms, hypernyms, and hyponyms using WordNet (Miller, 1995). For example, for event typeearthquake, we match sen-tence terms “quake”, “temblor”, “seism”, and “af-tershock”.
Language Model Features Language models
allow us to measure the likelihood of producing a sentence from a particular source. We consider two types of language model features. The first model is estimated from a corpus of generic news articles (we used the 1995-2010 Associated Press section of the Gigaword corpus (Graff and Cieri, 2003)). This model is intended to assess the gen-eral writing quality (grammaticality, word usage) of an input sentence and helps our model to select sentences written in the newswire style.
Storm Earthquake Meteor Impact
Accident Riot Protest
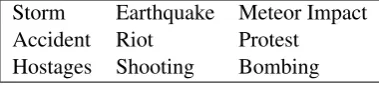
[image:4.595.86.276.63.106.2]Hostages Shooting Bombing Figure 2: TREC TS event types.
Wikipedia category. For example, the language model for event type ‘earthquake’ is estimated from Wikipedia pages under the category Cate-gory:Earthquakes. Fig. 2 lists the event types found in our dataset. These models are intended to detect sentences similar to those appearing in summaries of other events in the same category (e.g. most earthquake summaries are likely to in-clude higher probability for ngrams including the token ‘magnitude’). While we focus our system on the language of news and disaster, we emphasize that the use of language modeling can be an effec-tive feature for multi-document summarization for other domains that have related text corpora.
We use the SRILM toolkit (Stolcke and others, 2002) to implement a 5-gram Kneser-Ney model for both the background language model and the event specific language models. For each sentence we use the average token log probability under each model as a feature.
Geographic Relevance FeaturesThe disasters
in our corpus are all phenomena that affect some part of the world. Where possible, we would like to capture a sentence’s proximity to the event, i.e. when a sentence references a location, it should be close to the area of the disaster.
There are two challenges to using geographic features. First, we do not know where the event is, and second, most sentences do not contain refer-ences to a location. We address the first issue by extracting all locations from documents relevant to the event at the current hour and looking up their latitude and longitude using a publicly available geo-location service. Since the documents that are at least somewhat relevant to the event, we assume in aggregate the locations should give us a rough area of interest. The locations are clustered and we treat the resulting cluster centers as the event locations for the current time.
The second issue arises from the fact that the majority of sentences in our data do not contain explicit references to locations, i.e. a sequence of tokens tagged as location named entities. Our in-tuition is that geographic relevance is important in the disaster domain, and we would like to take
ad-vantage of the sentences that do have location in-formation present. To make up for this imbalance, we instead compute an overall location for the document and derive geographic features based on the document’s proximity to the event in question. These features are assigned to all sentences in the document.
Our method of computing document-level ge-ographic relevance features is as follows. Using the locations in each document, we compute the median distance to the nearest event location. Be-cause document position is a good indicator of im-portance we also compute the distance of the first mentioned location to the nearest event location. All sentences in the document take as features these two distance calculations. Because some events can move, we also compute these distances to event locations from the previous hour.
Temporal Relevance Features As we track
events over time, it is likely that the coverage of the event may die down, only to spike back up when there is a breaking development. Identify-ing terms that are “bursty,” i.e. suddenly peakIdentify-ing in usage, can help to locate novel sentences that are part of the most recent reportage and have yet to fall into the background.
We compute the IDF for each hour in our data stream. For each sentence, the average TF*IDF for the current hourtis taken as a feature. Addi-tionally, we use the difference in average TF*IDF from timettot−ifori = {1, . . . ,24} to mea-sure how the TF*IDF scores for the sentence have changed over the last 24 hours, i.e. we keep the sentence term frequencies fixed and compute the difference in IDF. Large changes in IDF value in-dicate the sentence contains bursty terms. We also use the time (in hours) since the event started as a feature.
3.2.2 Model
Given our feature representation of the input sen-tences, we need only target salience values for model learning. For each event in our training data, we sample a set of sentences and each sen-tence’s salience is computed according to Equa-tion 1. This results in a training set of sen-tences, their feature representations, and their tar-get salience values to predict.
into five groups and we use a separate RBF kernel for each, using the sum of each feature group RBF kernel as the final input to the GP model.
3.3 Exemplar Selection
Once we have predicted the salience for a batch of sentences, we must now select a set of update candidates, i.e. sentences that are both salient and representative of the current batch. To accomplish this, we combine the output of our salience pre-diction model with the affinity propagation algo-rithm. Affinity propagation (AP) is a clustering algorithm that identifies a subset of data points as exemplars and forms clusters by assigning the re-maining points to one of the exemplars (Frey and Dueck, 2007). AP attempts to maximize the net similarity objective
S =
n
X
i:i6=ei
sim(i, ei) + n
X
i:i=ei
salience(ei)
whereeiis the exemplar of thei-th data point, and
functions sim and salience express the pairwise similarity of data points and our predicted apri-ori preference of a data point to be an exemplar respectively. AP differs from otherk-centers algo-rithms in that it simultaneously considers all data points as exemplars, making it less prone to find-ing local optima as a result of poor initialization. Furthermore, the second term in S incorporates the individual importance of data points as candi-date exemplars; most other clustering algorithms only make use of the first term, i.e. the pairwise similarities between data points.
AP has several useful properties and interpre-tations. Chiefly, the number of clusters k is not a model hyper-parameter. Given that our task re-quires clustering many batches of streaming data, searching for an optimalkwould be computation-ally prohibitive. With AP,kis determined by the similarities and preferences of the data. Generally lower preferences will result in fewer clusters.
Recall that salience(s) is a prediction of the semantic similarity ofsto information about the event be summarized, i.e. the set of event nuggets. Intuitively, when maximizing objective function
S, AP must balance between best representing the input data and representing the most salient in-put. Additionally, when the level of input is high but the salience predictions are low, the preference term will guide AP toward a solution with fewer clusters;vice-versa when input is very salient on
average but the volume of input is low. The adap-tive nature of our model differentiates our method from most other update summarization systems.
3.4 Update Selection
The exemplar sentences from the exemplar selec-tion stage are the most salient and representative of the input for the current hour. However, we need to reconcile these sentences with updates from the previous hour to ensure that the most salient and least redundant updates are selected. To ensure that only the most salient updates are selected we apply a minimum salience threshold; after exem-plar sentences have been identified, any exemexem-plars whose salience is less thanλsalare removed from
consideration.
Next, to prevent adding updates that are redun-dant with previous output updates, we filter out ex-emplars that are too similar to previous updates. The exemplars are examined sequentially in order of decreasing salience and a similarity threshold is applied, where the exemplar is ignored if its max-imum semantic similarity to any previous updates in the summary is greater thanλsim.
Exemplars that pass these thresholds are se-lected as updates and added to the summary.
4 Data
For the document stream, we use the news portion of the 2014 TREC KBA Stream Corpus (Frank et al., 2012). The documents from this corpus come from hourly crawls of the web covering October 2011 through February 2013.
Our experiments also make use of the TREC Temporal Summarization (TS) Track data from 2013 and 2014 (Aslam et al., 2013). This data in-cludes 25 events and event metadata (e.g., a user search query for the event, the event type, and event evaluation time frame). All events occurred during the time span of the TREC KBA Stream Corpus. For each event we create a stream of rel-evant documents by selecting only documents that contain the complete set of query words.
revision history for the Wikipedia page for ‘Hurri-cane Sandy’ will contain text additions including those related to individual nuggets. The assess-ment task involves reviewing the Wikipedia revi-sions in the evaluation time frame and marking the text additions capturing a new, unique nugget. More detail on this process can be found in the track description (Aslam et al., 2013).
5 Experiments
We evaluate our system on two metrics: ROUGE (Lin, 2004), an automatic summarization method and an evaluation of system expected gain and comprehensiveness—metrics adapted from the TREC TS track (Aslam et al., 2013).
5.1 Training and Testing
Of the 25 events in the TREC TS data, 24 are covered by the news portion of the TREC KBA Stream Corpus. From these 24, we set aside three events to use as a development set. All system salience and similarity threshold parame-ters are tuned on the development set to maximize ROUGE-2 F1 scores.
We train a salience model for each event us-ing 1000 sentences randomly sampled from the event’s document stream.
We perform a leave-one-out evaluation of each event. At test time, we predict a sentence’s salience using the average predictions of the 23 other models.
5.2 ROUGE Evaluation
ROUGE measures the ngram overlap between a model summary and an automatically gener-ated system summary. Model summaries for each event were constructed by concatenating the event’s nuggets. Generally, ROUGE evaluation assumes both model and system summaries are of a bounded length. Since our systems are summa-rizing events over a span of two weeks time, the total length of our system output is much longer than the model. To address this, for each sys-tem/event pair, we sample with replacement 1000 random summaries of length less than or equal to the model summary (truncating the last sentence when neccessary). The final ROUGE scores for the system are the average scores from these 1000 samples.
Because we are interested in system perfor-mance over time, we also evaluate systems at 12
hour intervals using the same regime as above. The model summaries in this case are retrospec-tive, and this evaluation reveals how quickly sys-tems can cover information in the model.
5.3 Expected Gain and Comprehensiveness
NIST developed metrics for evaluating update summarization systems as part of the TREC TS track. We present results on two of these metrics, the expected gain and comprehensiveness.
Expected Gain We treat the event’s nuggets as
unique units of information. When a system adds an update to its summary, it is potentially adding some of this nugget information. It would be structive to know how much unique and novel in-formation each update is adding on average to the summary. To that end, we define
E[Gain] = |Sn|
|S|
whereSis the set of system updates,Snis the set
of nuggets contained inS, and| · | is the number of elements in the set. To compute the setSnwe
match each system update to 0 or more nuggets, where an update matches a nugget if their seman-tic similarity is above a threshold.Snresults from
the unique set of nuggets matched. Because an update can map to more than one nugget, it is pos-sible to receive an expected gain greater than 1. An expected gain of 1 would indicate that every sentence was both relevant and contained a unique piece of information.
Comprehensiveness Additionally, we can use
the nuggets to measure the completeness of an up-date summary. We define
Comprehensiveness = ||SNn||
whereN is the set of event nuggets. A compre-hensiveness of 1 indicates that the summary has covered all nugget information for the event; the maximum attainable comprehensiveness is 1.
manual matches performed by NIST assessors was much lower at approximately .25, increasing our confidence in the automatic matches in the .5–1 range.
5.4 Model Comparisons
We refer to our complete model as AP+SALIENCE. We compare this model against several variants and baselines intended to measure the contribution of different components. All thresholds for all runs are tuned on the development set.
Affinity Propagation only (AP) The purpose
of this model is to directly measure the effect of integrating salience and clustering by providing a baseline that uses the identical clustering compo-nent, but without the salience information. In this model, input sentences areapriori equally likely to be exemplars; the salience values are uniformly set as the median value of the input similarity scores, as is commonly used in the AP literature (Frey and Dueck, 2007). After clustering a sen-tence batch, the exemplars are examined in order of increasing time since event start and selected as updates if their maximum similarity to the pre-vious updates is less thanλsim, as in the novelty
filtering stage of AP+SALIENCE.
Hierarchichal Agglomerative Clustering
(HAC) We provide another clustering baseline,
single-linkage hierarchichal agglomerative clus-tering. We include this baseline to show that AP+SALIENCE is not just an improvement over AP but centrality driven methods in general. HAC was chosen over other clustering ap-proaches because the number of clusters is not an explicit hyper-parameter. To produce flat clusters from the hierarchical clustering, we flatten the HAC dendrogram using the cophenetic distance criteria, i.e. observations in each flat cluster have no greater a cophenetic distance than a threshold. Cluster centers are determined to be the sentence with highest cosine similariy to the flat cluster mean. Cluster centers are examined in time order and are added to the summary if their similarity to previous updates is below a similarity threshold λsimas is done in the AP model.
Rank by Salience (RS)We also isolate the
im-pact of our salience model in order to demonstrate that the fusion of clustering and salience predic-tion improves over predicting salience alone. In this model we predict the salience of sentences as in step 1 for AP+SALIENCE. We omit the
cluster-ing phase (step 2). Updates are selected identically to step 3 of AP+SALIENCE, proceeding in order of decreasing salience, selecting updates that are above a salience thresholdλsal and below a
simi-larity thresholdλsimwith respect to the previously
selected updates. 6 Results
6.1 ROUGE
ROUGE-1
System Recall Prec. F1 AP+SALIENCE 0.282 0.344 0.306
AP 0.245 0.285 0.263
RS 0.230 0.271 0.247
HAC 0.169 0.230 0.186
ROUGE-2
System Recall Prec. F1 AP+SALIENCE 0.045 0.056 0.049
AP 0.033 0.038 0.035
RS 0.031 0.037 0.034
HAC 0.017 0.024 0.019
Table 1: System ROUGE performance. Table 1 shows our results for system output samples against the full summary of nuggets us-ing ROUGE. This improvement is statistically sig-nificant for all ngram precision, recall, and F-measures at theα=.01level using the Wilcoxon signed-rank test.
AP+SALIENCE maintains its performance above the baselines over time as well. Fig-ure 3 shows the ROUGE-1 scores over time. We show the difference in unigram precision (bigram precision is not shown but it follows similar curve). Within the initial days of the event, AP+SALIENCE is able to take the lead over the over systems in ngram precision. The AP+SALIENCEmodel is better able to find salient updates earlier on; for the disaster domain, this is an especially important quality of the model.
Moreover, the AP+SALIENCE’s recall is not di-minished by the high precision and remains com-petitive with AP. Over time AP+SALIENCE’s re-call also begins to pull away, while the other mod-els start to suffer from topic drift.
6.2 Expected Gain and Comprehensiveness
2 4 6 8 10 0.0
0.1 0.2 0.3 0.4
Pr
ec
.
AP+Salience AP HAC RS
2 4 6 8 10
days since event start 0.0
0.1 0.2 0.3 0.4
R
ec
al
[image:8.595.74.274.77.281.2]l
Figure 3: System ROUGE-1 performance over time.
to 1 are more conservative estimates. The ranking of the systems remains constant across the sweep with AP+SALIENCEbeating all baseline systems. Predicting salience in general is helpful for keep-ing a summary on topic as the RS approach out performs the clustering only approaches on ex-pected gain.
When looking at the comprehensiveness of the summaries AP outperforms AP+SALIENCE. The compromise encoded in the AP+SALIENCE ob-jective function, between being representative and being salient, is seen clearly here where the per-formance of the AP+SALIENCEmethods is lower bounded by the salience focused RS system and upper bounded by the clustering only AP system. Overall, AP+SALIENCEachieves the best balance of these two metrics.
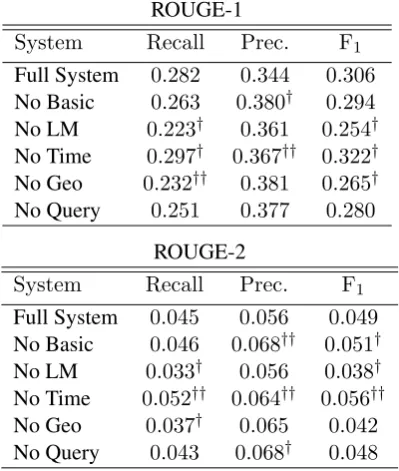
6.3 Feature Ablation
Table 2 shows the results of our feature ablation tests. Removing the language models yields a statistically significant drop in both ngram recall and F-measure. Interestingly, removing the ba-sic features leads to an increase in both unigram and bigram precision; in the bigram case this is enough to cause a statistically significant increase in F-measure over the full model. In other words, the generic features actually lead to an inferior model when we can incorporate more appropri-ate domain specific features. The result mirrors Sparck Jones’ claim that generic approaches to
0.5 0.6 0.7 0.8 0.9 1.0
0.00 0.02 0.04 0.06 0.08 0.10 0.12
F-mea
su
re
0.5 0.6 0.7 0.8 0.9 1.0
0.00 0.02 0.04 0.06 0.08 0.10 0.12
Ex
p
ec
te
d
Ga
in
0.5 0.6 0.7 0.8 0.9 1.0
Similarity Threshold
0.0 0.1 0.2 0.3 0.4 0.5 0.6
Co
mp
.
[image:8.595.307.510.89.381.2]AP+Salience AP HAC RS
Figure 4: Expected Gain and Comprehensiveness performance.
summarization cannot produce a useful summary (Sparck-Jones, 1998).
Removing the language model and geographic relevance features leads to a statistically signifi-cant drop in ROUGE-1 F1 scores. Unfortunately, this is not the case for the temporal relevance features. We surmise that these features are too strongly correlated with each other, i.e. the differ-ences in TF*IDF between hours are definitely not i.i.d. variables.
7 Conclusion
In this paper, we have presented an update sum-marization system for the disaster domain, and demonstrated improved system performance by integrating sentence salience with clustering.
We also have shown that features specifically targeted to the domain of disaster yield better sum-maries. We developed novel features that capture the language typical of different event types and that identify sentences specific to the particular disaster based on location.
appli-2012 Pakistan Garment Factory Fires
• The fire broke out when people in the building were trying to start their generator after the electricity went out. • Pakistani television showed pictures of what appeared to be a three-story building with flames leaping from the top-floorwindows and smoke billowing into the night sky. • The people went to the back side of the building but there was no access, so we had to made forceful entries and rescuethe people, said Numan Noor, a firefighter on the scene.
• “We have recovered 63 bodies, including three found when we reached the basement of the building,” Karachi fire chiefEhtesham Salim told AFP on Wednesday.
2012 Romanian Protests
• Clashes between riot police and demonstrators have also erupted in the Romanian capital Bucharest for a third day in arow. • BOC urged Romanians to understand that tough austerity measures are needed to avoid a default.
• More than 1,000 protesters rallied in Bucharest’s main university square, blocking traffic.
[image:9.595.81.281.312.548.2]• Bucharest : a Romanian medical official says 59 people suffered injuries as days of protests against the government andausterity measures turned violent.
Figure 5: AP+SALIENCEsummary excerpts.
ROUGE-1
System Recall Prec. F1 Full System 0.282 0.344 0.306 No Basic 0.263 0.380† 0.294 No LM 0.223† 0.361 0.254† No Time 0.297† 0.367†† 0.322† No Geo 0.232†† 0.381 0.265† No Query 0.251 0.377 0.280
ROUGE-2
System Recall Prec. F1 Full System 0.045 0.056 0.049 No Basic 0.046 0.068†† 0.051† No LM 0.033† 0.056 0.038† No Time 0.052†† 0.064†† 0.056†† No Geo 0.037† 0.065 0.042 No Query 0.043 0.068† 0.048 Table 2: Feature ablation ROUGE performance.
†indicates statistically significant difference from full model at theα = .05 level. ††indicates sta-tistically significant difference from full model at theα=.01level.
cation of the AP+SALIENCE model and features to a wider class of events.
8 Acknowledgments
The research described here was supported in part by the National Science Foundation (NSF) under IIS-1422863. Any opinions, findings and conclu-sions or recommendations expressed in this paper are those of the authors and do not necessarily
re-flect the views of the NSF.
References
James Allan, Jaime G Carbonell, George Doddington, Jonathan Yamron, and Yiming Yang. 1998. Topic detection and tracking pilot study final report.
Javed Aslam, Matthew Ekstrand-Abueg, Virgil Pavlu, Fernado Diaz, and Tetsuya Sakai. 2013. Trec
2013 temporal summarization. In Proceedings of
the 22nd Text Retrieval Conference (TREC), Novem-ber.
James M Conroy, Judith D Schlesinger, PO Dianne, Mary E Okurowski, et al. 2001. Using hmm and logistic regression to generate extract summaries for duc.
G¨unes Erkan and Dragomir R Radev. 2004.
Lexrank: Graph-based lexical centrality as salience in text summarization. J. Artif. Intell. Res.(JAIR), 22(1):457–479.
Elena Filatova and Vasileios Hatzivassiloglou. 2004.
Event-based extractive summarization. In ACL
Workshop on Summarization, Barcelona, Spain.
John R Frank, Max Kleiman-Weiner, Daniel A Roberts, Feng Niu, Ce Zhang, Christopher R´e, and Ian Soboroff. 2012. Building an entity-centric stream filtering test collection for trec 2012. Tech-nical report, DTIC Document.
Brendan J Frey and Delbert Dueck. 2007. Clustering
by passing messages between data points. science,
315(5814):972–976.
Weiwei Guo and Mona Diab. 2012. A simple unsuper-vised latent semantics based approach for sentence
similarity. In Proceedings of the First Joint
Con-ference on Lexical and Computational Semantics-Volume 1: Proceedings of the main conference and the shared task, and Volume 2: Proceedings of the Sixth International Workshop on Semantic Evalua-tion, pages 586–590. Association for Computational Linguistics.
Qi Guo, Fernando Diaz, and Elad Yom-Tov. 2013. Updating users about time critical events. In Pavel Serdyukov, Pavel Braslavski, SergeiO. Kuznetsov, Jaap Kamps, Stefan R¨uger, Eugene Agichtein, Ilya
Segalovich, and Emine Yilmaz, editors, Advances
in Information Retrieval, volume 7814 of Lec-ture Notes in Computer Science, pages 483–494. Springer Berlin Heidelberg.
Aria Haghighi and Lucy Vanderwende. 2009. Ex-ploring content models for multi-document
summa-rization. InProceedings of Human Language
Tech-nologies: The 2009 Annual Conference of the North American Chapter of the Association for Computa-tional Linguistics, pages 362–370. Association for Computational Linguistics.
Vasileios Hatzivassiloglou, Judith L Klavans,
Melissa L Holcombe, Regina Barzilay, Min-Yen Kan, and Kathleen McKeown. 2001. Simfinder: A flexible clustering tool for summarization. Pro-ceedings of the NAACL Workshop on Automatic Summarizatio.
Eduard Hovy and Chin-Yew Lin. 1998. Automated text summarization and the summarist system. In
Proceedings of a workshop on held at Baltimore, Maryland: October 13-15, 1998, pages 197–214. Association for Computational Linguistics.
Julian Kupiec, Jan Pedersen, and Francine Chen. 1995.
A trainable document summarizer. InProceedings
of the 18th annual international ACM SIGIR confer-ence on Research and development in information retrieval, pages 68–73. ACM.
Hui Lin and Jeff Bilmes. 2011. A class of
submodu-lar functions for document summarization. In
Pro-ceedings of the 49th Annual Meeting of the Associ-ation for ComputAssoci-ational Linguistics: Human Lan-guage Technologies-Volume 1, pages 510–520. As-sociation for Computational Linguistics.
Chin-Yew Lin and Eduard Hovy. 2000. The automated acquisition of topic signatures for text summariza-tion. InProceedings of the 18th conference on Com-putational linguistics-Volume 1, pages 495–501. As-sociation for Computational Linguistics.
Chin-Yew Lin. 2004. Rouge: A package for automatic
evaluation of summaries. In Text Summarization
Branches Out: Proceedings of the ACL-04 Work-shop, pages 74–81.
George A Miller. 1995. Wordnet: a lexical
database for english. Communications of the ACM,
38(11):39–41.
Ani Nenkova and Kathleen McKeown. 2012. A survey
of text summarization techniques. In Mining Text
Data, pages 43–76. Springer.
Ani Nenkova and Lucy Vanderwende. 2005. The
im-pact of frequency on summarization. Microsoft
Re-search, Redmond, Washington, Tech. Rep. MSR-TR-2005-101.
Leysia Palen, Kenneth M Anderson, Gloria Mark, James Martin, Douglas Sicker, Martha Palmer, and Dirk Grunwald. 2010. A vision for technology-mediated support for public participation & assis-tance in mass emergencies & disasters. In Proceed-ings of the 2010 ACM-BCS visions of computer sci-ence confersci-ence, page 8. British Computer Society. Dragomir R Radev, Hongyan Jing, Małgorzata Sty´s,
and Daniel Tam. 2004. Centroid-based
summariza-tion of multiple documents. Information Processing
& Management, 40(6):919–938.
Carl Edward Rasmussen and Christopher K. I.
Williams. 2006. Gaussian Processes for Machine
Learning. The MIT Press.
Karen Sparck-Jones. 1998. Automatic summarizing: factors and directions. InAdvances in automatic text summarization, eds. Mani and Maybury.
Kate Starbird and Leysia Palen. 2013. Working and sustaining the virtual disaster desk. InProceedings of the 2013 conference on Computer supported co-operative work, pages 491–502. ACM.
Andreas Stolcke et al. 2002. Srilm-an extensible
lan-guage modeling toolkit. InINTERSPEECH.
Dingding Wang and Tao Li. 2010. Document up-date summarization using incremental hierarchical
clustering. In Proceedings of the 19th ACM
inter-national conference on Information and knowledge management, CIKM ’10, pages 279–288, New York, NY, USA. ACM.