Frequency of testing. Lessons from a
field experiment in higher education.
Cid, Alejandro and Cabrera, José María and Bernatzky,
Marianne
UM Center of Applied Research in Economics, at Universidad de
Montevideo, Yale University
2017
Online at
https://mpra.ub.uni-muenchen.de/84616/
1
FACULTAD DE CIENCIAS EMPRESARIALES Y ECONOMIA
Serie de documentos de trabajo del Departamento de Economía /
Department of Economics Working Papers Series
Frequency of testing. Lessons from a field experiment in higher
education.
Marianne Bernatzky
Yale University & UM Center of Applied Research in Economics, at Universidad de
Montevideo
José María Cabrera
UM Center of Applied Research in Economics, at Universidad de Montevideo
Alejandro Cid
UM Center of Applied Research in Economics, at Universidad de Montevideo
The working papers of the Department of Economics, Universidad de Montevideo are
circulated for discussion and comment purposes. They have not been peer reviewed nor
2
Frequency of testing. Lessons from a field experiment in higher
education.
Marianne Bernatzky
Yale University & UM Center of Applied Research in Economics, at Universidad de
Montevideo
José María Cabrera
UM Center of Applied Research in Economics, at Universidad de Montevideo
Alejandro Cid
UM Center of Applied Research in Economics, at Universidad de Montevideo
Abstract
Purpose
The purpose of this study is to investigate the effect of frequent testing on the performance of undergraduate freshmen.
Methodology
The impact evaluation of the intervention is designed as a field experiment -a
randomized control trial. First, instructor divided the class in groups of three students in a joint-liability framework, a setting that fosters peer monitoring among students.
Then, the groups were randomly assigned to high-frequency testing (tests on a weekly schedule) or a low-frequency testing (tests on a biweekly schedule). Each testing
condition lasted for 15 weeks, and data on academic achievement were collected both before and after the intervention.
Findings
Although high-frequency groups show a higher mean performance on academic results,
3 biweekly testing. We related our findings with recent discoveries on students’ perception of frequent assessments and its relation to motivation.
Originality
A large body of educational literature investigates the effect of the frequency of testing
on learning performance. Less attention has been devoted to explore the mechanisms behind that relationship. We contribute to this emerging literature analyzing the effect
of test frequency on a sample of Uruguayan university students, in a novel setting (a joint-liability framework), exploring mechanisms and suggesting lessons for future
research.
Keywords: frequent assessment; intrinsic motivation; grades; perceptions; classroom field experiment; feedback; procrastination
_____________________________
4
Introduction
Is it better to test students more or less frequently? From the perspective of
instructors, frequent testing in their courses implies additional work, but maybe it will not be reflected in student learning. Moreover, administering frequent evaluations
consumes valuable instruction time that could be employed in teaching rather than testing. In addition, students may study less when given more exams because the overall
weight of each exam on the overall class grade is lower. We carry out a field experiment to assess the effect of frequent examinations on the academic performance of university
students. We perform this impact evaluation in a novel setting, a joint-liability framework,
where students are jointly responsible for their homework. We contribute also discussing mechanisms behind our findings and relating them with recent educational and psychological approaches.
A large body of educational literature investigates the effect of the frequency of
testing on learning performance (Bangert-Drowns, Kulik, & Kulik, 1991; Kika, McLaughlin, & Dixon, 1992; Murphy & Stanga, 1994; Black & Wiliam, 1998; Domenech
et al., 2015; Schrank, 2016; Adesope, Trevisan, & Sundararajan, 2017; Adkins & Linville 2017). This literature finds mixed results. Less attention has been devoted to explore the
mechanisms behind the relationship between test frequency and performance, though this link may be key to understand the mixed results.
Previous literature has presented these mechanisms under two main channels. In the first place, students who procrastinate their effort may end up studying more when
5 choose costly deadlines as a commitment device to improve their academic performance. In second place, frequent examinations offer students quick feedback of their results,
that is, a tangible way to measure their progress during a class and to become aware of their strong and weak areas. These two mechanisms could foster students’ academic
performance. In a similar vein, Bandiera, Larcinese, and Rasul (2015), Cabrera and Cid (2017), and Azmat and Iriberri (2010) focus on the effect of feedback provision on student
performance, finding mixed results.
Disentangling feedback effect from the anti-procrastination effect
De Paola and Scoppa (2011) carry out a field experiment to assess the effect of
frequency and disentangle the quick feedback effect from the anti-procrastination effect. Students in the treatment group were allowed to undertake an intermediate examination covering the first part (module 1) of the course material and a final exam (module 2)
covering exclusively the second part, while students in the control group were permitted
to undertake exclusively the final examination (covering the whole course material) at the end of the course program. Firstly, they compare treatment and control group results
for Module 1, the material on which only treated students had previously been tested. Because only the treatment group was required to take an intermediate exam on this
module but both experimental groups were provided with the intermediate exam solutions, they call this result the "workload division or commitment effect." Secondly,
in order to isolate the feedback effect, they compare the difference in performance of treated students between the two modules. Treated students in both modules benefit of
6 We offer a novel setting to explore the quick feedback effect and the anti-procrastination effect: we built a joint-liability framework. Though we were not able to
disentangle both effects by this new framework, we offer some lessons for further research. We carry out a field experiment involving undergraduate students enrolled in
a Uruguayan university attending two introductory economics courses. In each classroom, the instructor divided all students in groups of three individuals. Instructor
provided a premium to take-home tests’ grade if every member of the group met two requirements: having a grade of at least 6 in the take-home test (in a scale from 1 to 12,
where 6 is the pass grade and 12 is the best grade), and having no absences during the
week in which the take-home test had to be handed in. It is a novel framework for education, inspired in the microfinance literature (Banerjee et al., 2015; Crepón et al., 2011; Becchetti & Pisani, 2010; Duflo et al., 2013) where individuals are jointly
responsible for the loans of their group (if all members of a group repay their loans, they
are eligible for second loans). In an education context, Cabrera and Cid (2013) found that this joint-liability framework improves academic performance by peer monitoring (and
could foster the anti-procastrination effect in our current research).
Within this joint-liability framework, we randomly assigned, in each classroom,
half of the groups to high frequency testing and half to low frequency testing. Lectures were distributed along 15 weeks. High frequency treatment consists of sixteen
take-home tests, while the control group consists of the usual eight take-take-home schedule (low frequency). This setting generates exogenous variation it the frequency of testing. While
7 We expect students with high frequency take-home tests to improve their academic performance in comparison to those with low frequency take-home tests, as a
result of being more frequently exposed to testing. We do not only analyze students´ performance in the intervention courses, but also the spillover effects, i.e. the effect on
the academic outcomes at the other courses taken in the same semester.
The paper is organized as follows. In Section 2 we explain the design of the
experiment and we provide information about the grading system at the University of Montevideo. In Section 3 we explain our empirical methodology and show our results
on the effects of testing frequency on grades obtained by students. Section 4 concludes.
Program and Experiment Design
Our experiment was implemented with 48 freshmen enrolled in Macroeconomics
and Descriptive Economics courses at University of Montevideo during the 2012
academic year. The University of Montevideo is a middle-sized private University located in the capital of Uruguay. It has currently about 3,500 students enrolled in
different degrees. At the beginning of the Macroeconomics and Descriptive Economics classes (in August 2012) students were informed of the experiment both through
presentations during the teaching hours and through a letter, sent to all students, explaining the format of the experiment. As instructors of both courses, we asked
students to register to join the experiment.
Macroeconomics and Descriptive Economics courses were structured in the same
8 fifteen weeks. Students were allowed to have up to 15 absences. The grading system and requirements are similar to other courses at the University. The courses started in
August 2012 and lasted until November. In each course, Treatment and Control groups attended the class in the same room, at the same time and with the same instructor and
teaching material.
The aim of the intervention is to test whether high frequency take-home tests
improve academic performance under a joint-liability framework. Firstly, in each classroom, the instructor divided all students in groups of three individuals. Instructors
provided a premium to take-home tests’ (a 20% increase in the grade) if every member
of the group met certain requirements: having a grade of at least 6 in the take-home test (in an scale from 1 to 12, were 6 is the pass grade and 12 is the best grade), and having no absences during the week in which the take-home test had to be handed in. Secondly,
with the approval of the ethical review board of the university, we designed a
randomized trial. Students were randomly assigned to high or low-frequency examinations. Using this evaluation design we avoided self-virtuous group selection:
lazy students could have self-selected into the low frequency group. Half of the three-student-groups were assigned to the sixteen take-home testing (high frequency
treatment), while the others were assigned to the eight take-home testing (low frequency or control group).
Take-home tests did not require team work. Moreover, students were allowed to prepare the take-homes individually, with their friends or with their
9 the beginning of the lecture, each student was required to hand in the solutions in a personal sheet. It is important to note that the content of the 16 take-home tests is exactly
the same as the content of the 8 take-home tests. So, the treatment is a variation in the
frequency of the exercises, not in the total amount of exercises each student has to complete during the course (each take-home test of the low frequency group consists of exactly the same exercises that are include in two take-home tests of the high frequency group).
A potential concern is that we, as instructors, may have introduced some bias in the grading of treatment and control groups. It was not possible for us to be ignorant of
student treatment status because we graded twice as many take-home exams for treated
students. In principle, this could have influenced how we graded student work or behaved towards students, biasing the experimental results. We address this concern by three simultaneous strategies. First, nearly all of the content of the examinations
(homework, mid-term exam and final exam) are exercises. The exercises demand
numeric results and facilitate an objective grading. Second, after grading home tests and exams, we handed the marked tests to students, and provided the solutions and the
criteria of grading employed. The students therefore had the opportunity to compare their grades with the other students and complain if they identified any unfair grading.
Third, we did not include any grading of the oral participation of students at classes. The grading of oral participation may have been too subjective and it would be difficult to
keep the same criteria for every student.
There were 48 students in this field experiment: 24 in Macroeconomics and 24 in
10 characteristics such as age, gender, working hours, hours devoted to sports and volunteering, high school of origin, region of the country they came from, commute time
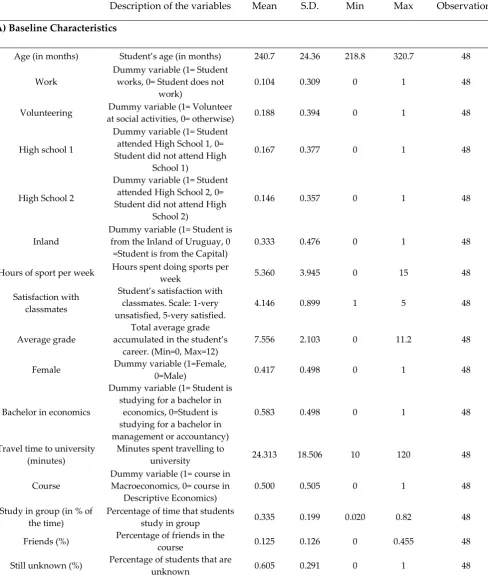
to university, academic expectations and number of friends in the classroom. Table 1 provides descriptive statistics for our sample of students. The average student is 20 years
old and has an average grade of 7.5. One third are from the inland of the country, nearly 42% are female and approximately 30% of the students come from two private high
schools in Montevideo. Nearly 10% of the students in the classroom have a job, 19% do volunteer work and, on average, the students in the intervention practice sports 5 hours
a week. With respect to the student’s social behavior, we find that they devote 33% of
their study time to studying in groups. When students were asked about the number of classmates they considered friends, we find that, on average, 13% of them are so. Similarly, the average percentage of unknown classmates is 60%.
Half of the students (24) were randomly assigned to the high frequency
take-home testing while the other half (24) were assigned to the low frequency testing group. Students were informed by email of their assignment status and the list of students
belonging to the Treatment and Control group was published on the classes’ web-pages.
Table 2 shows that the randomization was successful in creating comparable
treatment and control groups in observable characteristics, since both groups are balanced in seventeen observable variables.
Some students suffered attrition. It is usual that students drop out from some courses during the semester due to different reasons (e.g. freshmen students usually
11 Treatment group and 4 students from the Control group). We gathered some outcomes (follow-up administrative data) for those who suffered attrition, but we could not collect
the information on all the outcomes of interest for the whole sample (e.g. grade in midterm exam). Therefore, taking this into account, we compared pre-treatment
characteristics of the individuals that suffered attrition and the students that remained in the Treatment/Control groups. We found that all the pre-treatment variables remain
balanced. Moreover, we have tested the differential attrition by treatment status and obtained the same results (results are available from the authors upon request).
Method
High Frequency vs. Low Frequency Take-Home Tests
Formally, we assume that student performance is determined as follows:
𝑌𝑖 = 𝑎 + 𝑏𝑇𝑖+ 𝑑𝑀𝑎𝑐𝑟𝑜𝑖+ 𝑋𝑖′𝑓 + 𝑒𝑖
where 𝑌𝑖 is one of the outcomes of interest for student i (grade in midterm exam, grade in final exam, average grade in take-home tests1, average grade in midterm exams and homework of other simultaneous courses, average grade in final exams of other
simultaneous courses, the student’s cumulative grade point average)2, 𝑇
𝑖 is the parameter of interest: a dummy variable that takes the value one if student i is assigned to high frequency testing (16 take-home tests) and zero otherwise, 𝑀𝑎𝑐𝑟𝑜𝑖 is a dummy
variable that takes the value one if student i belongs to the Macroeconomics course and zero otherwise, 𝑋𝑖 is a vector of student characteristics at baseline, and 𝑒𝑖 is the error
1 These three grades are standardized. Standardized grades are calculated by subtracting the course mean (Descriptive Economics or Macroeconomics) and dividing by the course standard deviation. We do not include the 20% prize in the average grade in take-home tests.
12 term. Because of the random assignment and the inexistence of non-compliers, we estimate the equation using Ordinary Least Squares (OLS).
Besides standard confidence intervals in our OLS estimations we implemented permutation tests. The advantage of this method is that it is valid even with small
samples and does not rely on the distributional characteristics of the data (Rossi, 2014; Bloom et al. 2013). The null hypothesis of this test is that both samples come from the
same distribution. The permutation test takes all possible combinations of group membership and produces a permutation distribution. In other words, if we assume
both samples came from the same population, a data point in the high frequency testing
group (Treatment group) is just as likely to appear in the low frequency testing group (Control group). If we determine all possible permutations, we can compute our statistic of interest for each permutation and create a distribution. We can then measure where
our original statistic falls in this distribution. If it is in the tails then we have evidence
that our two samples come from two different populations. We performed 10,000 permutation tests and calculated the t-statistics for every outcome. Once this was
estimated, we obtained the 2.5% (t0.025) and 97.5% (t0.975) percentiles of the t-test distribution. In the case that t-values were greater than t0.975 or smaller than t0.025, it could
be stated that the difference is significant at the 5% level and therefore the treatment effect would have been significant.
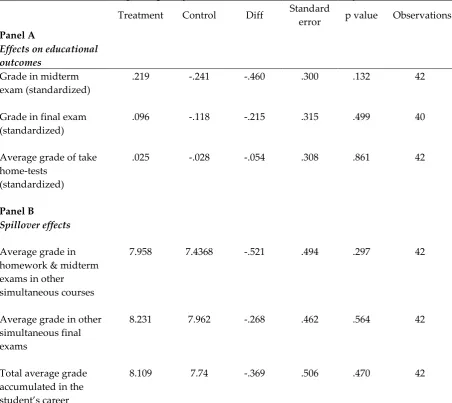
Table 3, Panel A, reports the effect of the treatment on the educational outcomes (grade in midterm exam, grade in final exam and average grade in take-home tests) in
13 not indicate a definitive improvement in the performance of students in the weekly treatment relative to biweekly testing.
Finally, examining students’ performance in other courses, in Table 3 Panel B we
show that the pressure exerted on treated students by frequent testing does not cause a
substitution effect (treated students may have diverted effort from other courses in order to earn the bonus in Macroeconomics and Descriptive Economics). We study the
following outcomes: average grade in midterm exams and homework of other simultaneous
courses, average grade in final exams of other simultaneous courses, and the student’s cumulative
grade point average. We find that treated students did not perform worse in non targeted
examinations or in their cumulative GPA, compared to students in the control group.
We are not able to rule out the possibility that our zero impact results could be explained by the lack of statistical power. With only 48 students in the sample (42 after
attrition), the study has limited power to detect significant treatment effects. To detect
an effect of 0.46 standard deviations (the point estimate for midterm exam grade reported in Table 3), we have power of only 0.36. In other words, even if the true effect
size were 0.46 standard deviations—a large effect for an education intervention—we would only detect this effect roughly one of every three times we ran the experiment.
Discussion
Recent research has tried to investigate the effects of teaching and evaluation
practices on student performance. An important issue concerning this topic regards the optimal number of examinations. In this paper we contribute to this emerging literature
14 undergraduate students enrolled at a middle-sized university and attending two introductory economics classes. Students participating in the experiment were randomly
assigned to a Control group (low-frequency testing) and to a Treatment group (high-frequency testing). Previous literature has scarcely investigated the different
mechanisms that link frequent testing and academic performance. To explore those mechanisms, we employ a novel setting –a joint-liability framework- that fosters peer
monitoring among students. Although the high-frequency groups show a higher mean performance on academic results, our findings do not indicate a definitive improvement
in performance in weekly versus biweekly testing. Finally, the higher mean performance
of treated students in targeted courses does not seem to have been obtained at the expenses of results earned in other courses.
What could explain this lack of impact? Though we are not able to rule out the
possibility that our findings could be explained by the lack of statistical power, we now
explore some answers from previous educational and psychological literature that may provide lessons for further research. Hattie and Timperley (2007) offer evidence that
shows that the type of feedback and the way it is given can be differentially effective. They propose a model of feedback that identifies the particular properties and
circumstances that make it effective, and some typically thorny issues are discussed, including the timing of feedback and the effects of positive and negative feedback. For
instance, students can increase their effort, particularly when the effort leads to tackling more challenging tasks or appreciating higher quality experiences rather than just doing
“more.” In a similar vein, recent findings from psychology show the importance of
15 Vaessen et al. (2017) is the first study that focuses on the perception of students regarding the specific intervention of frequent assessment, and they develop a new instrument to
test students’ perceptions. Their analysis shows that four aspects of perception of
frequent assessment could be distinguished. The first one is the value that students
attribute to frequent assessment. Teachers should take into account the nature of a course
and students’ initial intrinsic motivation when designing assessments. When the initial
intrinsic motivation is high, it might be better to use assessments that do not feel controlling (i.e. non-obligatory and feedback only). The second aspect of students’
perceptions of frequent assessments found in Vaessen et al (2017) is labelled formative
function. This aspect reflects whether students believed they had used the results from frequent assessments in their learning processes. The third and fourth aspects of the students’ perceptions are positive effects and negative effects. These aspects reflect the
perceived impact of frequent assessments on self-confidence and stress: either less stress
and more self-confidence for positive effects, or more stress and less self-confidence for negative effects. Vaessen et al (2017) concludes showing the relevance of including
students’ perception of assessments in research on assessment: communication with
students about the purpose and benefits of frequent assessments could be the key to
reducing possible negative effects from graded frequent assessments and increasing
students’ effort on non-graded frequent assessment.
Next, we offer other lessons and hypotheses for further research. Firstly, when testing is too recurrent, students may not have enough time to deepen their knowledge
16 tasks every two weeks, they could get a head start by studying with those in the treatment group which would push our estimates towards zero (because of positive
spillover effect). Future experimental designs may include slightly different take-home tests (for instance, different exercises but of the same difficulty) for Treatment and
Control groups in order to avoid spillover effects resulting from Treated and Control group students studying together. Thirdly, the difference in the frequency of take-home
tests may be too small to find any differences in effort among students; or the duration of the intervention (15 weeks) may be too short of a time to see changes in habit
formation. Thus, the long-term effect of learning could be incorporated. Frequent
assessment may influence how students spread their study. Studying regularly, instead of cramming, may benefit long-term retention of study. Fourthly, studying how the class and group size as well as prize size may change the results in the joint-liability
framework remains for future research. The costs of monitoring each other may be too
high, leading students to prefer to lose the prize, regardless of the frequency of their take-home tests. Fifth, the joint-liability framework employed in the present experiment,
did not allow us to disentangle the feedback effect from the anti-procrastination effect. In the vein of De Paola and Scoppa (2011), in order to isolate the feedback effect, we should have
designed ways to keep similar incentives to procrastinate between treatment and control group. The presence of peer monitoring due to the joint-liability framework may diminish
the propensity to procrastinate, but is unlikely to eliminate it. For instance, students in the treatment group were incentivized to study each week for take-home tests, while
17 the task to the last minute. Both the feedback frequency and incentives to procrastinate therefore varied between treatment and control groups. Grades on other exams and in
other courses would similarly conflate the feedback frequency and reduced procrastination mechanisms. For future investigations, we should try to identify the
feedback effect by removing the procrastination channel. That design may follow De Paola and Scoppa (2011) in holding both the exam timing and material covered constant
between treatment and control, while providing more frequent feedback for the treatment group. Finally, further research may replicate our investigation but with
non-mandatory courses, and with courses from other majors, to explore heterogeneity.
One caveat of our randomized experiment may be that the conclusions are limited to undergrad students from a similar background, that is, freshman students taking introductory courses. Nevertheless, we believe that this pilot study has explored
interesting mechanisms and novel frameworks for assessing the effect of frequency of
testing, which may be useful in other contexts.
Students’ learning processes and learning outcomes are strongly influenced by
the assessment system (Gibbs and Simpson, 2004). Vaessen et al. (2017) provides examples showing that, if well designed, assessment and resulting feedback can
contribute to and improve the learning process; but if designed poorly, assessment can hinder learning by causing anxiety, low self-esteem, low motivation for learning and
inappropriate study behaviors such as surface approaches to learning and cramming. Once stakeholders realize the cognitive and non-cognitive mechanisms behind the
18
Funding
Not applicable.
Disclosure of potential conflict of interest
The Authors declare that they don
’
t have conflict of interest.
Ethical approval
19
References
Adesope, O. O., Trevisan, D. A., & Sundararajan, N. (2017). Rethinking the Use of Tests: A Meta-Analysis of Practice Testing. Review of Educational Research, 87(3), 659-701.
Adkins, J. K., & Linville, D. (2017). Testing Frequency in an Introductory Computer Programming Course. Information Systems Education Journal, 15(3), 22.
Ariely, D., & Wertenbroch, K. (2002). Procrastination, deadlines, and performance: Self-control by precommitment. Psychological science, 13(3), 219-224.
Azmat, G., & Iriberri, N. (2010). The importance of relative performance feedback information: Evidence from a natural experiment using high school students. Journal of Public Economics, 94(7), 435-452.
Bandiera, O., Larcinese, V., & Rasul, I. (2015). Blissful ignorance? A natural experiment on the effect of feedback on students' performance. Labour Economics, 34(European Association of Labour Economists 26th Annual Conference), 13-25.
Banerjee, A., Duflo, E., Glennerster, R., & Kinnan, C. (2015). The miracle of microfinance? Evidence from a randomized evaluation. American Economic Journal: Applied Economics, 7(1), 22-53.
Bangert-Drowns, R. L., Kulik, J. A., & Kulik, C. L. C. (1991). Effects of frequent classroom testing. The Journal of Educational Research, 85(2), 89-99.
Becchetti, L., & Pisani, F. (2010). Microfinance, Subsidies and Local Externalities. Small Business Economics, 34(3), 309-321.
Black, P., & Wiliam, D. (1998). Assessment and classroom learning. Assessment in Education: principles, policy & practice, 5(1), 7-74.
Bloom, N., Eifert, B., Mahajan, A., McKenzie, D., & Roberts, J. (2013). Does management matter? Evidence from India. The Quarterly Journal of Economics, 128, 1-51.
Cabrera, J.M., & Cid, A. (2017). Gender Differences to Relative Performance Feedback: A Field Experiment in Education. Working paper, Universidad de Montevideo. Retrieved from:
20 Cabrera, J.M., & Cid, A. (2013). Joint-Liability vs. Individual Incentives in the Classroom. Lessons from a Field Experiment with Undergraduate Students. Working Paper. Retrieved from:
http://www2.um.edu.uy/jmcabrera/Research/Jointly_Liability_vs_Individual_Ince ntives_28012014.pdf
Crepón, B., Devoto, F., Duflo, E., & Perienté, W. (2011). Impact of microcredit in rural areas of Morocco: Evidence from a randomized evaluation. J-PAL working paper. Retrieved from http://economics.mit.edu/files/6659.
De Paola, M., & Scoppa, V. (2011). Frequency of examinations and student achievement in a randomized experiment. Economics of Education Review, 30(6), 1416-1429. Domenech, J., Blazquez, D., De la Poza, E., & Mun͂oz-Miquel, A. (2015). Exploring the
impact of cumulative testing on academic performance of undergraduate students in Spain. Educational Assessment, Evaluation and Accountability, 27(2), 153-169. Duflo, E., Banerjee, A., Glennerster, R., & Kinnan, C. (2013). The Miracle of Microfinance?
Evidence from a randomized evaluation. NBER Working Paper No. 18950.
Gibbs, G., & Simpson, C. (2004). Does your assessment support your students’ learning.
Journal of Teaching and Learning in Higher Education, 1(1), 3-31.
Hattie, J., & Timperley, H. (2007). The power of feedback. Review of educational research, 77(1), 81-112.
Kika, F. M., McLaughlin, T. F., & Dixon, J. (1992). Effects of frequent testing of secondary algebra students. The Journal of Educational Research, 85(3), 159-162.
Murphy, D. P., & Stanga, K. G. (1994). The effects of frequent testing in an income tax course: An experiment. Journal of Accounting Education, 12(1), 27-41.
Rossi, M. (2014). The impact of individual wealth on posterior political power. Journal of Economic Behavior & Organization, 106, 469-480.
Schrank, Z. (2016). An Assessment of Student Perceptions and Responses to Frequent Low-stakes Testing in Introductory Sociology Classes. Teaching Sociology, 44(2), 118-127.
Vaessen, B. E., van den Beemt, A., van de Watering, G., van Meeuwen, L. W., Lemmens,
L., & den Brok, P. (2017). Students’ perception of frequent assessments and its
21 Table 1 - Definition of baseline characteristics and outcome variables
Description of the variables Mean S.D. Min Max Observations
A) Baseline Characteristics
Age (in months) Student’s age (in months) 240.7 24.36 218.8 320.7 48
Work
Dummy variable (1= Student works, 0= Student does not
work)
0.104 0.309 0 1 48
Volunteering Dummy variable (1= Volunteer
at social activities, 0= otherwise) 0.188 0.394 0 1 48
High school 1
Dummy variable (1= Student attended High School 1, 0= Student did not attend High
School 1)
0.167 0.377 0 1 48
High School 2
Dummy variable (1= Student attended High School 2, 0= Student did not attend High
School 2)
0.146 0.357 0 1 48
Inland
Dummy variable (1= Student is from the Inland of Uruguay, 0
=Student is from the Capital)
0.333 0.476 0 1 48
Hours of sport per week Hours spent doing sports per
week 5.360 3.945 0 15 48
Satisfaction with classmates
Student’s satisfaction with
classmates. Scale: 1-very unsatisfied, 5-very satisfied.
4.146 0.899 1 5 48
Average grade
Total average grade
accumulated in the student’s
career. (Min=0, Max=12)
7.556 2.103 0 11.2 48
Female Dummy variable (1=Female,
0=Male) 0.417 0.498 0 1 48
Bachelor in economics
Dummy variable (1= Student is studying for a bachelor in
economics, 0=Student is studying for a bachelor in management or accountancy)
0.583 0.498 0 1 48
Travel time to university (minutes)
Minutes spent travelling to
university 24.313 18.506 10 120 48
Course
Dummy variable (1= course in Macroeconomics, 0= course in
Descriptive Economics)
0.500 0.505 0 1 48
Study in group (in % of the time)
Percentage of time that students
study in group 0.335 0.199 0.020 0.82 48
Friends (%) Percentage of friends in the
course 0.125 0.126 0 0.455 48
Still unknown (%) Percentage of students that are
22
Educational Aspirations
Scale: 1- Bachelor unfinished,
2-Hold a Bachelor’s degree, 3-Hold
two bachelor’s degrees, 4-Hold a
master’s degree, 5- Hold a Ph.D. degree
3.604 1.106 2 5 48
B) Outcomes at Follow-up
Grade in midterm exam (standardized)
Standardized grades in midterm exams. (Scale in
midterm exams: Min=0, Max=12).
0.000 0.988 -1.876 1.436 42
Average grade of take home-tests (standardized)
Standardized grade of take home-take tests (Scale in
take-home tests: Min=o, Max=12).
0.000 0.989 -2.661 1.529 46
Grade in final exam (standardized)
Standardized grade in final exam (Scale in final exams:
Min=0, Max=12).
0.000 0.987 -1.825 2.004 40
Total average grade accumulated in the
student’s career
Total average grade
accumulated in the student’s
career after the intervention. (Min=0, Max=12)
7.623 1.954 0 10.5 48
Average grade in homework & midterm
exams in other simultaneous courses
Average grade in homework & midterm exams in simultaneous courses (not the
intervention ones). Min=0, Max=12.
7.615 1.559 4 11.25 47
Average grade in other simultaneous final exams
Average grade in simultaneous final exams (not
the intervention courses). Min=0, Max=12.
23
Treatment Control Difference
Standard
error P-value Age (in months) 236.214 245.273 9.059 6.984 0.201
Work 0.083 0.125 0.042 0.090 0.645
Volunteer 0.167 0.208 0.042 0.115 0.719
High school 1 0.125 0.208 0.083 0.109 0.449
High School 2 0.167 0.125 -0.042 0.104 0.690
Inland 0.375 0.292 -0.083 0.138 0.550
Hours of sport per
week 5.221 5.500 0.279 1.150 0.809
Satisfaction with
classmates 4.208 4.083 -0.125 0.262 0.635
Average grade 7.879 7.233 -0.646 0.606 0.292
Female 0.458 0.375 -0.083 0.145 0.568
Bachelor in economics 0.625 0.542 -0.083 0.145 0.568 Travel time to
university (minutes) 25.291 23.333 -1.958 5.392 0.718 Group (1=
Macroeconomics, 0 = Descriptive Economics)
0.500 0.500 0.000 0.147 1.000
Study in group (in %
of the time) 0.337 0.333 -0.004 0.058 0.945
Friends (%) 0.142 0.108 -0.035 0.036 0.343
Still unknown (%) 0.584 0.625 0.041 0.085 0.627 Educational
Aspirations 3.708 3.500 -0.208 0.321 0.520
24 Table 3 - The effect of high frequency tasks on academic achievement by outcome
Treatment Control Diff Standard
error p value Observations Panel A
Effects on educational outcomes
Grade in midterm exam (standardized)
.219 -.241 -.460 .300 .132 42
Grade in final exam (standardized)
.096 -.118 -.215 .315 .499 40
Average grade of take home-tests
(standardized)
.025 -.028 -.054 .308 .861 42
Panel B
Spillover effects
Average grade in homework & midterm exams in other
simultaneous courses
7.958 7.4368 -.521 .494 .297 42
Average grade in other simultaneous final exams
8.231 7.962 -.268 .462 .564 42
Total average grade accumulated in the
student’s career
25
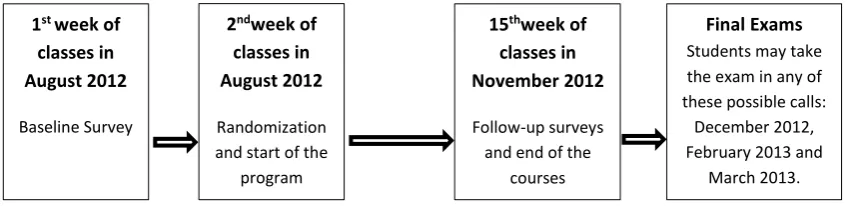
Figure 1 - Timeline of the Program and Data Collection
1st week of
classes in August 2012
Baseline Survey
2ndweek of
classes in August 2012
Randomization and start of the
program
15thweek of
classes in November 2012
Follow-up surveys and end of the
courses
Final Exams
Students may take the exam in any of these possible calls:
December 2012, February 2013 and