U.S. EqUity MUtUal FUNdS
Trucost and RLP Capital study on the effects of
environmental, social and governance (ESG) analysis
This report was jointly written by Trucost Plc and RLP Capital, Inc.
TrucosT Plc
Trucost was established in 2000, to help organizations, investors and governments understand and quantify the environmental impacts of business activities. Over the past 10 years Trucost has collected, researched and validated environmental data from organizations across the world. The result is the world’s most comprehensive data on corporate environmental impacts, including greenhouse gas emissions, water, waste and air pollutants.
This enables our clients to access:
• The most efficient approach to measuring GHG emissions and wider environmental impacts across organizations, supply chains and investment portfolios;
• Clear identification of prioritised focus areas for reducing environmental impacts; • Validation of source data, including completion of gaps in data;
• Comparison of environmental performance against peers, sectors and investment benchmarks; • The ability to create environmentally-oriented investment products.
For more information, visit www.trucost.com
rlP caPiTal, inc.
RLP Capital, Inc. is a forward-thinking, independent wealth management firm providing retirement plan consulting, asset management and financial planning services for individuals, families, non-profit organizations and corporations. RLP Capital has been a pioneer and driver of industry change: • Early adopter in providing co-fiduciary 401k plan consulting services,
acting as the lead investment steward working in conjunction with plan investment committees;
• Created The Green 401k™, a consulting-based 401k solution designed to help companies incorporate responsible investments into their plan menu while providing co-fiduciary oversight; • Developed the ESG Rating to help investors understand the degree to which mutual funds are
incorporating environmental, social and governance (ESG) analysis and to provide greater mutual fund transparency;
• Sustainable/Responsible customized investment solutions for individuals and institutions that integrate environmental, social and governance (ESG) analysis;
For more information, visit www.rlpcapital.com | www.thegreen401k.com
aBouT THE auTHors:
CONTENTS
Introduction 4
Carbon intensity indicates financial risk 4
Overview of analysis 5 Research findings 6
Carbon footprint vs. financial
performance 7
Conclusions 10
Appendices 11
Appendix 1: Performance
table 11
Securities and advisory services offered through NPC of America (NPCOA), member FINRA/SIPC, and a Registered Investment Adviser. RLP CAPITAL, INC., Trucost PLC and NPCOA are separate and unrelated companies.
Trucost PLC is authorized and regulated in the UK by the Financial Services Authority (“FSA”). The contents of this document have been issued and approved by Trucost PLC (“Trucost”). None of the information nor the opinions expressed herein constitutes, or are to be construed as, an offer or a solicitation of an offer to buy, sell or subscribe for any benchmark, company, fund, index, share or sector mentioned within this document.
All information contained herein is based on sources which we believe to be reliable but we do not represent that it is accurate or complete. Trucost and its affiliates are not responsible for any errors or omissions or for the results obtained from the use of such information contained within the document.
This document discusses general market activity, industry or sector trends, or other broad-based economic, market or
political conditions when looking at carbon risks and should not be construed as research or investment advice. All opinions and estimates included in this document are subject to change without notice and should not be relied upon unless independently verified. This document is intended for use by Eligible Counterparty and Professional clients only as defined under the FSA‘s rules. The investment products discussed in this report may not be suitable for all types of investors. Investors should seek independent professional advice before making their own investment decisions based upon their own financial objectives and it should be noted that an investment in a benchmark, company, fund, index, share or sector involves risks.
Investors should be aware that the market price of any benchmark, company, fund, index, share or sector discussed in this document may be volatile. Past performance is not necessarily a guide to future performance and an investor may not get back the amount originally invested. Where an investment is made in currencies other than the investor’s base currency, movements in exchange rates will have an effect on the value,
either favourable or unfavourable of the investment made. In the case of an illiquid stock, the investor may be unable to buy or subscribe for additional units or sell or unsubscribe from their investment at any price. Any tax relief mentioned within this document are those currently available and are subject to change and Trucost does not provide clients with tax advice. Professional advice should be sort independently by an investor from a tax expert before making any decision to invest in a product. An investor should also inform themselves as to any applicable legal requirements and taxation and exchange control regulations in the countries of their citizenship, residence or domicile which might be relevant before making any investment decision.
No part of this material may be copied, photocopied or duplicated in any form, by any means, or distributed to any person that is not an employee, officer, director, or agent of the recipient, without the prior written consent of RLP Capital or Trucost Plc.
All rights reserved. © RLP Capital, Inc./Trucost Plc 2010.
acknowledgements
Contributors:
Trucost Plc – Mark Trevitt and Liesel van Ast
RLP Capital, Inc. – Bud Sturmak CFP®, AIF®
Designed by Pad Creative Ltd www.padcreative.co.uk Cover picture: iStockphoto.com
4 1K
THE GREEN
SOCIALLY AND ENVIRONMENTALLYExEcuTivE summarY
T
his study compares the carbon footprints, performance, and risk characteristics of the eight largest Traditional equity mutual funds (by asset size) with the eight largest Responsible equity mutual funds in several key asset categories – Large Cap Blend, Large Cap Growth and Mid Cap Blend. The study aims to evaluate the effects of environmental, social, and governance (ESG) analysis employed by responsible investment managers, which is believed to give them a more comprehensive understanding of the companies they invest in. While traditionally managed mutual funds use an investment approach that relies solely on traditional financial analysis, responsible investment managers incorporate both traditional financial analysis and ESG analysis. The carbon footprint of each fund has been measured to assess the extent to which ESG analysis is correlated with carbon risks and returns.Findings show that the funds incorporating ESG analysis in this study outperformed over one- and three-year periods and exhibited significantly higher alpha, or risk-adjusted performance over the three-year period ending 30 June 2010. They also demonstrated smaller carbon footprints than the Traditional funds and could therefore be less exposed to the rising costs of emitting greenhouse gas emissions under planned climate change policy measures.
ESG financial performance:
• All eight Responsible funds in this study outperformed their Median Peer Group over a one-year period. Seven of eight outperformed their Median Peer Group over a three-year period, while five of eight outperformed over a five-year period. • All eight Responsible funds have
significantly higher alpha, or risk-adjusted performance, than their Median Peer Group and the eight Traditional funds in this study.
• RLP Capital’s ESG Rating, which measures the degree to which mutual funds incorporate ESG factors into their investment analysis, appears to be positively correlated with alpha.
Carbon footprints:
• The Responsible funds analyzed are on average 40% less carbon intensive than the Traditional funds, with an average alpha rank of 13% compared to 42% for the Traditional funds.
• In the three fund categories of Large Cap Blend, Large Cap Growth and Mid Cap Blend, the Responsible funds have smaller average carbon footprints.
• Fund holdings analyzed are associated with over 100 million metric tons of greenhouse gases, measured in carbon dioxide equivalent (CO2e) emissions. This is equivalent to 1.4% of U.S. emissions of 6.96 billion metric tons of CO2e in 2008.
Key findings:
“Funds that
incorporate
environmental, social
and governance
analysis had higher
alpha and are less
exposed to carbon
costs.”
inTroducTion
T
he United States Government has committed to reducing greenhouse gas (GHG) emissions by 17 per cent compared to 2005 levels by 2020, under the United Nations Copenhagen Accord of December 2009.1 Legislation to introduce a national cap-and-trade program was passed by the U.S. House of Representatives in 2009.2 The program would set a cap on emissions of GHGs such as carbon dioxide and companies would need tradeable permits to comply. However, similar draft legislation has stalled in the Senate during 2010.Meanwhile, the U.S. Environmental Protection Agency (EPA) plans to limit GHG emissions under the Clean Air Act. Proposed legislation would require businesses planning to build or expand large facilities to obtain New Source Review Prevention of Significant Deterioration (PSD) permits for GHG emissions.3 Under a finalized GHG Tailoring rule, new stationary sources and major modifications to existing facilities that are covered by the PSD permitting program and emit at least 75,000 metric tons of GHG emissions annually must obtain a GHG permit from 2 January 2011. Permits would require plants to apply best available technology to control emissions.4 In addition, 10 states have been participating in the first mandatory emission trading scheme in the U.S. – the Regional Greenhouse Gas Initiative (RGGI) – for two years. Power companies under the RGGI must hold carbon dioxide (CO2) allowances equal to their CO2 emissions. States are selling the majority of allowances, with auctions raising over US$729 million by September 2010.5 Further regional emissions trading systems and other state-level measures to reduce GHG emissions are being developed.
carBon inTEnsiTY indicaTEs financial risK
Policy measures to reduce GHG emissions will have financial implications for carbon-intensive companies.6 Measures such as cap-and-trade programs that apply a price to carbon could alter the economics of industry sectors, affecting company share prices both positively and negatively, depending on their carbon performance. This would cause a re-alignment of competitive positions within many industries, and a company’s ability to reduce exposure to carbon costs will likely affect its profitability. The effects on company cash flows could depend on factors including the sectors in which they operate, carbon reduction strategies and capital investments.
Nearly all companies are likely to be affected by carbon costs passed on in energy prices. Less carbon-intensive industries could be indirectly exposed to carbon costs through logistics or transport suppliers. To shift to a carbon-constrained economy, companies will need to change business models, redesign operations and adjust investment strategies. The gradual pace at which most companies change their resource use, infrastructure, processes, technologies or product mixes, will provide a window of competitive advantage for early movers. Many companies that have begun to reduce their GHG emissions have achieved efficiency gains with financial benefits.
A company’s exposure to the costs of compliance with emissions limits and trading programs can affect the performance of an investor’s portfolio. The U.S. Securities and Exchange
Commission issued guidance in January 2010 that clarifies what publicly-traded companies need to disclose to investors in terms of climate change-related “material” effects on business operations, whether from emissions management, the physical impacts of climate change or business opportunities such as clean energy development.
Investors will see carbon risk compounded across diversified funds as direct and indirect carbon costs incurred by companies feed through value chains. Investors are increasingly using active ownership rights to hold companies accountable for their carbon performance. Support for climate change-related shareholder resolutions increased from 11% in 2005 to 27% 1 http://www.bloomberg.com/news/2010-09-03/u-s-affirms-17-climate-target-envoys-cite-progress-on-green-fund-.html,
accessed 1 October 2010
2 American Clean Energy and Security Act of 2009, H.R. 2454 3 http://www.epa.gov/nsr/actions.html#aug10, accessed 7 October 2010 4 http://www.epa.gov/nsr/documents/20100413fs.pdf, accessed 7 October 2010
5 http://www.rggi.org/docs/Auction_9_News_Release_MM_Report.pdf, accessed 5 October 2010 6 UNEP Finance Initiative (2009), The materiality of climate change
COPENhAgEN
ACCORd
Most industrialized countries have pledged targets to reduce ghg emissions by 2020. The Intergovernmental Panel on Climate Change recommends that industrialized countries cut emissions by 25-40% below 1990 levels by 2020 to help limit the average rise in global temperatures to 2°C. Emissions trading is widely seen as the most cost-effective way for companies to reduce ghg emissions.
in 2009.7 Ratings agencies, financial analysts and fund managers will increasingly factor carbon performance into company valuations. Carbon-efficient companies are expected to appreciate as the relationship between valuation multiples and carbon efficiency strengthens, particularly in carbon-intensive sectors.8
Carbon intensity should be considered in investment portfolios. Findings from an earlier systematic quantitative analysis examining environmental, social and governance (ESG) risk in a portfolio context, using Trucost’s carbon footprint data, suggest that significant portfolio risk reduction or return enhancement can be achieved by allocating equity investments to companies that proactively deal with ESG risks.9
ovErviEw of analYsis
This study compares the carbon and financial performance of the largest actively managed Traditional and Responsible U.S. mutual funds. RLP Capital and Trucost co-authored this report on study findings. Trucost measured the “carbon footprints” of 16 mutual funds. Throughout this report, carbon risk refers to financial exposure to rising carbon costs as corporate greenhouse gases come under policy measures such as emissions trading and performance standards. RLP Capital examined the financial performance of the funds.
The funds selected for this study were the largest actively managed U.S. mutual funds (by asset size) in the Large Cap Blend, Large Cap Growth, and Mid Cap Blend fund categories as of 30 June 2010. The analysis also includes the Vanguard 500 (the largest S&P 500 Index fund). Funds experiencing significant style drift may have been excluded from this analysis, and any funds with total assets below US$300 million have been excluded. The currency used throughout the report is U.S. Dollars (US$).
Eight Traditional funds and eight Responsible funds were analyzed. “Responsible” equity funds incorporate financial and ESG analysis to identify companies with solid financial prospects that also demonstrate positive track records with regard to the environment, social issues and corporate governance. Traditional funds generally rely solely on financial analysis and do not use ESG analysis in their stock selection. This report refers to a “Traditional Group” and a “Responsible Group” of mutual funds throughout. These groups are comprised of the following funds:
Traditional Group:
1 American Funds Fundamental Investors 2 American Funds Growth Fund of America 3 American Funds Investment Company of America 4 Davis NY Venture
5 Fidelity Contrafund
6 Fidelity Leveraged Company Stock 7 Fidelity Low-Priced Stock
8 Vanguard 500 Index
Responsible Group:
1 Ariel
2 Ariel Appreciation
3 Calvert Social Investment Equity 4 Domini Social Equity
5 Neuberger Berman Socially Responsive 6 Parnassus
7 Parnassus Equity Income 8 TIAA-CREF Social Choice Equity.
RLP Capital’s ESG Research
RLP Capital, Inc. examines over 30 ESG criteria to determine what factors, if any, are incorporated into each mutual fund’s investment process. RLP Capital has developed a proprietary rating system called the ESG Rating, which scores each mutual fund based on the degree to which it incorporates ESG criteria. Each fund is then given one of five ratings ranging from ESG-0 (for funds that do not employ any ESG analysis) to ESG-4 (for funds that employ a high level of ESG analysis). RLP gave six of the eight Responsible funds included in this study an ESG-4 rating, and two funds received the second-highest rating of ESG-3. The eight Traditional funds were rated ESG-0. 7 CERES, Berridge and Cook (June 2010), Mutual Funds and Climate Change: Growing Support for Shareholder Resolutions 8 Brinkman et al (October 2008), How Climate Change Could Affect Corporate Valuations, McKinsey Quarterly
9 Dr. S. Hörter, Dr. W. Mader and B. Menzinger (November 2009), ESG Risk Factors in a Portfolio Context: Integrated Modeling of Environmental, Social and Governance Risk Factors
To help understand how equity portfolios might be exposed to carbon costs, institutional investors and fund managers use Trucost “carbon footprints” as a quantitative assessment of fund carbon risk. A carbon footprint indicates “carbon intensity” and enables comparison of funds irrespective of size and investment style. The smaller the carbon footprint, the lower the portfolio exposure to carbon risks. Carbon footprints can help identify the most carbon-intensive companies held in funds. Carbon footprints are based on standardized GHG emissions data. The equity fund carbon footprint is calculated by measuring each constituent company’s GHG emissions. Quantities of GHGs have been calculated for each company and converted into metric tons of carbon dioxide-equivalents (CO2e). To limit double counting of GHG emissions, Trucost analyzed only the direct and first-tier indirect emissions for each company in a fund. First-tier GHGs are emitted by direct suppliers to a company, such as electricity and logistics providers.
CO2e emissions from each company are allocated to the fund in proportion to ownership. The carbon footprint is expressed as metric tons of CO2e emitted by the companies within each fund per million Dollars of revenue. The carbon emissions and revenues allocated to each fund are summed up to calculate the total carbon footprints of investment style categories and all aggregated holdings. To find out more about Trucost’s methodology, visit www.trucost.com
MEASuRINg fuNd
CARbON fOOTPRINTS
R
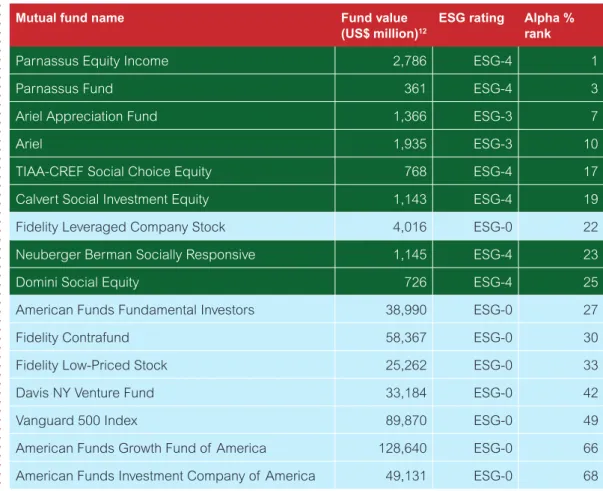
LP Capital’s analysis of the financial performance of the funds in this study found that funds incorporating a high degree of environmental, social and governance (ESG) factors into their investment analysis appear to be positively correlated with alpha.All eight Responsible funds have significantly higher alpha, or risk-adjusted performance, than the eight Traditional funds in this study. The funds receiving RLP Capital’s two highest ESG Rating of ESG-4 and ESG-3 demonstrated significantly higher alpha than the funds that received an ESG Rating of ESG-0, which are traditionally managed (see Table 1). The Responsible funds have an average alpha rank of 13%, compared to 42% for the Traditional funds.
The Responsible funds have higher alpha than the Traditional funds across all three investment categories analyzed – Large Cap Blend, Large Cap Growth, and Mid Cap Blend (see page 11).
Table 1: fund ranking by alpha performance over a three-year period
10Mutual fund name Fund value
(US$ million)12
ESG rating Alpha % rank
Parnassus Equity Income 2,786 ESG-4 1
Parnassus Fund 361 ESG-4 3
Ariel Appreciation Fund 1,366 ESG-3 7
Ariel 1,935 ESG-3 10
TIAA-CREF Social Choice Equity 768 ESG-4 17
Calvert Social Investment Equity 1,143 ESG-4 19
Fidelity Leveraged Company Stock 4,016 ESG-0 22
Neuberger Berman Socially Responsive 1,145 ESG-4 23
Domini Social Equity 726 ESG-4 25
American Funds Fundamental Investors 38,990 ESG-0 27
Fidelity Contrafund 58,367 ESG-0 30
Fidelity Low-Priced Stock 25,262 ESG-0 33
Davis NY Venture Fund 33,184 ESG-0 42
Vanguard 500 Index 89,870 ESG-0 49
American Funds Growth Fund of America 128,640 ESG-0 66
American Funds Investment Company of America 49,131 ESG-0 68
Alpha % Rank: The fund’s alpha percentile rank relative to all funds that have the same Morningstar Category. The highest (or most favorable) percentile rank is 1 and the lowest (or least favorable) percentile rank is 100.10 12
Notes to research findings:
101 The alpha % rank, total return % rank and peer group median data are © 2010, Fiduciary Analytics (a Fiduciary360 company – www.fi360.com). All rights reserved. The analysis and opinions: (1) do not constitute professional investment advice; (2) are provided solely for informational purposes; and (3) are not warranted or represented to be correct, complete, or accurate. The underlying data source used in these calculations is © 2010 Morningstar, Inc. All rights reserved. 112 Gross inception, expense ratio, alpha and total return data are © 2010 Morningstar, Inc. All rights reserved. The data
contained herein: (1) is proprietary to Morningstar, Inc and/or its content providers; (2) may not be copied or distributed; and (3) is not warranted to be accurate, complete or timely. Neither Morningstar, Inc nor its content providers are responsible for any damages or losses arising from any use of this information. Past performance is no guarantee of future results. Companies that are not
addressing their environmental impacts, carbon risks, worker safety and human rights may face significant headwinds in the future. External pressures may include cap-and-trade legislation, regulatory measures to implement commitments under global treaties such as the United Nations Copenhagen Accord, shifts towards more sustainable sourcing in supply chains and changing consumer demand.
ESG analysis can give investment managers a better understanding of how companies are managed and reveal a more complete spectrum of risk, value potential and future prospects. It can provide insight into the long-term positioning of companies as ESG issues become increasingly material. ESG analysis typically evaluates a company’s
performance in the following areas:
Environmental Emissions Energy/Resource efficiency Impact of products/services Hazardous waste Pollution prevention Use of renewable energy Waste management Social Corporate diversity Employee health/safety Human rights Labor relations Product safety
Support for local community Workplace
Governance
Corporate governance ESG reporting & disclosure Executive compensation.
ESg ANAlySIS
ExPlAINEd
rEsEarcH findings
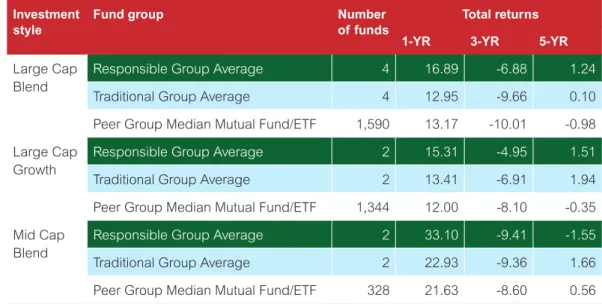
The funds were also compared against their Median Peer Groups as of 30 June 2010. All eight Responsible funds analyzed in this study outperformed their Median Peer Group over a one-year period. Seven of the eight Responsible funds outperformed their Median Peer Group over a three-year period, and five outperformed over a five-three-year period.
Table 2: Traditional and responsible fund group performance compared
to median Peer group
10, 11Investment style
Fund group Number
of funds
Total returns
1-YR 3-YR 5-YR
Large Cap Blend
Responsible Group Average 4 16.89 -6.88 1.24
Traditional Group Average 4 12.95 -9.66 0.10
Peer Group Median Mutual Fund/ETF 1,590 13.17 -10.01 -0.98
Large Cap Growth
Responsible Group Average 2 15.31 -4.95 1.51
Traditional Group Average 2 13.41 -6.91 1.94
Peer Group Median Mutual Fund/ETF 1,344 12.00 -8.10 -0.35
Mid Cap Blend
Responsible Group Average 2 33.10 -9.41 -1.55
Traditional Group Average 2 22.93 -9.36 1.66
Peer Group Median Mutual Fund/ETF 328 21.63 -8.60 0.56
All data as of 30 June 2010.
Peer Group – The group of funds, assigned by Morningstar, that has the most similar investment style among all of the funds in the Mutual Fund/ETF universe. The peer groups are also known as the Morningstar CategoryTM.
Total returns – Expressed in percentage terms, Morningstar’s calculation of total return is determined each month by taking the change in monthly net asset value, reinvesting all income and capital-gains distributions during that month, and dividing by the starting NAV. Reinvestments are made using the actual reinvestment NAV, and daily payoffs are reinvested monthly. Unless otherwise noted, Morningstar does not adjust total returns for sales charges (such as front-end loads, deferred loads and redemption fees), preferring to give a clearer picture of a fund’s performance. The total returns do account for management, administrative, 12b-1 fees and other costs taken out of fund assets. Total returns for periods longer than one year are expressed in terms of compounded average annual returns (also known as geometric total returns), affording a more meaningful picture of fund performance than non-annualized figures.
Peer Group Median Mutual Fund/ETF – The median manager for a given data point is calculated by ranking the managers (investments) within a given peer group on a particular data point from best to worst. The manager that represents the 50th percentile of the ranking becomes the median manager for the group.10 11
Other key findings on ESG financial performance include:
• All six Responsible funds in the Large Cap space included in this study outperformed their Median Peer Group over the one- and three-year periods.
• All eight Responsible funds in this study have an alpha that ranks in the top quartile versus all other funds in their Peer Group.
To find out the performance of each fund analyzed, see Appendix 1 on page 11.
carBon fooTPrinT vs. financial PErformancE
Responsible funds tend to have significantly smaller carbon footprints than traditionally managed funds. The Responsible funds analyzed have an average carbon footprint of 199 metric tons of CO2e per million US$ million of revenue while the Traditional funds have an average carbon footprint of 332 tons of CO2e per million US$ million of revenue. The Reponsible funds are 40% less carbon intensive than the Traditional funds. They therefore seem to invest in more in carbon-efficient companies that are less exposed to carbon costs than sector peers held in the Traditional funds.
“Seven of the eight
Responsible funds
outperformed their
Median Peer Group
over a three-year
period.”
The Responsible funds in the Large Cap Blend, Large Cap Growth and Mid Cap Blend categories tend to have smaller carbon footprints than the Traditional funds, while also outperforming (see Chart 1). For instance, the four Responsible funds in the Large Cap Blend category have a 9% smaller average carbon footprint than the four Traditional funds. Their average alpha rank is 17% compared to 47% for the Traditional funds.
0 50 100 150 200 250 300 350 400 450 500
Large Cap Blend Large Cap Growth Mid Cap Blend
Carbon footprint (metric tons CO 2 e/US$mn Revenue) Alpha ALPHA 9 10 8 7 6 5 4 3 2 1 0 CARBON FOO TPRINT (METRIC T ONS CO 2 E/US$ MN REVENUE) Traditional Responsible Traditional Responsible
Carbon footprint Alpha Chart 1:
Carbon footprint and alpha across fund styles11
Source: Trucost Plc
Alpha (3-year period) – A measure of the difference between a fund’s actual returns and its expected performance, given its level of risk as measured by beta. A positive alpha figure indicates the fund has performed better than its beta (or expected return) would predict. In contrast, a negative alpha indicates the fund underperformed, given the expectations established by the fund’s beta. All Modern Portfolio Theory statistics (alpha, beta, and R-squared) are based on a least-squared regression of the fund’s return over Treasury bills (called excess return) and the excess returns of the fund’s benchmark index.11
Other key findings include:
• The two Responsible funds in the Large Cap Growth category have a 64% smaller average carbon footprint than the two Traditional funds and an average alpha rank of 11%, compared to 48% for the Traditional funds
• The two Responsible funds in the Mid Cap Blend category have a 71% smaller average carbon footprint than the two Traditional funds and an average alpha rank of 9%, compared to 28% for the Traditional funds.
INdIvIduAl fuNd
CARbON fOOTPRINTS
In the Traditional group, the fidelity leverage Company Stock fund has the largest carbon footprint. This is mainly due to holdings in three carbon-intensive utilities companies which contribute 43% of the fund’s carbon footprint. Within the Responsible group, the Parnassus Equity Income has the largest carbon footprint, of which 44% is attributable to an investment in Waste Management Inc. Although many responsible funds focus on water or waste industries, which can be relatively carbon intensive, they can deliver other environmental benefits. Waste Management Inc. reports that in 2008, 49% of revenues were derived from “green” services: Recycling, energy production at landfills, waste collection for recycling or energy production, and waste reduction through consultancy services.113The davis Ny venture fund has the smallest carbon footprint of the Traditional group. This is largely due to the fund’s large allocations to low-carbon sectors such as Retail, financial Services, banks, Insurance and healthcare, which together equate to 55% of the value of holdings. The Calvert Social Investment Equity fund has the smallest carbon footprint of the Responsible group because it is predominantly invested in low-carbon sectors such as Retail, Technology, healthcare and financial Services. The carbon footprints of individual funds are shown in the Performance table in Appendix 1.
131 Waste Management Inc, Sustainability Report 2008
• The combined global emissions associated with the holdings in the 16 funds analyzed amount to over 100 million metric tons of greenhouse gases, measured in carbon dioxide equivalent (CO2e) emissions. This is equivalent to 1.4% of U.S. emissions of 6.96 billion metric tons of CO2e in 2008.1014 • For each million Dollars of revenue generated by companies in the combined universe of funds, 335 metric tons of CO2e are emitted. The carbon intensity of the combined funds is 9.3% lower than that of the S&P 500 Index.
• The carbon footprint of the Responsible funds is 46% smaller than that of the S&P 500. There appears to be a positive correlation between the carbon footprint of a fund and its alpha rank among selected funds analyzed, as shown in Chart 2. This suggests that companies with strong ESG performance and lower carbon intensity are outperforming. Some of this outperformance may be attributable to more efficient management of energy use, with knock-on effects on related carbon dioxide emissions, to manage exposure to volatile energy prices and future carbon costs.
0% 10% 20% 30% 40% 50% 60% 70% 80% 0 100 200 300 400 500 600 700 800
CARBON FOOTPRINT (METRIC TONS CO2E/US$ MN REVENUE)
ALPHA % RANK
Traditional Responsible
Chart 2:
Relationship between carbon footprints and alpha % rank10
Source: Trucost Plc
1410U.S. EPA (April 2010), Inventory of U.S. Greenhouse Gas Emissions and Sinks: 1990-2008
“A fund’s carbon
footprint appears to
be correlated to its
alpha rank.”
E
SG factors are now integrated into US$6.8 trillion of actively managed assets worldwide, according to the United Nations Principles for Responsible Investment.1115 With more capital now focused on sustainable business models that incorporate ESG issues into their decision-making and management strategies, the importance of understanding potential links between ESG issues, carbon footprints and fund returns is growing.This study shows tangible differences between the Traditional Group of funds and the Responsible Group of funds when assessed on risk and performance measures. In addition to the carbon intensity of companies, it is likely that intangible forces are contributing to the outperformance of Responsible funds analyzed. More robust corporate governance may also contribute to companies being more profitable. Companies that embrace corporate responsibility may be less likely to face costs that can negatively impact the bottom line, such as litigation, fines and other penalties. Companies with cultures that promote responsible stewardship and are perceived positively in the public domain may be more effective at building customer loyalty and attracting and retaining talent. Products that have positive social or environmental impacts such as fair trade, organic, or those free of genetically modified organisms, may also attract consumers concerned about the impacts of their purchases. In the long term, ESG factors are expected to have significant tail risk impacts on equity investments.
Findings support the hypothesis that traditional investment research combined with ESG research can help manage risk. The greater risk-adjusted performance, or alpha, for the Responsible Group provides further evidence that ESG integration affects risk. Investors are increasingly aware of risks and opportunities surrounding GHG emissions from public companies. As corporate carbon emissions become an important source of financial risk and opportunity at a fund level, institutional investors will expect fund managers to identify the carbon profiles of companies. Managing exposure to carbon risks in funds will form an integral part of investment management. The smaller carbon footprints of Responsible funds analyzed that actively integrate ESG factors into investment decisions, compared with traditionally managed funds, illustrate that ESG integration can have a measurable effect on reducing carbon risk. This analysis shows that assets can be allocated to ESG funds while maintaining financial performance, reducing risk, and lowering exposure to future carbon costs.
15 http://www.responsible-investor.com/home/article/un_pri_says_esg_now_integrated_at_68trn_of_assets_globally, accessed 1 October 2010
Mutual fund name (Ticker) Carbon footprint (tCO2e/ US$ million revenue) ESG rating
Total returns (% rank in peer group ) Risk Gross
expense ratio11
Inception date11
1-YR 3-YR 5-YR Since
inception11
Alpha11 Alpha %
rank10 Large Cap Blend
Davis NY Venture (NYVTX) 160 ESG-0 14.79 (26) -10.57 (64) -0.77 (44) 11.40 0.39 42 0.92 17/2/69
Neuberger Berman Socially Responsive (NBSRX)
161 ESG-4 19.71 (6) -8.12 (21) 1.41 (10) 7.50 1.62 23 0.93 16/3/94 Domini Social Equity (DSEFX) 246 ESG-4 16.81 (11) -9.29 (35) -1.02 (52) 6.83 1.45 25 1.31 3/6/91
American Funds Investment Company of America (AIVSX)
350 ESG-0 9.91 (85) -9.42 (38) -0.14 (30) 11.87 -1.03 68 0.66 2/1/34
TIAA-CREF Social Choice Equity (TRSCX) 364 ESG-4 17.53 (10) -8.22 (21) 0.12 (26) 5.52 2.24 17 0.49 1/10/02
Vanguard 500 Index (VFINX) 370 ESG-0 14.33 (32) -9.84 (47) -0.87 (47) 10.10 -0.04 49 0.18 31/8/76
Parnassus Equity Income (PRBLX) 379 ESG-4 13.51 (46) -1.89 (1) 4.43 (1) 9.20 6.49 1 1.00 1/9/92
American Funds Fundamental Investors (ANCFX)
397 ESG-0 12.78 (56) -8.79 (28) 2.18 (5) 11.77 1.37 27 0.69 1/8/78
Responsible Group Average 288 16.89 -6.88 1.24 2.95 17 0.93
Traditional Group Average 319 12.95 -9.66 0.10 0.17 47 0.61
Peer Group Median Mutual Fund/ETF10 13.17 -10.01 -0.98
Index: Russell 1000 15.24 -9.54 -0.56
Large Cap Growth
Calvert Social Investment Equity (CSIEX) 94 ESG-4 13.39 (37) -5.42 (16) 0.29 (37) 6.35 4.55 19 1.28 24/8/87
Parnassus (PARNX) 95 ESG-4 17.23 (10) -4.48 (9) 2.72 (8) 8.65 8.72 3 1.00 27/12/84
Fidelity Contrafund (FCNTX) 153 ESG-0 16.42 (14) -5.30 (14) 3.05 (6) 11.98 3.40 30 1.02 17/5/67
American Funds Growth Fund of America (AGTHX)
366 ESG-0 10.39 (68) -8.51 (57) 0.83 (27) 13.52 1.02 66 0.76 30/11/73
Responsible Group Average 95 15.31 -4.95 1.51 6.64 11 1.14
Traditional Group Average 260 13.41 -6.91 1.94 2.21 48 0.89
Peer Group Median Mutual Fund/ETF10 12.00 -8.10 -0.35
Index: Russell 1000 Growth 13.62 -6.91 0.38
Mid Cap Blend
Ariel Appreciation (CAAPX) 109 ESG-3 30.82 (10) -7.35 (37) -0.01 (58) 9.60 8.15 7 1.25 1/12/89
Ariel (ARGFX) 140 ESG-3 35.37 (2) -11.46 (77) -3.08 (91) 10.26 7.35 10 1.14 6/11/86
Fidelity Low-Priced Stock (FLPSX) 179 ESG-0 21.12 (55) -6.44 (26) 2.28 (17) 13.67 5.28 33 0.99 27/12/89
Fidelity Leveraged Company Stock (FLVCX) 678 ESG-0 24.73 (21) -12.27 (85) 1.04 (45) 11.40 5.97 22 0.92 19/12/00
Responsible Group Average 125 33.10 -9.41 -1.55 7.75 9 1.20
Traditional Group Average 429 22.93 -9.36 1.66 5.63 28 0.96
Peer Group Median Mutual Fund/ETF10 21.63 -8.60 0.56
Index: S&P MidCap 400 24.93 -5.90 2.21
The performance data quoted represent past performance and the principal value and investment return will fluctuate so that an investor’s shares, when redeemed, may be worth more or less than their original cost. Returns shown, unless otherwise indicated, are total returns, with dividends and income invested. Past performance is no guarantee of future results.
An investor should consider objectives, risks, charges and expenses of the investment company carefully before investing. The
prospectus contains this and other information about the investment company. Please contact your financial professional to
Trucost Plc 22 Chancery Lane London WC2A 1LS United Kingdom uK & international: +44 (0) 20 7160 9800 north america: +1 800 402 8774 [email protected] RLP Capital, Inc. 275 Madison Avenue 32nd Floor New York, NY 10016 Bud sturmak: +1 212 573 0400 [email protected]
For performance data current to the most recent month-end, please contact the investment company using the numbers provided below: American Funds 800-421-0180 Ariel 800-292-7435 Calvert 800-368-2748 Davis Funds 800-279-0279 Domini 800-582-6757 Fidelity Investments 800-544-9797 Neuberger Berman 800-877-9700 Parnassus 800-999-3505 TIAA-CREF 800-223-1200 Vanguard 800-662-7447