Linguistic Profiling for Author Recognition and Verification
Hans van Halteren
Language and Speech, Univ. of Nijmegen P.O. Box 9103
NL-6500 HD, Nijmegen, The Netherlands
[email protected]
Abstract
A new technique is introduced, linguistic profiling, in which large numbers of counts of linguistic features are used as a text profile, which can then be compared to average profiles for groups of texts. The technique proves to be quite effective for authorship verification and recogni-tion. The best parameter settings yield a False Accept Rate of 8.1% at a False Re-ject Rate equal to zero for the verification task on a test corpus of student essays, and a 99.4% 2-way recognition accuracy on the same corpus.
1
Introduction
There are several situations in language research or language engineering where we are in need of a specific type of extra-linguistic information about a text (document) and we would like to determine this information on the basis of lin-guistic properties of the text. Examples are the determination of the language variety or genre of a text, or a classification for document routing or information retrieval. For each of these applica-tions, techniques have been developed focusing on specific aspects of the text, often based on frequency counts of functions words in linguis-tics and of content words in language engineer-ing.
In the technique we are introducing in this paper, linguistic profiling, we make no a priori choice for a specific type of word (or more complex fea-ture) to be counted. Instead, all possible features are included and it is determined by the statistics for the texts under consideration, and the distinc-tion to be made, how much weight, if any, each
feature is to receive. Furthermore, the frequency counts are not used as absolute values, but rather as deviations from a norm, which is again deter-mined by the situation at hand. Our hypothesis is that this technique can bring a useful contribution to all tasks where it is necessary to distinguish one group of texts from another. In this paper the technique is tested for one specific type of group, namely the group of texts written by the same author.
2
Tasks and Application Scenarios
Traditionally, work on the attribution of a text to an author is done in one of two environments. The first is that of literary and/or historical re-search where attribution is sought for a work of unknown origin (e.g. Mosteller & Wallace, 1984; Holmes, 1998). As secondary information gener-ally identifies potential authors, the task is au-thorship recognition: selection of one author from a set of known authors. Then there is forensic linguistics, where it needs to be determined if a suspect did or did not write a specific, probably incriminating, text (e.g. Broeders, 2001; Chaski, 2001). Here the task is authorship verification: confirming or denying authorship by a single known author. We would like to focus on a third environment, viz. that of the handling of large numbers of student essays.
essay himself, which is only easy to spot if the original is also submitted by the original author.
In both scenarios, the test material will be siz-able, possibly around a thousand words, and at least several hundred. Training material can be sufficiently available as well, as long as text col-lection for each student is started early enough. Many other authorship verification scenarios do not have the luxury of such long stretches of test text. For now, however, we prefer to test the ba-sic viability of linguistic profiling on such longer stretches. Afterwards, further experiments can show how long the test texts need to be to reach an acceptable recognition/verification quality.
2.1
Quality MeasuresFor recognition, quality is best expressed as the percentage of correct choices when choosing be-tween N authors, where N generally depends on the attribution problem at hand. We will use the percentage of correct choices between two au-thors, in order to be able to compare with previ-ous work. For verification, quality is usually expressed in terms of erroneous decisions. When the system is asked to verify authorship for the actual author of a text and decides that the text was not written by that author, we speak of a False Reject. The False Reject Rate (FRR) is the percentage of cases in which this happens, the percentage being taken from the cases which should be accepted. Similarly, the False Accept Rate (FAR) is the percentage of cases where somebody who has not written the test text is ac-cepted as having written the text. With increasing threshold settings, FAR will go down, while FRR goes up. The behaviour of a system can be shown by one of several types of FAR/FRR curve, such as the Receiver Operating Characteristic (ROC). Alternatively, if a single number is preferred, a popular measure is the Equal Error Rate (EER), viz. the threshold value where FAR is equal to FRR. However, the EER may be misleading, since it does not take into account the conse-quences of the two types of errors. Given the ex-ample application, plagiarism detection, we do not want to reject, i.e. accuse someone of plagia-rism, unless we are sure. So we would like to measure the quality of the system with the False Accept Rate at the threshold at which the False Reject Rate becomes zero.
2.2
The Test CorpusBefore using linguistic profiling for any real task, we should test the technique on a benchmark corpus. The first component of the Dutch Au-thorship Benchmark Corpus (ABC-NL1) appears to be almost ideal for this purpose. It contains widely divergent written texts produced by first-year and fourth-first-year students of Dutch at the University of Nijmegen. The ABC-NL1 consists of 72 Dutch texts by 8 authors, controlled for age and educational level of the authors, and for reg-ister, genre and topic of the texts. It is assumed that the authors’ language skills were advanced, but their writing styles were as yet at only weakly developed and hence very similar, unlike those in literary attribution problems.
Each author was asked to write nine texts of about a page and a half. In the end, it turned out that some authors were more productive than others, and that the text lengths varied from 628 to 1342 words. The authors did not know that the texts were to be used for authorship attribution studies, but instead assumed that their writing skill was measured. The topics for the nine texts were fixed, so that each author produced three argumentative non-fiction texts, on the television program Big Brother, the unification of Europe and smoking, three descriptive non-fiction texts, about soccer, the (then) upcoming new millen-nium and the most recent book they read, and three fiction texts, namely a fairy tale about Little Red Riding Hood, a murder story at the univer-sity and a chivalry romance.
Distribution Voting (WPDV) modeling on the basis of a very large number of features achieves 97.8% correct attributions (van Halteren et al., To Appear). Although designed to produce a hard recognition task, the latter result show that very high recognition quality is feasible. Still, this ap-pears to be a good test corpus to examine the ef-fectiveness of a new technique.
3
Linguistic Profiling
In linguistic profiling, the occurrences in a text are counted of a large number of linguistic fea-tures, either individual items or combinations of items. These counts are then normalized for text length and it is determined how much (i.e. how many standard deviations) they differ from the mean observed in a profile reference corpus. For the authorship task, the profile reference corpus consists of the collection of all attributed and non-attributed texts, i.e. the entire ABC-NL1 corpus. For each text, the deviation scores are combined into a profile vector, on which a vari-ety of distance measures can be used to position the text in relation to any group of other texts.
3.1
FeaturesMany types of linguistic features can be profiled, such as features referring to vocabulary, lexical patterns, syntax, semantics, pragmatics, informa-tion content or item distribuinforma-tion through a text. However, we decided to restrict the current ex-periments to a few simpler types of features to demonstrate the overall techniques and method-ology for profiling before including every possi-ble type of feature. In this paper, we first show the results for lexical features and continue with syntactic features, since these are the easiest ones to extract automatically for these texts. Other features will be the subject of further research.
3.2
Authorship Score CalculationIn the problem at hand, the system has to decide if an unattributed text is written by a specific author, on the basis of attributed texts by that and other authors. We test our system’s ability to make this distinction by means of a 9-fold cross-validation experiment. In each set of runs of the system, the training data consists of attributed texts for eight of the nine essay topics. The test data consists of the unattributed texts for the
ninth essay topic. This means that for all runs, the test data is not included in the training data and is about a different topic than what is present in the training material. During each run within a set, the system only receives information about whether each training text is written by one spe-cific author. All other texts are only marked as “not by this author”.
3.3
Raw ScoreThe system first builds a profile to represent text written by the author in question. This is simply the featurewise average of the profile vectors of all text samples marked as being written by the author in question. The system then determines a raw score for all text samples in the list. Rather than using the normal distance measure, we opted for a non-symmetric measure which is a weighted combination of two factors: a) the dif-ference between sample score and author score for each feature and b) the sample score by itself. This makes it possible to assign more importance to features whose count deviates significantly from the norm. The following distance formula is used:
∆T = (Σ |Ti–Ai| D |Ti| S) 1/(D+S)
In this formula, Ti and Ai are the values for the ith feature for the text sample profile and the author profile respectively, and D and S are the weight-ing factors that can be used to assign more or less importance to the two factors described. We will see below how the effectiveness of the measure varies with their setting. The distance measure is then transformed into a score by the formula
ScoreT = (Σ |Ti|(D+S)) 1/(D+S) – ∆T In this way, the score will grow with the similar-ity between text sample profile and author pro-file. Also, the first component serves as a correction factor for the length of the text sample profile vector.
3.4
Normalization and Renormalizationsamples marked as not being written by the au-thor in question.
In the experiments described in this paper, a rather special condition holds. In all tests, we know that the eight test samples are comparable in that they address the same topic, and that the author to be verified produced exactly one of the eight test samples. Under these circumstances, we should expect one sample to score higher than the others in each run, and we can profit from this knowledge by performing a renormalization, viz. to the number of standard deviations the score differs from the mean of the scores of the unattributed samples. However, this renormaliza-tion only makes sense in the situarenormaliza-tion that we have a fixed set of authors who each produced one text for each topic. This is in fact yet a dif-ferent task than those mentioned above, say au-thorship sorting. Therefore, we will report on the results with renormalization, but only as addi-tional information. The main description of the results will focus on the normalized scores.
4
Profiling with Lexical Features
The most straightforward features that can be used are simply combinations of tokens in the text.
4.1
Lexical featuresSufficiently frequent tokens, i.e. those that were observed at least a certain amount of times (in this case 5) in some language reference corpus (in this case the Eindhoven corpus; uit den Boogaart, 1975) are used as features by them-selves. For less frequent tokens we determine a token pattern consisting of the sequence of char-acter types, e.g., the token “Uefa-cup” is repre-sented by the pattern “#L#6+/CL-L”, where the first “L” indicates low frequency, 6+ the size bracket, and the sequence “CL-L” a capital letter followed by one or more lower case letters fol-lowed by a hyphen and again one or more lower case letters. For lower case words, the final three letters of the word are included too, e.g. “waar-maken” leads to “#L#6+/L/ken”. These patterns have been originally designed for English and Dutch and will probably have to be extended when other languages are being handled.
In addition to the form of the token, we also use the potential syntactic usage of the token as a feature. We apply the first few modules of a morphosyntactic tagger (in this case Wotan-Lite; Van Halteren et al., 2001) to the text, which de-termine which word class tags could apply to each token. For known words, the tags are taken from a lexicon; for unknown words, they are es-timated on the basis of the word patterns de-scribed above. The three (if present) most likely tags are combined into a feature, e.g. “niet” leads to “#H#Adv(stell,onverv)-N(ev,neut)” and “waarmaken” to “#L#V(inf)-N(mv,neut)-V(verldw, onverv)”. Note that the most likely tags are determined on the basis of the token it-self and that the context is not consulted. The modules of the tagger which do context depend-ent disambiguation are not applied.
Op top of the individual token and tag features we use all possible bi- and trigrams which can be built with them, e.g. the token combination “kon niet waarmaken” leads to features such as “wcw=#H#kon#H#Adv(stell,onverv)-N(ev,neut) #L#6+/L/ken”. Since the number of features quickly grows too high for efficient processing, we filter the set of features by demanding that a feature occurs in a set minimum number of texts in the profile reference corpus (in this case two). A feature which is filtered out instead contributes to a rest category feature, e.g. the feature above would contribute to “wcw=<OTHER>”. For the current corpus, this filtering leads to a feature set of about 100K features.
The lexical features currently also include fea-tures for utterance length. Each utterance leads to two such features, viz. the exact length (e.g. “len=15”) and the length bracket (e.g. “len=10-19”).
4.2
Results with lexical featuresThe most promising area is the ridge along the trough at D=0.0, S=0.0. A closer investigation of this area shows that the best settings are D=0.575 and S=0.15. The FAR FRR=0 score here is 14.9%, i.e. there is a threshold setting such that if all texts by the authors themselves are accepted, only 14.9% of texts by other authors are falsely accepted.
The very low value for S is surprising. It indi-cates that it is undesirable to give too much atten-tion to features which deviate much in the sample being measured; still, in the area in question, the score does peak at a positive S value, indicating that some such weighting does have effect. Suc-cessful low scores for S can also be seen in the hill leading around D=1.0, S=0.3, which peaks at an FAR FRR=0 score of around 17 percent. From the shape of the surface it would seem that an investigation of the area across the S=0.0 divide might still be worthwhile, which is in contradic-tion with the initial finding that negative values produce no useful results.
5
Beyond Lexical Features
As stated above, once the basic viability of the technique was confirmed, more types of features would be added. As yet, this is limited to syntac-tic features. We will first describe the system quality using only syntactic features, and then describe the results when using lexical and syn-tactic features in combination.
5.1
Syntactic FeaturesWe used the Amazon parser to derive syntactic constituent analyses of each utterance (Coppen, 2003). We did not use the full rewrites, but rather constituent N-grams. The N-grams used were:
• left hand side label, examining constituent occurrence
• left hand side label plus one label from the right hand side, examining dominance
• left hand side plus label two labels from the right hand side, in their actual order, examining dominance and linear prece-dence
For each label, two representations are used. The first is only the syntactic constituent label, the second is the constituent label plus the head word. This is done for each part of the N-grams independently, leading to 2, 4 and 8 features re-spectively for the three types of N-gram. Fur-thermore, each feature is used once by itself, once with an additional marking for the depth of the rewrite in the analysis tree, once with an addi-tional marking for the length of the rewrite, and once with both these markings. This means an-other multiplication factor of four for a total of 8, 16 and 32 features respectively. After filtering for minimum number of observations, again at least an observation in two different texts, there are about 900K active syntactic features, nine times as many as for the lexical features.
Investigation of the results for various settings has not been as exhaustive as for the lexical fea-tures. The best settings so far, D=1.3, S=1.4, yield an FAR FRR=0 of 24.8%, much worse than the 14.9% seen for lexical features.
5.2
Combining Lexical and Syntactic Fea-turesFrom the FAR FRR=0 score, it would seem that syntactic features are not worth pursuing any
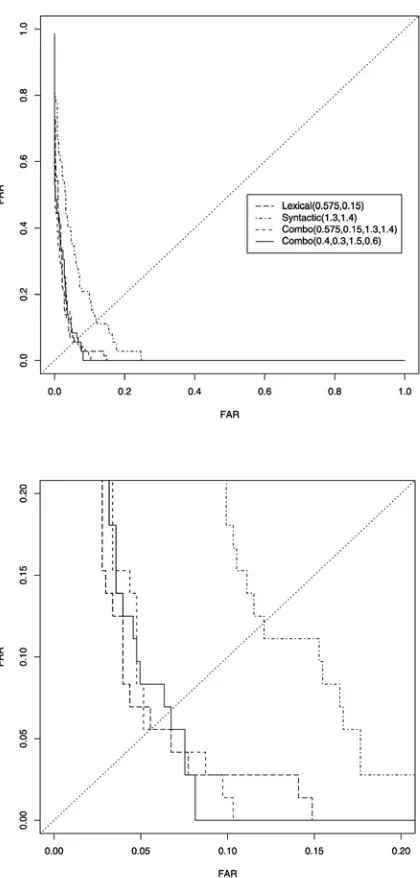
[image:5.595.361.528.119.288.2]ther, since they perform much worse than lexical ones. However, they might still be useful if we combine their scores with those for the lexical features. For now, rather than calculating new combined profiles, we just added the scores from the two individual systems. The combination of the best two individual systems leads to an FAR FRR=0 of 10.3%, a solid improvement over lexical features by themselves. However, the best indi-vidual systems are not necessarily the best com-biners. The best combination systems produce FAR FRR=0 measurements down to 8.1%, with settings in different parts of the parameter space.
It should be observed that the improvement gained by combination is linked to the chosen quality measure. If we examine the ROC-curves for several types of systems (plotting the FAR against the FRR; Figure 2), we see that the com-bination curves as a whole do not differ much from the lexical feature curve. In fact, the EER for the ‘best’ combination system is worse than that for the best lexical feature system. This means that we should be very much aware of the relative importance of FAR and FRR in any spe-cific application when determining the ‘optimal’ features and parameters.
6
Parameter Settings
A weak point in the system so far is that there is no automatic parameter selection. The best re-sults reported above are the ones at optimal set-tings. One would hope that optimal settings on training/tuning data will remain good settings for new data. Further experiments on other data will have to shed more light on this. Another choice which cannot yet be made automatically is that of a threshold. So far, the presentation in this paper has been based on a single threshold for all au-thor/text combinations. That there is an enormous potential for improvement can be shown by as-suming a few more informed methods of thresh-old selection.
The first method uses the fact that, in our ex-periments, there are always one true and seven false authors. This means we can choose the threshold at some point below the highest of the eight scores. We can hold on to the single thresh-old strategy if we first renormalize, as described
[image:6.595.280.490.109.548.2]in Section 3.4, and then choose a single value to threshold the renormalized values against. The second method assumes that we will be able to find an optimal threshold for each individual run of the system. The maximum effect of this can be estimated with an oracle providing the optimal threshold. Basically, since the oracle threshold will be at the score for the text by the author, we
are examining how many texts by other authors score better than the text by the actual author.
Table 1 compares the results for the best settings for these two new scenarios with the results pre-sented above. Renormalizing already greatly im-proves the results. Interestingly, in this scenario, the syntactic features outperform the lexical ones, something which certainly merits closer investi-gation after the parameter spaces have been charted more extensively. The full potential of profiling becomes clear in the Oracle threshold scenario, which shows extremely good scores. Still, this potential will yet have to be realized by finding the right automatic threshold determina-tion mechanism.
7
Comparison to Previous Authorship
Attribution Work
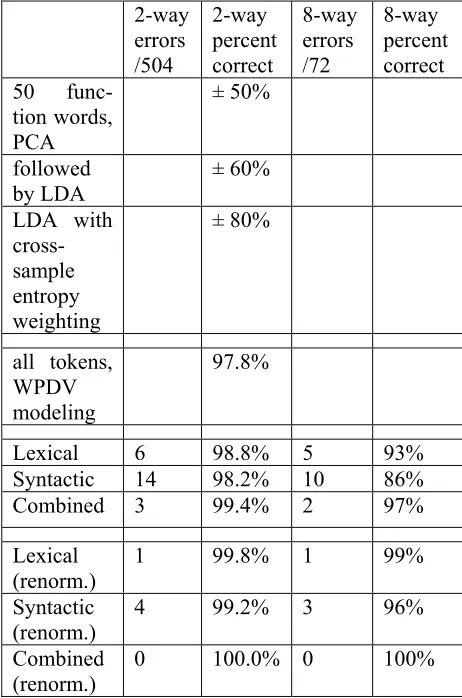
Above, we focused on the authorship verification task, since it is the harder problem, given that the potential group of authors is unknown. However, as mentioned in Section 2, previous work with this data has focused on the authorship recogni-tion problem, to be exact on selecting the correct author out of two potential authors. We repeat the previously published results in Table 2, together with linguistic profiling scores, both for the 2-way and for the 8-2-way selection problem.
To do attribution with linguistic profiling, we calculated the author scores for each author from the set for a given text, and then selected the au-thor with the highest score. The results are shown
in Table 2, using lexical or syntactic features or both, and with and without renormalization. The Oracle scenario is not applicable as we are com-paring rather than thresholding.
In each case, the best results are not just found at a single parameter setting, but rather over a larger area in the parameter space. This means that the choice of optimal parameters will be more robust with regard to changes in authors and text types. We also observe that the optimal settings for rec-ognition are very different from those for verifi-cation. A more detailed examination of the results is necessary to draw conclusions about these differences, which is again not possible until the parameter spaces have been charted more exhaustively.
Lexical Features
Syntactic Features
Com- bina-tion Single
threshold
14.9% 24.8% 8.1%
Single threshold after renormalization
9.3% 6.0% 2.4%
Oracle thresh-old per run
[image:7.595.97.316.105.243.2]0.8% 1.6% 0.2%
Table 1: Best FAR FRR=0 scores for verification with
various feature types and threshold selection mecha-nisms.
2-way errors
/504
2-way percent correct
8-way errors /72
8-way percent correct 50
func-tion words, PCA
± 50%
followed by LDA
± 60%
LDA with cross-sample entropy weighting
± 80%
all tokens, WPDV modeling
97.8%
Lexical 6 98.8% 5 93%
Syntactic 14 98.2% 10 86%
Combined 3 99.4% 2 97%
Lexical (renorm.)
1 99.8% 1 99%
Syntactic (renorm.)
4 99.2% 3 96%
Combined (renorm.)
[image:7.595.329.560.107.456.2]0 100.0% 0 100%
All results with normalized scores are already better than the previously published results. When applying renormalization, which might be claimed to be justified in this particular author-ship attribution problem, the combination system reaches the incredible level of making no mis-takes at all.
8
Conclusion
Linguistic profiling has certainly shown its worth for authorship recognition and verification. At the best settings found so far, a profiling system using combination of lexical and syntactic fea-tures is able select the correct author for 97% of the texts in the test corpus. It is also able to per-form the verification task in such a way that it rejects no texts that should be accepted, while accepting only 8.1% of the texts that should be rejected. Using additional knowledge about the test corpus can improve this to 100% and 2.4%.
The next step in the investigation of linguistic profiling for this task should be a more exhaus-tive charting of the parameter space, and espe-cially the search for an automatic parameter selection procedure. Another avenue of future research is the inclusion of even more types of features. Here, however, it would be useful to define an even harder verification task, as the current system scores already very high and fur-ther improvements might be hard to measure. With the current corpus, the task might be made harder by limiting the size of the test texts.
Other corpora might also serve to provide more obstinate data, although it must be said that the current test corpus was already designed specifi-cally for this purpose. Use of further corpora will also help with parameter space charting, as they will show the similarities and/or differences in behaviour between data sets. Finally, with the right types of corpora, the worth of the technique for actual application scenarios could be investi-gated.
So there are several possible routes to further improvement. Still, the current quality of the sys-tem is already such that the syssys-tem could be ap-plied as is. Certainly for authorship recognition and verification, as we hope to show by our
par-ticipation in Patrick Juola’s Ad-hoc Authorship Attribution Contest (to be presented at ALLC/ACH 2004), for language verification (cf. van Halteren and Oostdijk, 2004), and possibly also for other text classification tasks, such as language or language variety recognition, genre recognition, or document classification for IR purposes.
References
Harald Baayen, Hans van Halteren, Anneke Neijt, and Fiona Tweedie. 2002. An Experiment in Author-ship Attribution. Proc. JADT 2002, pp. 69-75. Ton Broeders. 2001. Forensic Speech and Audio
Analysis, Forensic Linguistics 1998-2001 – A Re-view. Proc. 13th Interpol Forensic Science
Sympo-sium, Lyon, France.
C. Chaski. 2001. Empirical Evaluations of Language-Based Author Identification Techniques. Forensic Linguistics8(1): 1-65.
Peter Arno Coppen. 2003. Rejuvenating the Amazon parser. Poster presentation CLIN2003, Antwerp, Dec. 19, 2003.
David Holmes. 1998. Authorship attribution. Literary and Linguistic Computing13(3):111-117.
F. Mosteller, and D.L. Wallace. 1984. Applied Bayes-ian and Classical Inference in the Case of the Fed-eralist Papers (2nd edition). Springer Verlag, New
York.
P. C. Uit den Boogaart. 1975. Woordfrequenties in geschreven en gesproken Nederlands. Oosthoek,
Scheltema & Holkema, Utrecht.
Hans van Halteren, Jakub Zavrel, and Walter Daele-mans. 2001. Improving accuracy in word class tag-ging through the combination of machine learning systems. Computational Linguistics27(2):199-230.
Hans van Halteren and Nelleke Oostdijk, 2004. Lin-guistic Profiling of Texts for the Purpose of Lan-guage Verification. Proc. COLING 2004.