Effects of Operating Parameters on Modification of Primary Mg
2Si Crystals
in Hypereutectic Mg-Si Alloy Treated by Imposition of Alternating Current
Jun Du
1;2;*and Kazuhiko Iwai
11
Department of Materials, Physics and Energy Engineering, Graduate School of Engineering, Nagoya University, Nagoya 464-8603, Japan 2School of Materials Science and Engineering, South China University of Technology, Guangzhou 510640, P. R. China
An alternating current (AC) was imposed upon the hypereutectic Mg-Si melt during solidification to modify the primary Mg2Si crystals in the fixed temperature range between 700 and 630C. The effects of current intensity and frequency have been investigated in the present study.
For every sample, 200 primary Mg2Si crystals were measured and 200 data were then statistically analyzed. The average size and standard deviation were used to evaluate the modification effect, including the refinement and uniformity of sizes of the modified primary Mg2Si crystals. The results show that both frequency and current intensity were significant to determine the modification effect. When the current intensity was fixed at 60 A, the average size increased and uniformity of sizes of the primary Mg2Si crystals improved with the increase in the frequency to 2 kHz. However, in the case that the frequency was fixed at 1 kHz, the statistical average size increased and uniformity of sizes improved with the increase in the current intensity to 60 A. With the further increase in the current intensity to 90 A, the statistical average size and uniformity of sizes had no obvious changes. The average size drastically decreased and uniformity of sizes remarkably improved with the increase in the estimated electromagnetic force to a critical value of about 126 Nm3, corresponding to the current intensity of 60 A and frequency of 1 kHz. However, the average size was constant if the electromagnetic force exceeded the critical value. [doi:10.2320/matertrans.MRA2008443]
(Received December 4, 2008; Accepted March 5, 2009; Published May 25, 2009)
Keywords: magnesium silicon alloys, primary Mg2Si crystal, alternating current imposition, microstructure refinement
1. Introduction
Elevated temperature creep resistance is a very important property for magnesium alloys because they were thought as a promising candidate to be used to produce automobile components, which always work at high temperatures, such
as engine blocks up to 200C and engine pistons up to
300C.1,2) Many investigations have been carried out to
improve the creep resistance of magnesium alloys and several new kinds of magnesium alloys have been developed
with higher creep resistance.2–8) Among these new alloys
with high temperature creep resistance, the hypereutectic Mg-Si alloys have high potential as structural materials for
elevated temperature applications.2) However, the
hyper-eutectic Mg-Si alloys prepared by ordinary ingot metallurgy process have very low ductility and strength due to the large
primary Mg2Si crystal size and the brittle eutectic phase.9)
Therefore, the refinement of the primary Mg2Si crystals is
very important to improve the mechanical properties of the hypereutectic Mg-Si alloys.
Some new advanced processing techniques such as hot
extrusion,10,11) rapid solidification12) and mechanical
alloy-ing13) have been applied to produce alloys with fine Mg
2Si crystals uniformly dispersed in Mg-matrix. Compared with these techniques, the ingot metallurgy process is a more practical method, because it is commercially available at low production cost and can be accepted by the engineering community for general applications. For the hypereutectic Mg-Si alloys prepared by ingot metallurgy process, their microstructures were traditionally refined by addition of
refiners, such as rare earth element of yttrium,14)compound
containing boron of KBF4.15)However, the material
compo-sitions become complex upon such additions, which makes the recycling of used materials difficult. Therefore, an
alternative method for the development of hypereutectic Mg-Si alloys with refining microstructures and high strength is desired.
Compared with the addition of refiners, the routes of the microstructures refinement caused by external energy fields have an excellent advantage of making no change to the
composition of the treated alloys.16–19) In particular, it has
long been established that the electromagnetic vibration (EMV) can effectively refine the microstructures for a large range of metals prepared by the ingot metallurgy proc-ess.20–28) For this route, the operating parameters of EMV were proved to be very important to determine the refining
efficiency, including vibrating frequency,22,23,25–27) current
density,24,26,27)magnetic flux density,26,27)imposition timing,
etc.24,28)
For example, Mizutani et al.22) found that the vibration
frequency near 1 kHz was most effective for the refinement of the primary silicon in the Al-17 mass%Si treated by EMV.
Sugiuraet al.24)found that there existed a threshold intensity
of the electrical current for the microstructure refinement of the Sn-10 mass%Pb caused by EMV. The refining effect could be obtained only when EMV was imposed in the initial
stage of the solidification. More recently, Liet al.27)reported
that the effects of the operating parameters of EMV on the solidification behavior of AZ31 alloy and the best refining efficiency could be obtained under the condition of the optimum operating parameters.
In a word, EMV process has been demonstrated to be effective in producing refining microstructures for a large range of alloys. Unfortunately, few works have been performed on the modification of the primary and eutectic
Mg2Si phase in the primary Mg-Si alloys by EMV. The
previous studies29,30) performed by the present authors
showed that the primary Mg2Si crystals in a hypereutectic
Mg-Si alloy could be effectively refined by a weak EMV which was induced in the melt by only imposing the
*Corresponding author, E-mail: [email protected]
alternating current (AC) of 60 A with high frequency of 1 kHz. The imposed temperature range of AC was proved to be a very significant factor to determine the size uniformity of
the modified primary Mg2Si crystals.30)In the present study,
AC with different current intensities and frequencies were imposed upon a hypereutectic Mg-Si melt in a constant temperature range, to investigate the effects of the operating
parameters on the modification of the primary Mg2Si
crystals.
2. Experimental Procedure
In the present study, the silicon content of the Mg-Si alloy used in this experiment was evaluated at approximately
4.8 mass%.29)Judged by the Mg-Si binary phase diagram,31)
the Mg-4.8 mass%Si alloy is a typical hypereutectic Mg-Si
alloy. For this Mg-Si alloy, the primary Mg2Si crystals begin
to precipitate at about 761C, and the Mg-Mg
2Si eutectic
structures form at about 638C.29)
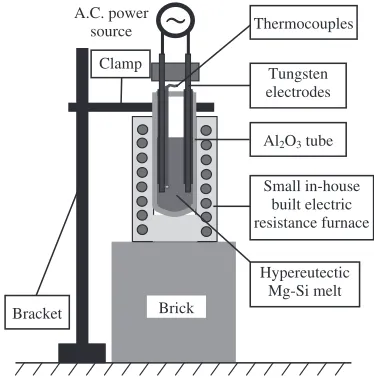
The preparation process of the samples treated by imposition of AC was simply depicted as following. The hypereutectic Mg-Si alloy of about 25 g was melt at
800C in a mild steel crucible using an electric resistance
furnace under a protective flux cover (45 mass%MgCl2,
35 mass%KCl, 5 mass%CaF2, 15 mass%NaCl). Then, the
melt was poured into an Al2O3 tube which was preheated
to 700C using a small in-house built electric resistance
furnace. This Al2O3 tube was supported with a clamp fixed
by a bracket in advance, as shown in Fig. 1. The size of the
Al2O3 tube is 21 mm in inner diameter, 25 mm in outer
diameter and 70 mm in height.
After the melt was poured into the Al2O3tube, a couple of
tungsten electrodes (3 mm in diameter) were inserted into the melt quickly. The distance between the two tungsten electrodes was 12 mm. The tungsten electrodes were covered
using Al2O3pipe with size of 3 mm in inner diameter, 5 mm
in outer diameter and 60 mm in height. The end part of the tungsten electrode with length of 5 mm was not covered to apply AC into the melt. The distance between the end of
tungsten electrodes and the bottom of the Al2O3 tube was
10 mm. A couple of K-type thermocouples was fixed on one
of the two tungsten electrodes and the temperature of the melt was recorded automatically using digital recorder (Keyence, GR-3500 type).
The small in-house built electric resistance furnace was turned off after the temperature of the melt decreased to about
770C. And then, the brick (as shown in Fig. 1) was moved
away and the small power self-made electric resistance furnace was pulled off. The hypereutectic Mg-Si melt filled
in the Al2O3 pipe was air-cooled. In the present study, all
samples were prepared by imposition of AC upon the hypereutectic Mg-Si melt in a constant temperature range
between 700 and 630C. For the Mg-4.8 mass%Si alloy, the
theoretical mass fractions of primary Mg2Si crystals were
about 6.1 and 9.9 mass% at 700C and eutectic temperature
of 638C, respectively.29) Two series of experiments were
designed and performed. One series was that the current was set as constant 60 A and five different frequencies, i.e., 0.05, 0.1, 0.5, 1 and 2 kHz were selected. The other series was that the frequency was kept as 1 kHz and five current intensities were selected, i.e., 20, 40, 60, 80 and 90 A. For comparison, a sample without AC imposition was prepared. Therefore, ten samples were prepared in the present study.
The cylindrical ingots were cut longitudinally along the middle line parallel to the electrodes. The samples for micro-structure observation were prepared using a standard
proce-dure with a final polishing with 0.05mmalumina suspension.
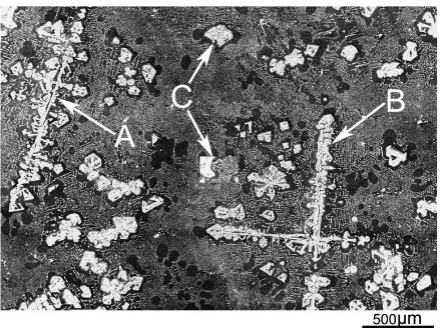
After that, the samples were etched with 3 vol%HF solution for 1 min. The etched samples were observed by a scanning electron microscope (SEM) (Keyence, VE-7800). The mid-dle area between the two tungsten electrodes was selected as SEM observation area, as shown in Fig. 2. The size of the
observed area was1515mm2.
To evaluate the modification effect of AC imposition, the
sizes of the primary Mg2Si crystals for all samples were
measured from the SEM pictures, using the longest length of
the primary trunk of the dendritic Mg2Si crystals. All Mg2Si
crystals present in one SEM image area were measured.
Mg2Si crystals from other SEM images were also measured
until 200 primary Mg2Si crystals were obtained for every
sample, and the 200 data were then analyzed using statistical methods. The average value and standard deviation were used to evaluate the effect of AC with different intensities and frequencies on the modification effect, including the refinement and uniformity of sizes of the modified primary
Mg2Si crystals.
A.C. power source
Hypereutectic Mg-Si melt Brick
Small in-house built electric resistance furnace Clamp
Al2O3 tube
Tungsten electrodes Thermocouples
Bracket
Fig. 1 Schematic view of the experimental apparatus.
Tungsten electrode
10 20
Al
2O
3tube
Observed
area 15
×
15
[image:2.595.348.505.67.210.2] [image:2.595.74.261.579.768.2]3. Results
3.1 SEM observations of the primary Mg2Si crystals
Figure 3 shows the SEM image of the hypereutectic Mg-Si alloy without AC imposition treatment. For this sample, it is
obvious that the primary Mg2Si crystals assume mainly the
complex dendritic morphologies, like the crystals denoted by
A and B. These two primary Mg2Si crystals assume the long
and coarse dendritic morphology with a unidirectional primary trunk and two perpendicular primary trunks,
respec-tively. In addition, the primary Mg2Si crystals with polygonal
morphologies can also be observed, like the crystal denoted by C.
Figure 4 shows the SEM images of the hypereutectic Mg-Si alloy treated by imposition of AC with a constant current intensity of 60 A and different frequencies. For the sample treated by imposition of AC with low frequency of 0.05 kHz,
many coarse and complex dendritic primary Mg2Si crystals
existed in this sample, as shown in Fig. 4(a). With the increase in the frequency to 0.1 kHz, the sizes of the primary
Mg2Si crystals were obviously refined and the number of the
coarse dendritic primary Mg2Si crystals decreased obviously.
Compared in the Figs. 4(b), 4(c) and 4(d), it could be found that these trends continued with the increase in the frequency
to 1 kHz. The coarse dendritic primary Mg2Si crystals could
hardly be found when the samples were treated by imposition of AC with high frequencies of 1 kHz and 2 KHz, as shown in Figs. 4(d) and 4(e).
Figure 5 shows the SEM images of the hypereutectic Mg-Si alloy treated by imposition of AC with a constant frequency of 1 kHz and different current intensities. To avoid repeating, the SEM image of the sample treated by imposition of AC with frequency of 1 kHz and current intensity of 60 A was omitted here, because it was shown in Fig. 4(d). Many coarse and complex dendritic primary
Mg2Si crystals could be observed in the sample treated by
imposition of AC with the frequency of 1 kHz and the low current intensity of 20 A, as shown in Fig. 5(a). Compared in the Figs. 5(a) and 5(b) as well as Fig. 4(d), it could also be
found that the sizes of the primary Mg2Si crystals were
obviously refined and the number of the coarse dendritic
primary Mg2Si crystals was decreased obviously with the
increase in the current intensity to 60 A. These trends were similar to the effect of frequency, as shown in the Figs. 4(b), 4(c) and 4(d). With the further increase in the current
intensity to 80 or 90 A, the coarse dendritic primary Mg2Si
crystals could also hardly be found in these two samples, as shown in Figs. 5(c) and 5(d).
3.2 Statistical analysis results of the sizes of the primary Mg2Si crystals
3.2.1 Statistical histograms
The statistical histograms of the sizes of 200 primary
Mg2Si crystals are shown in Figs. 6, 7 and 8 for all samples.
Moreover, the ratio of the number of coarse Mg2Si crystals
with sizes over than 400mm to the 200 primary Mg2Si
crystals measured for every sample is given in the figure,
which is denoted byR, i.e.R= (number of primary Mg2Si
crystlas over than 400mm)/200. However, it should be noted
that the obtained sizes of the Mg2Si crystals might be the
cross section of primary or secondary trunk of the coarse
dendritic Mg2Si crystals. The real sizes of dendritic Mg2Si
crystals should be measured in a three-dimensional space, but it is very difficult to carry out. Therefore, the effect of measurement method on the real sizes of primary crystals was omitted in the present study, but to aim at the relative change of primary crystals sizes after the AC imposition. (1) Statistical histogram of the sample without AC imposition
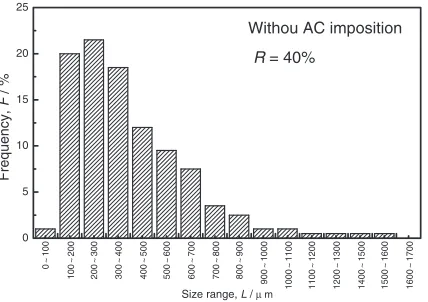
Figure 6 shows the statistical histogram of the sizes of
primary Mg2Si crystals in the hypereutectic Mg-Si alloy
without AC imposition. The size interval for counting in this
figure was 100mm. For this sample, the sizes of the primary
Mg2Si crystals distributed from 50 to 1600mm. The ratio of
the Mg2Si crystals with sizes over than 1000mmto the 200
crystals measured for this sample amounts to about 3%,
which implies there existed some very long and coarse Mg2Si
crystals with complex dendirtic morphologies (as shown in Fig. 3) in the hypereutectic Mg-Si alloy without AC imposition.
(2) Effect of frequency on statistical histograms
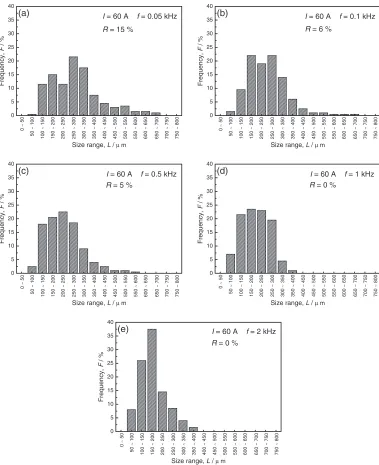
Figure 7 shows the statistical histograms of the sizes of
primary Mg2Si crystals in the hypereutectic Mg-Si alloy
treated by imposition of AC with a constant current of 60 A and different frequencies. The size intervals for counting in
these five figures were 50mm. When the frequency was
0.05 kHz, the sizes of the primary Mg2Si crystals in this
sample distributed from 50 to 700mm, as shown in Fig. 7(a).
The ratio R for this sample was about 15%. However, the
same ratioRfor the sample without AC imposition was about
40%, as shown in Fig. 6. With the increase in the frequency
to 0.1 kHz, the sizes of the primary Mg2Si crystals in this
sample also distributed from 50 to 700mm, as shown in
Fig. 7(b). However, the ratio Rfor this sample was further
decreased to 6%. When the frequency was increased to
0.5 kHz, the distribution range of the Mg2Si crystals sizes and
the ratio R had no obvious change, as shown in Fig. 7(c).
However, with the further increase in the frequency to 1 kHz,
the distribution range of the Mg2Si crystals sizes became
narrow and the sizes located in the range from 50 to 400mm,
as shown in Fig. 7(d). Also, the ratioRfor this sample was
further decreased to 0%, which implies that no obvious
[image:3.595.59.279.70.234.2]coarse dendritic Mg2Si crystals existed in this sample, as shown in Fig. 4(d). Compared with the histogram shown in
Fig. 7(d), the Mg2Si crystals sizes distributed in the same
range from 50 to 400mmalthough the frequency was further
increased from 1 to 2 kHz, as shown in Fig. 7(e). However, it
should be noted that the ratio of the Mg2Si crystals with sizes
in the range between 150 and 200mmwas much more than
that of the other samples.
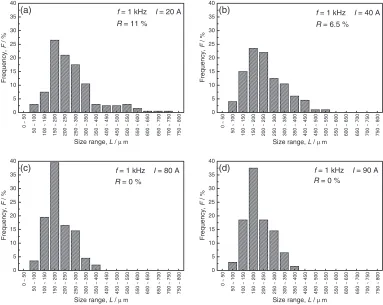
(3) Effect of current intensity on statistical histograms Figure 8 shows the statistical histograms of the sizes of
primary Mg2Si crystals in the hypereutectic Mg-Si alloy
treated by imposition of AC with a constant frequency of 1 kHz and different current intensities. The size intervals for
counting in these four figures were 50mm. To avoid
repeating, the statistical histogram of the sizes of primary
Mg2Si crystals in the sample treated by imposition of AC
with frequency of 1 kHz and current intensity of 60 A is omitted here, because it is the same with Fig. 7(d) obtained from the same processing condition.
When the current was 20 A, the sizes of the primary Mg2Si
crystals in this sample distributed from 50 to 750mm, as
shown in Fig. 8(a). Compared with the sample without AC
imposition, the ratio R for this sample was remarkably
decreased from about 40% to 11%. With the increase in the current intensity to 40 A, the sizes distribution of the primary
Mg2Si crystals became narrow and the sizes located in the
[image:4.595.72.521.68.580.2]range from 50 to 550mm, as shown in Fig. 8(b). Furthermore,
the ratio R for this sample was further decreased to 6.5%.
When the current intensities were 60 A, 80 A and 90 A, it
could be found that the distribution ranges of the Mg2Si
crystals sizes became narrower and the sizes located in the
range from 50 to 400mmfor these three samples. Also, the
ratiosRwere all further decreased to 0%, which implies no
obvious coarse dendritic Mg2Si crystals could be observed in
these three samples, as shown in Fig. 4(d), Figs. 5(c) and 5(d). Furthermore, for the two samples when the current
intensities were 80 A and 90 A, the ratios of the Mg2Si
crystals with sizes in the range between 150 and 200mmwere
much more than those of the other samples, as shown in Figs. 8(c) and 8(d).
3.2.2 Statistical average sizes and standard deviations Figure 9 shows the effect of frequency on the statistical average size and standard deviation for the samples treated by imposition of AC when the current was fixed at 60 A. The obtained data for every frequency were listed in this figure. For the sample without AC imposition, its statistical average
size and standard deviation were 403mm and 241mm,
respectively. For the sample treated by imposition of AC with intensity of 60 A and low frequency of 0.05 kHz, the statistical average size and standard deviation for this sample
were obviously decreased to 288mm and 122mm,
respec-tively. With the further increase in the frequency to 0.1 kHz, the statistical average size and standard deviation were
drastically decreased to 252mm and 102mm, respectively.
After that, the statistical average size and standard deviation were both slowly decreased with the increase in the frequency. When the frequency was 2 kHz, the statistical average size and standard deviation for this sample were
decreased to 176mm and 62mm, respectively. The low
standard deviation implies high uniformity of sizes of the
modified primary Mg2Si crystals. Therefore, it could be
known that the average sizes of the primary Mg2Si crystals
decreased, and meanwhile the uniformities of primary Mg2Si
crystals sizes improved with the increase in the frequency.
Fig. 5 SEM images of the hypereutectic Mg-Si alloy treated by imposition of AC with a constant frequency of 1 kHz and different current intensities of 20 (a), 40 (b), 80 (c) and 90 A (d).
0 5 10 15 20 25
R = 40%
1600
~
1700
Size range, L / µ m 1500
~
1600
1400
~
1500
1200
~
1300
1100
~
1200
1000
~
1100
900
~
1000
800
~
900
700
~
800
600
~
700
500
~
600
400
~
500
300
~
400
200
~
300
100
~
200
0
~
100
Frequency,
F
/ %
Withou AC imposition
[image:5.595.64.278.461.612.2]Figure 10 shows the effect of current intensity on the statistical average size and standard deviation for the samples treated by imposition of AC when the frequency was fixed at 1 kHz. Likewise, the obtained data were listed in this figure. Compared with the sample without AC imposition, the statis-tical average size and standard deviation were drasstatis-tically
decreased to 257mmand 118mmeven though the sample was
treated by imposition of AC with low intensity of 20 A. With the increase in the current intensity, the statistical average size and standard deviation were gradually decreased. When the current intensity was 60 A, the statistical average size and
standard deviation were decreased to 196mm and 68mm,
respectively. After that, the further increase in the current intensity had no obvious effect on the statistical average size and standard deviation. When the current intensity was increased to 90 A, the statistical average size and standard
deviation were 196mmand 63mm, respectively.
From the above results, it is known that the primary Mg2Si
crystals could be refined due to AC imposition upon the hypereutectic Mg-Si melt during solidification. The operating parameters of frequency and current intensity were both significant to determine the average size and uniformity of
sizes for the primary Mg2Si crystals when AC was imposed
in the fixed temperature range between 700 and 630C.
4. Discussion
In the present experimental conditions, the average cooling
rates from 760 to 640C were almost same for all samples
and were about 1.9C/s. The effect of cooling rate on the
microstructures for the hypereutectic Mg-Si alloys could be excluded in the present study. The details about the effect of AC imposition on the cooling rate were discussed in the
previous study.29) When the temperature was decreased to
0 5 10 15 20 25 30 35 40
R = 15 %
Size range, L / µ m Size range, L / µ m
Size range, L / µ m
(a)
100 ~ 150 150 ~ 200 200 ~ 250 250 ~ 300 300 ~ 350 350 ~ 400 400 ~ 450 450 ~ 500 500 ~ 550 550 ~ 600 600 ~ 650 650 ~ 700 700 ~ 750 750 ~ 800
0 ~ 50
50 ~ 100
I = 60 A f = 0.05 kHz
Frequency,
F
/ %
0 5 10 15 20 25 30 35 40
R = 6 %
(b) I = 60 A f = 0.1 kHz
Frequency,
F
/ %
0 5 10 15 20 25 30 35 40
R = 5 %
(c) I = 60 A f = 0.5 kHz
Frequency,
F
/ %
0 5 10 15 20 25 30 35 40
R = 0 %
(d) I = 60 A f = 1 kHz
Frequency,
F
/ %
0 5 10 15 20 25 30 35 40
R = 0 %
(e) I = 60 A f = 2 kHz
Frequency,
F
/ %
100 ~ 150 150 ~ 200 200 ~ 250 250 ~ 300 300 ~ 350 350 ~ 400 400 ~ 450 450 ~ 500 500 ~ 550 550 ~ 600 600 ~ 650 650 ~ 700 700 ~ 750 750 ~ 800
0 ~ 50
50 ~ 100
100 ~ 150 150 ~ 200 200 ~ 250 250 ~ 300 300 ~ 350 350 ~ 400 400 ~ 450 450 ~ 500 500 ~ 550 550 ~ 600 600 ~ 650 650 ~ 700 700 ~ 750 750 ~ 800
0 ~ 50
50 ~ 100
Size range, L / µ m
100 ~ 150 150 ~ 200 200 ~ 250 250 ~ 300 300 ~ 350 350 ~ 400 400 ~ 450 450 ~ 500 500 ~ 550 550 ~ 600 600 ~ 650 650 ~ 700 700 ~ 750 750 ~ 800
0 ~ 50
50 ~ 100
Size range, L / µ m
100 ~ 150 150 ~ 200 200 ~ 250 250 ~ 300 300 ~ 350 350 ~ 400 400 ~ 450 450 ~ 500 500 ~ 550 550 ~ 600 600 ~ 650 650 ~ 700 700 ~ 750 750 ~ 800
0 ~ 50
50 ~ 100
[image:6.595.108.487.71.536.2]less than the liquidus temperature of 761C, the primary
Mg2Si crystals began to nucleate and grow in the
hyper-eutectic Mg-Si melt used in the present study.29)Under the
present conditions, the primary Mg2Si crystals grow into
dendritic morphologies as dendritic growth manner, as shown in Fig. 3. The detailed discussions about the nucleation and
growth of the primary Mg2Si crystals had been carried out in
the previous study.29,30)
When an AC was imposed upon the hypereutectic Mg-Si melt, an alternating magnetic field with the same frequency
could be induced in the melt.32,33) Then, this alternating
magnetic field interacted with the electric current itself and
then an electromagnetic vibration was induced in the melt. The electromagnetic force acting on the sample could be
estimated. Firstly, the electrical current density, J in the
sample is estimated using the assumption that the cross-section through which a current passes includes the electro-magnetic skin layer of the melt between the electrodes.
J¼ I
ðhþ2ÞðDþ2Þ ½Am
2 ð1Þ
whereD is the diameter of the electrode,h is the depth of
insertion of the electrodes in the melt,I is the imposed AC
andis the electromagnetic skin layer defined as
0 5 10 15 20 25 30 35 40
R = 11 %
Size range, L / µ m
(a)
100 ~ 150 150 ~ 200 200 ~ 250 250 ~ 300 300 ~ 350 350 ~ 400 400 ~ 450 450 ~ 500 500 ~ 550 550 ~ 600 600 ~ 650 650 ~ 700 700 ~ 750 750 ~ 800
0 ~ 50
50 ~ 100
f = 1 kHz I = 20 A
Frequency,
F
/ %
0 5 10 15 20 25 30 35 40
R = 6.5 %
(b) f = 1 kHz I = 40 A
Frequency,
F
/ %
0 5 10 15 20 25 30 35 40
R = 0 %
(c) f = 1 kHz I = 80 A
Frequency,
F
/ %
0 5 10 15 20 25 30 35 40
R = 0 %
(d) f = 1 kHz I = 90 A
Frequency,
F
/ %
Size range, L / µ m
100 ~ 150 150 ~ 200 200 ~ 250 250 ~ 300 300 ~ 350 350 ~ 400 400 ~ 450 450 ~ 500 500 ~ 550 550 ~ 600 600 ~ 650 650 ~ 700 700 ~ 750 750 ~ 800
0 ~ 50
50 ~ 100
Size range, L / µ m
100 ~ 150 150 ~ 200 200 ~ 250 250 ~ 300 300 ~ 350 350 ~ 400 400 ~ 450 450 ~ 500 500 ~ 550 550 ~ 600 600 ~ 650 650 ~ 700 700 ~ 750 750 ~ 800
0 ~ 50
50 ~ 100
Size range, L / µ m
100 ~ 150 150 ~ 200 200 ~ 250 250 ~ 300 300 ~ 350 350 ~ 400 400 ~ 450 450 ~ 500 500 ~ 550 550 ~ 600 600 ~ 650 650 ~ 700 700 ~ 750 750 ~ 800
0 ~ 50
50 ~ 100
Fig. 8 Statistical histograms of the sizes of primary Mg2Si crystals in the hypereutectic Mg-Si alloy treated by imposition of AC with a constant frequency of 1 kHz and different current intensities of 20 (a), 40 (b), 80 (c) and 90 A (d).
[image:7.595.106.489.74.379.2]Fig. 9 Effect of frequency on the statistical average size and standard deviation for the 200 particle sizes measured in the hypereutectic Mg-Si alloy treated by imposition of AC with a constant current intensity of 60 A.
[image:7.595.64.277.433.571.2] [image:7.595.319.534.437.573.2]¼
ffiffiffiffiffiffiffiffiffiffiffiffi 2
0! s
½m ð2Þ
where 0 is the magnetic permeability, is the electrical
conductivity of the liquid phase and ! is the angular
frequency of AC. The calculated values of corresponding
to the frequencies of 0.05, 0.1, 0.5, 1 and 2 kHz were 37.8, 26.8, 11.8, 8.7 and 7.1 mm, respectively.
The electromagnetic forceF generated by the interaction
between the imposed AC and its induced magnetic filed Binduced can be estimated from Ampere’s law
F¼JBinduced ½Nm3 ð3Þ
where
Binduced¼
0I
2hþ2Dþ8 ð4Þ
However, it should be noticed that the real passing areas of current in the sample with the frequencies of 0.05 kHz, 0.1 kHz and 0.5 kHz were different from their corresponding
calculated areas of ðhþ2ÞðDþ2Þ. Therefore, the J and
Binduced could not be estimated by eqs. (1) and (4) for the frequencies of 0.05, 0.1 and 0.5 kHz. When the frequencies were 0.05 and 0.1 kHz, the real passing area of AC should the whole longitudinal section of the sample, which was about
2140mm2. Also, the real passing area of AC with the
frequency of 0.5 kHz should be21 ð10þhþÞmm2. The
JandBinduced should be estimated based on the real passing area of AC in the samples when the frequencies were 0.05, 0.1 and 0.5 kHz.
The magnitudes of the electromagnetic forces for all experimental conditions were theoretically estimated, which are shown in Fig. 11. Obviously, the electromagnetic forces are close related with the operating parameters, i.e. current intensity and frequency. The electromagnetic force was roughly proportional to the current intensity when the frequency was fixed at 1 kHz. However, as far as the effect of frequency was concerned, the electromagnetic forces were same when the frequencies were 0.05 and 0.1 kHz due to the same current passing area, i.e., the whole longitudinal section of the sample. After that, the electromagnetic force increased with the increase in the frequency.
When AC was imposed upon the melt, the electromagnetic force made the conductor to vibrate periodically, centering
on the equilibrium position according to its initial boundary condition. The experimental results showed that the primary
Mg2Si crystals could be modified by the weak EMV induced
by AC imposition. The modification effect of the primary
Mg2Si crystals had a close relation with the operating
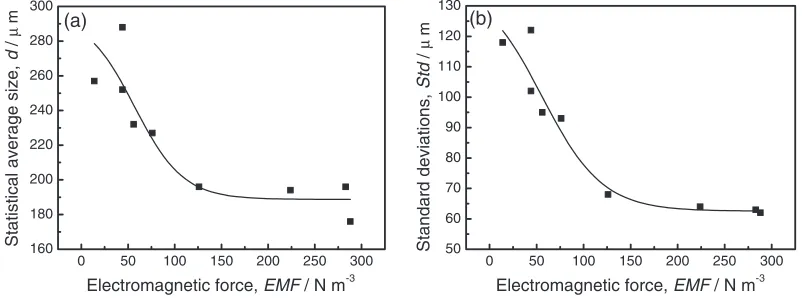
parameters. Therefore, the modification effect should have close relation with the theoretical electromagnetic force since its magnitude was determined by the operating parameters, as shown in Fig. 11. Figure 12 shows the influence of the theoretical electromagnetic force on the average size and
standard deviation of the primary Mg2Si crystals. When the
electromagnetic force was less than a critical value of about
126 Nm3corresponding to the current intensity of 60 A and
frequency of 1 kHz, the statistical average size and the standard deviation drastically decreased with the increase in the electromagnetic force. However, the average size of the
primary Mg2Si crystals was constant when the
electro-magnetic force exceeded the critical value of 126 Nm3.
Therefore, both the increase in the current intensity and frequency are useful ways to decrease the size of primary
Mg2Si under the critical condition in the present
experimen-tal condition.
When EMV is imposed upon the melt with a mushy zone, it was widely accepted that EMV contributes the fracture of the primary dendritic crystals resulting in the refinement of
the solidified structure.21,27,28,33)In the present study, the AC
was begun to apply into the Mg-4.8 mass%Si melt containing
about 6.1 mass% of primary Mg2Si crystals at 700C.29)The
fragmentation of the primary Mg2Si crystals caused by EMV
was possibly responsible for the refinement caused by AC imposition, which has been discussed in the authors’ previous
studies.29,30) The coarse Mg
2Si crystals with complex
dendritic morphologies should be broken at some weak parts caused by EMV. For the dendritic crystals, the weak parts should be the root regions where secondary dendrites grow from primary trunk of dendrites or tertiary dendrites grow
from the trunk of secondary dendrites.34) These weak root
regions were named as ‘‘shrinkage neck’’.34)
After AC was imposed upon the hypereutectic melts
containing primary Mg2Si crystals, some coarse Mg2Si
crystals with complex dendritic morphology could be broken from the parts of ‘‘shrinkage necks’’ by the induced EMV into small crystals with polygonal morphology. As a result, the
average size of the primary Mg2Si crystals could be
decreas-0.0 0.5 1.0 1.5 2.0
0 50 100 150 200 250
300 (a)Current intensity I = 60 A, constant
Electromagnetic force,
EMF
/ Nm
-3
Frequency, f / kHz
10 20 30 40 50 60 70 80 90 100
0 50 100 150 200 250
300 (b) Frequency f = 1 kHz, constant
Electromagnetic force,
EMF
/ Nm
-3
[image:8.595.100.497.73.219.2]Current intensity, I / A
ed after the hypereutectic Mg-Si melt treated by imposition of AC. These small crystals with polygonal morphology could not be further broken by the weak EMV because no obvious weak parts existed in these crystals. Therefore, no obvious changes of the average size and standard deviation could be found with the increase in the
electro-magnetic force to exceed about 126 Nm3, corresponded to
the current intensity of 60 A and frequency of 1 kHz.
Moreover, it should be noted that some new primary Mg2Si
crystals should nucleate and grow after the AC was applied
into the hypereutectic Mg-4.8 mass%Si melt from 700C.
These new primary Mg2Si crystals should grow into small
particles with polygonal morphology due to no enough time to grow into coarse dendritic crystals before eutectic reaction
occurs.29) It is possible that these small primary Mg
2Si crystals were smaller than those broken from coarse dendritic crystals by the EMF.
However, it should be noted that the average size of the
primary Mg2Si crystals was remarkably refined from 288 to
252mm with the increase in the frequency from 0.05 to
0.1 kHz even though the estimated EMFs were almost same
for these two frequencies. Modification of the primary Mg2Si
crystals should depend not only on intensity of the EMF but also on fluid motion and so on. Velocity distribution in
the Al2O3 tube crucible depends on the frequency,26) and
0.05 kHz might be too low to induce the fluid motion. This might be one of the reasons why the grain sizes changed between 0.05 kHz and 0.1 kHz even though the EMF was the similar intensity. Further study should be needed about the
effect of frequency on the modification of the primary Mg2Si
crystals.
5. Conclusions
(1) The primary Mg2Si crystals could be effectively refined
for the hypereutectic Mg-Si melt during solidification by imposition of AC. The operating parameters of frequency and current intensity were both significant to determine the average size and uniformity of sizes for
the primary Mg2Si crystals.
(2) When the current intensity was fixed at 60 A, the statistical average size increased and uniformity of sizes
for the primary Mg2Si crystals improved with the
increase in the frequency to 2 kHz. However, in the case
that the frequency was fixed at 1 kHz, the statistical average size increased and uniformity of sizes im-proved with the increase in the current intensity to 60 A. With the further increase in the current intensity to 90 A, the statistical average size and uniformity of sizes had no obvious changes.
(3) The average size of the modified primary Mg2Si
crystals drastically decreased with the increase in the estimated electromagnetic force to a critical value of
about 126 Nm3corresponding to the current intensity
of 60 A and frequency of 1 kHz. However, the average size was constant if the electromagnetic force exceeded the critical value.
Acknowledgement
This work was partially supported by JSPS Asian Core Program ‘‘Construction of the World Center on Electro-magnetic Processing of Materials’’, and Natural Science Foundation of Guangdong Province, China (Contract No. 05300139).
REFERENCES
1) B. L. Mordike and T. Ebert: Mater. Sci. Eng. A302(2001) 37–45. 2) A. A. Luo: Inter. Mater. Rev.49(2004) 13–30.
3) J. Bai, Y. S. Sun, S. Xun, F. Xue and T. B. Zhu: Mater. Sci. Eng. A 419(2006) 181–188.
4) K. J. Hirai, H. T. Somekawa, Y. N. Takigawa and K. J. Higashi: Mater. Sci. Eng. A403(2005) 276–280.
5) S. M. Zhu, M. A. Gibson, J. F. Nie, M. A. Easton and T. B. Abbott: Scr. Mater.586(2008) 477–480.
6) C. J. Boehlert: J. Mater. Sci.42(2007) 3675–3684. 7) P. Zhang: Scr. Mater.52(2005) 277–282.
8) D. J. Kang, S. S. Park, Y. S. Oh and N. J. Kim: Mater. Sci. Eng. A449– 451(2007) 318–321.
9) Y. C. Pan, X. F. Liu and H. Yang: Mater. Charact.55(2005) 241–247. 10) R. Tsuzuki, K. Kondoh, W. B. Du, T. Aizawa and E. Yuasa: Mater. Sci.
Forum419–422(2003) 789–794.
11) M. Mabuchi, K. Kubota and K. Higashi: J. Mater. Sci.31(1996) 1529– 1535.
12) M. Mabuchi, K. Kubota and K. Higashi: Scr. Metall. Mater.33(1995) 331–335.
13) L. Lu, K. K. Thong and M. Gupta: Comp. Sci. Tech.63(2003) 627– 632.
14) Q. C. Jiang, H. Y. Wang, Y. Wang, B. X. Ma and J. G. Wang: Mater. Sci. Eng. A392(2005) 130–135.
15) H. Y. Wang, Q. C. Jiang, B. X. Ma, Y. Wang, J. G. Wang and J. B. Li:
0 50 100 150 200 250 300
160 180 200 220 240 260 280 300
(a)
Statistical average size,
d
/
µ
m
Electromagnetic force, EMF / N m-3
0 50 100 150 200 250 300
50 60 70 80 90 100 110 120 130
(b)
Standard deviations,
Std
/
µ
m
[image:9.595.98.499.75.224.2]Electromagnetic force, EMF / N m-3
J. Alloy. Compd.387(2005) 105–108.
16) K. Yasuda, Y. Saiki, T. Kubo, M. Kuwabara and J. Yang: Jpn. J. Appl. Phys.46(2007) 4939–4944.
17) N. Abu-Dheir, M. Khraisheh, K. Saito and A. Male: Mater. Sci. Eng. A 393(2005) 109–117.
18) A. prodhan, C. S. Sivaramakrishnan and A. K. Chakrabarti: Metall. Mater. Trans.32B(2001) 372–378.
19) S. J. Guo, Q. C. Le, Y. Han, Z. H. Zhao and J. Z. Cui: Metall. Mater. Trans.37A(2006) 3715–3724.
20) C. Vive`s: Metall. Mater. Trans. B27(1996) 445–455. 21) C. Vive`s: Metall. Mater. Trans. B27(1996) 457–464.
22) Y. Mizutani, S. Kawai, K. Miwa, K. Yasue, T. Tamura and Y. Sakaguchi: Mater. Trans.45(2004) 1939–1943.
23) Y. Mizutani, Y. Ohura, K. Miwa, K. Yasue, T. Tamura and Y. Sakaguchi: Mater. Trans.45(2004) 1944–1948.
24) K. Sugiura and K. Iwai: ISIJ Inter.44(2004) 1410–1415.
25) Y. Mizutani, T. Tamura and K. Miwa: Mater. Sci. Eng. A413–414 (2005) 205–210.
26) M. Li, T. Tamura and K. Miwa: Acta Mater.55(2007) 4635–4643. 27) M. Li, T. Tamura and K. Miwa: ISIJ Int.48(2008) 320–329. 28) A. Radjai, K. Miwa and T. Nishio: Metall. Mater. Trans. A29(1998)
1477–1484.
29) J. Du and K. Iwai: Mater. Trans.50(2009) 562–569. 30) J. Du and K. Iwai: Mater. Trans.50(2009) 622–630.
31) T. B. Massalski, J. L. Murray, L. H. Bennett and H. Baker: Binary alloy phase diagrams. Metals Park, Ohio (American Society for Metals 1986) p. 1545.
32) T. Takaki, K. Iwai and S. Asai: ISIJ Int.43(2003) 842–848. 33) K. Sugiura and K. Iwai: ISIJ Int.45(2005) 962–966.