Munich Personal RePEc Archive
Long-run expectations in a
Learning-to-Forecast Experiment
Colasante, Annarita and Alfarano, Simone and
Camacho-Cuena, Eva and Gallegati, Mauro
University Jaume I, University Jaume I, University Jaume I,
Università Politecnica delle Marche
2016
Online at
https://mpra.ub.uni-muenchen.de/75621/
Long-run expectations
in a Learning-to-Forecast Experiment
Annarita Colasante1
University Jaume I
Simone Alfarano1
University Jaume I
Eva Camacho-Cuena1
University Jaume I
Mauro Gallegati2
Universit`a Politecnica delle Marche
Abstract
We conduct a Learning to Forecast Experiment (LtFE) using a novel setting in which we
elicit subjects’ short and long-run expectations on the future price of an asset. We find that:
(i) the rational expectations equilibrium (REE) is not a meaningful description for subjects’
expectations, (ii) which are, instead, better described by an adaptive learning scheme. (iii)
Subjects exhibit a higher degree of inertia when revising long-run expectationsvis-`a-vis short-run expectations.
JEL: D84, E37, G12
Keywords: Experiment, Expectations, Coordination
1. Introduction
Several contributions have stressed the importance of taking into account the whole time
spectrum of agents’ expectations when designing effective economic policies. In this respect, the
idea of forward guidance of the central bank [7] implies a continuous monitoring of short and
long-run inflation expectations of consumers and investors. The understanding of how economic
1
Avenida Sos Baynat s/n 12071 Castell´on, Spain
2
Piazzale Martelli, 8, Ancona, Italy
agents revise their short and long-run expectations, therefore, is a very active research area in
the empirical, theoretical and experimental literature.
In order to study the evolution of the whole spectrum of expectations, in this paper we
use controlled laboratory experiments, which have the advantage of a perfect monitoring of the
information available to the agents at any period of time. Few experimental papers have already
elicited long-run expectations within a market environment. [1] is the first attempt to elicit
long-run expectations in an asset market with bubbles. Focusing just on predictions with no
trading activity, LtFEs, introduced by [5], provide a simple and manageable laboratory setting
to study expectations formation. In LtFEs subjects submit (one step-ahead) predictions about
future values of economic variables, typically prices, which are endogenously determined as a
function of those predictions. Subjects are rewarded based on their forecast accuracy alone. The
empirical evidence of LtFEs with strong positive feedback between expectations and realized
market price shows a persistent coordination of short-run predictions, although not always on
the REE (see [3] for a review). Behavioral adaptive rules, instead, provide a better description
of the experimental results.
The aim of our paper is to incorporate into the LtFEs the elicitation of long-run expectations
in order to study the dynamics of the whole time spectrum of expectations. Such modification
will allow us to have a more comprehensive understanding of the agents’ expectations formation
mechanism.
2. Experimental design
In each of the 7 sessions of our LtFE, 6 subjects submit their predictions for the price of an
asset for 20 periods. At the beginning of periodt, subjectisubmits her short-run prediction for
the asset price at the end of periodt, denoted asipe
t,t, as well as her set of long-run predictions for
the price at the end of each of the 20−tremaining periods. Long-run predictions are denoted as
ipe
t,t+kwith 1< k≤20−t. When submitting their predictions, subjects are informed about: (i)
the constant interest rate (r) and average dividend (d), (ii) the asset prices until periodt−1, (iii) all their own (short and long-run) past predictions. However, they are not informed about the
predictions submitted by the other subjects and have just qualitative information on the price
generating mechanism: there is a positive relationship between their one-step ahead predictions
and the next realized price (see the instructions). To keep our setting simple, we explicitly exclude
long-run expectations from the price generating mechanism. We expect, therefore, the elicitation
contrary, we do expect an influence of price dynamics on the formation and evolution of subjects’
long-run expectations. In particular, we can study how price dynamics is incorporated in the
short and long-run expectations. Do short and long-run expectations follow the same pattern?
If subjects learn to coordinate their short-run expectations, as shown in the LtFEs literature,
how their long-run expectations behave? Do they converge to the asset fundamental price?
Following [2], the price generating mechanism is:
pt=pf+ 1 1 +r(¯p
e
t,t−pf) +ξt, (1)
where pf = dr is the asset fundamental value, which constitutes the REE. ¯pe t,t =
1 6
P6
i=1ipet,t
is the average of individual short-run predictions and ξt ∼N(0,0.25) is an iid Normal shock.
Individual earnings at the end of each period depend on both, short and long-run prediction
errors and are computed asiπt=iπs
t+iπtl. We denote as iπst the subject payoff that depends
on her short-run prediction error:
iπts=
250
1 +β with β=
ipe
t,t−pt
2
2
(2)
and as iπl
t the subject payoff that depends on long-run predictions error. We define iπtl =
Pt−1
j=1 iπtl−j,t, whereiπtl−j,t represents the individual profit associated with the accuracy of the
prediction submitted by subjectiat the beginning of periodt−jabout the asset price in period
t, where 1≤j≤t−1. It is computed according to the following payment schedule:3
iπlt−j,t=
25 if iδt−j,t≤5
12 if iδt−j,t≤10
5 if iδt−j,t≤15
0 otherwise
whereiδt−j,t=|ipet−j,t−pt|. The final payment of each subject is the sum of payoffs across all periods.4 Note that subjects have an immediate feedback about the accuracy of their short-run
predictions, while they experience a delay in evaluating the accuracy of their long-run predictions.
The experiment involved 42 undergraduate students and it was conducted in the Laboratory of
Experimental Economics at University Jaume I. Each session lasted approximatively 40 minutes
and the average gain was 20 Euro.
3
We used a payoff mechanism similar to [1].
4
We calibrated the parameters of the payoff functions such that approximately maxP20
t=1iπst = max P20
t=1iπtl, in order to give to the subjects the same incentive to provide accurate predictions in the short and in the long-run.
3. Results
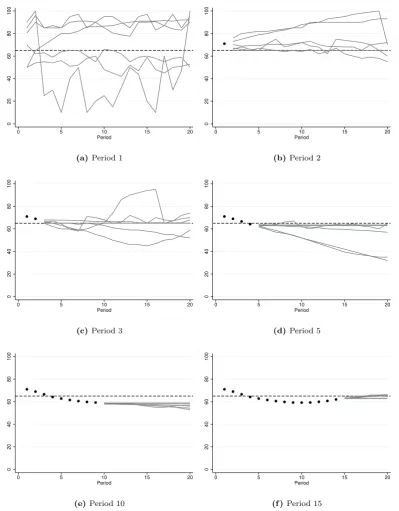
Figures 1 and 2 show the evolution over time of the asset price and individual short and
long-run predictions, respectively.5
The qualitative properties of the dynamics of short-run predictions
are in line with the literature of LtFEs (See [2]): (i) a strong coordination of the individual
short-run predictions after few periods; (ii) a slow convergence of the price towards the fundamental
value, following a monotonically or oscillatory pattern. As expected, we observe that eliciting
long-run expectations does not affect the dynamical properties of short-run expectations, and
therefore, the price dynamics.
3.1. Coordination and convergence
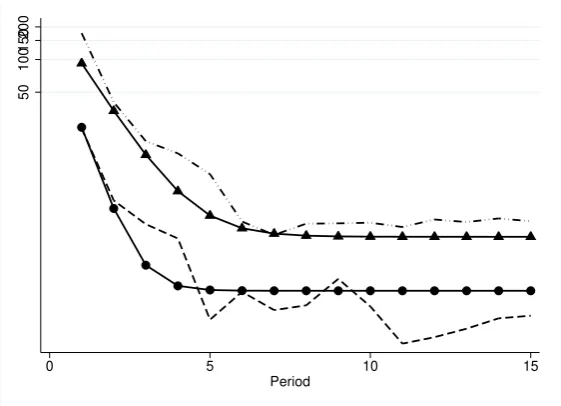
As a measure of coordination of expectations, we use the (within-group) variance of individual
predictions at a given time horizon. Figure 3 shows the evolution over time of the average variance
of individual predictions for two different time horizons: one-step-ahead and 5-steps-ahead.6 We
clearly observe that the coordination of short and long-run expectations increases over time.
However, we find a lower level of consensus among subjects concerning their long-run predictions
as compared to their short-run predictions.
To measure the convergence of subjects’ expectations to REE, we use their Relative Mean
Square Deviation (RMSD) from the asset fundamental value. Figure 4 shows a slower convergence
of long-run expectations, measured as subjects’ predictions of the price at the end of period 20,
compared to short-run predictions. The dispersion of subjects’ expectations within a group
is consistently lower than the deviation of the price from REE. We conclude, then, that the
REE does not provide a particularly accurate description of subjects’ expectations neither for
short-run nor for long-run expectations.
If it is known in the LtFE literature that subjects’ short-run expectations coordinate but not
necessarily to the fundamentals. We generalize those results showing that long-run expectations
exhibit similar characteristics. However, both the degree of coordination and convergence of
long-run expectations is systematically lower compared to short-run expectations.
5
In Figure 2 we show one group as an example, since the qualitative features of the other groups are very
similar.
6
We choose 5 periods as a good compromise between having sufficient number of observations and a sufficiently
40
60
80
0 5 10 15 20
Period
(a)Group 1
40
60
80
0 5 10 15 20
Period
(b)Group 2
40
50
60
70
80
0 5 10 15 20
Period
(c)Group 3
40
60
80
0 5 10 15 20
Period
(d)Group 4
40
50
60
70
80
0 5 10 15 20
Period
(e)Group 5
40
50
60
70
80
0 5 10 15 20
Period
(f )Group 6
40
60
80
0 5 10 15 20
Period
[image:6.595.120.477.42.675.2](g)Group 7
Figure 1: Time series of prices (thick line), short-run individual predictions (thin lines) and asset
fundamental value (broken line) per group.
0 20 40 60 80 100
0 5 10 15 20
Period
(a)Period 1
0 20 40 60 80 100
0 5 10 15 20
Period
(b)Period 2
0 20 40 60 80 100
0 5 10 15 20
Period
(c)Period 3
0 20 40 60 80 100
0 5 10 15 20
Period
(d)Period 5
0 20 40 60 80 100
0 5 10 15 20
Period
(e)Period 10
0 20 40 60 80 100
0 5 10 15 20
Period
[image:7.595.99.499.114.626.2](f )Period 15
Figure 2: Prices (dots), the asset fundamental value (broken line) and long-run individual predictions
(lines) submitted in periods 1, 2, 3, 5, 10 and 15 of Group 4. The horizontal axis in each
3.2. Expectations’ formation
In this section we provide with a tentative behavioral explanation for the empirical identified
asymmetry between the dynamics of short and long-run expectations. Our results on
coordi-nation of expectations and convergence to the fundamentals allow us to conjecture that, when
forming their expectations, subjects give different weights to the available information depending
on the forecasting horizon. In order to formalize and test our conjecture, we estimate a GMM
dynamic panel, regressing short and long-run individual expectations on past prices and past
individual predictions. We distinguish between short and long-run explanatory variables. As a
proxy for the subjects’ long-run expectations in periodt, we considerip¯et,t+5= (1/5)
P5
k=1ipet,t+k,
which is the moving average of the expected prices for the next 5 periods. As a proxy for the
recent past dynamics of prices, we use ¯pt−2,t−6= (1/5)
P6
j=2pt−j, which is the moving average of past prices considering a time window of 5 periods.7
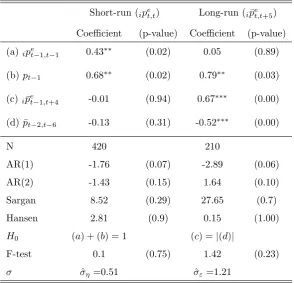
From the results of our regression in Table 1, we infer that subjects short-run predictions
follow a simple linear adaptive rule anchored in the last realized price, where the learning
com-ponent depends on short-run variables only:8
ipe
t,t=pt−1+ ˆα(ipet−1,t−1−pt−1) where ˆα= 0.38. (3)
Turning to the long-run expectations formation, our results show that subjects follow again an
adaptive rule anchored in the last realized price, where the learning component depends now
only on long-term prediction variables:
ip¯et,t+5= pt−1+ ˆγ (ip¯et−1,t+4−p¯t−2,t−6) where ˆγ= 0.6. (4)
Although subjects use an adaptive learning scheme independently of the forecasting horizon,
the learning parameters are significantly different, i.e. ˆγ >αˆ. This asymmetry can be related
to the different coordination dynamics of short and long-run expectations (see Figure 3). We
can use eqs. (3) and (4) to compute recursively the time evolution of the variances of short- and
long-run predictions within a group:
V ar[ipet,t] = ˆα 2
V ar[ipet−1,t−1] + ˆσ 2
η , (5)
V ar[ip¯et,t+5] = ˆγ 2
V ar[ip¯et−1,t+4] + ˆσ 2
ε , (6)
7
Note that, in the moving average ¯pt−2,t−6, we excludept−1to avoid collinearity problems in the regression.
8
Since we cannot reject the null hypothesis that (a)+(b)=1 (see Table 1), the value of ˆα is computed as
0.5[(1−0.68) + 0.43].
where ˆσ2 ηand ˆσ
2
εare the estimated variances of the error term of the regressions in Table 1. Figure
3 shows the good qualitative agreement between our theoretical prediction, derived from eqs. (5)
and (6), and the experimental data, confirming that the estimated adaptive rules, described in
eqs. (3) and (4), do capture relevant structural elements of the subjects’ expectation formation
[image:9.595.151.446.211.494.2]mechanism.
Table 1: Estimation results
Short-run (ipe
t,t) Long-run (ip¯et,t+5)
Coefficient (p-value) Coefficient (p-value)
(a)ipe
t−1,t−1 0.43∗∗ (0.02) 0.05 (0.89)
(b)pt−1 0.68∗∗ (0.02) 0.79∗∗ (0.03)
(c)ip¯et−1,t+4 -0.01 (0.94) 0.67∗∗∗ (0.00)
(d) ¯pt−2,t−6 -0.13 (0.31) -0.52∗∗∗ (0.00)
N 420 210
AR(1) -1.76 (0.07) -2.89 (0.06)
AR(2) -1.43 (0.15) 1.64 (0.10)
Sargan 8.52 (0.29) 27.65 (0.7)
Hansen 2.81 (0.9) 0.15 (1.00)
H0 (a) + (b) = 1 (c) =|(d)|
F-test 0.1 (0.75) 1.42 (0.23)
σ σηˆ =0.51 ˆσε=1.21
4. Discussion and conclusion
Our results show that subjects’ expectations are not consistent with the REE, neither in the
short nor in the long-run. Subjects expectations, instead, can be described using an adaptive
learning scheme. Interestingly, subjects’ predictions are centered in the last price, independently
of the horizon. The last realized price constitutes, then, a time-varying anchor or, using the
terminology of [6], a focal point for subjects’ expectations coordination. Moreover, when revising
their expectations, subjects consider their past prediction errors computed within time window
“proportional” to their prediction horizon, see eqs. (5) and (6). Interestingly, we observe a
50
100
150
200
0 5 10 15
[image:10.595.159.440.99.302.2]Period
Figure 3: Average variance of subjects’ predictions within a group in the short and the long-run in a
log-linear scale.
the lower level of consensus of subjects’ long-run expectations. This asymmetric adjustment could
be a consequence of the fact that subjects experience an immediate feedback on the accuracy of
their short-run predictions, while there is a delay when evaluating the accuracy of their long-run
predictions. These results are also compatible with a sticky information framework ([4]) where
the degree of stickiness depends on the prediction horizon. An alternative explanation can be
cast into a modified version of the heuristic switching model (see [3]) which accounts for the
long-run expectations dynamics. All those issues are the focus of current research.
We believe that our novel experimental setting is a valuable tool to study the whole time
spectrum of subjects’ expectations and test different hypotheses on expectations formation.
Fu-ture research will be devoted to conduct experiments where new information at the disposal of
subjects is not limited to the time series of prices, but includes other information sources, such
as aggregate information on subjects’ long-run expectations, public announcements of policy
measures or future changes of the fundamentals.
Acknowledgement
The authors are grateful for funding this research from the European Union Seventh
Frame-work Programme (FP7-2007-2013) under the grant agreement no. 619255, the Universitat Jaume
I under the project P11B2015-63 and the Spanish Ministry of Science and Technology under the
5
10
15
20
25
0 5 10 15 20
[image:11.595.159.439.97.303.2]Period
Figure 4: RMSE of the individual short and long-run predictions.
project ECO2015-68469-R.
References
[1] Ernan Haruvy, Yaron Lahav, and Charles N Noussair. Traders’ expectations in asset markets:
experimental evidence. The American Economic Review, 97(5):1901–1920, 2007.
[2] Peter Heemeijer, Cars Hommes, Joep Sonnemans, and Jan Tuinstra. Price stability and
volatility in markets with positive and negative expectations feedback: An experimental
investigation. Journal of Economic Dynamics and Control, 33(5):1052–1072, 2009.
[3] Cars Hommes. The heterogeneous expectations hypothesis: Some evidence from the lab.
Journal of Economic Dynamics and Control, 35(1):1–24, January 2011.
[4] N. Gregory Mankiw and Ricardo Reis. Sticky Information versus Sticky Prices: A Proposal
to Replace the New Keynesian Phillips Curve. The Quarterly Journal of Economics, 117(4): 1295–1328, 2002.
[5] Ramon Marimon and Shyam Sunder. Indeterminacy of Equilibria in a Hyperinflationary
World: Experimental Evidence. Econometrica, 61(5):1073–107, September 1993.
[7] Michael Woodford. The Case for Forecast Targeting as a Monetary Policy Strategy. Journal of Economic Perspectives, 21(4):3–24, 2007.


![Overview of the labour market [July 2007]](data:image/gif;base64,R0lGODlhAQABAIAAAP///wAAACH5BAEAAAAALAAAAAABAAEAAAICRAEAOw==)