Raman spectroscopy: Techniques and applications in
the life sciences
D
USTINW. S
HIPP1,*, F
ARISS
INJAB1,*,
ANDI
OANN
OTINGHER1,**1School of Physics and Astronomy, University of Nottingham, Nottingham NG7 2RD, United Kingdom *Both authors contributed equally to this work.
**Corresponding author: [email protected]
Compiled April 12, 2017
Raman spectroscopy is an increasingly popular technique in many areas including biology and medicine. It is based on Raman scattering, a phenomenon in which incident photons lose or gain energy via in-teractions with vibrating molecules in a sample. These energy shifts can be used to obtain information regarding molecular composition of the sample with very high accuracy. Applications of Raman spec-troscopy in the life sciences have included quantification of biomolecules, hyperspectral molecular imag-ing of cells and tissue, medical diagnosis, and others. This review briefly presents the physical origin of Raman scattering explaining the key classical and quantum mechanical concepts. Variations of the Ra-man effect will also be considered, including resonance, coherent, and enhanced RaRa-man scattering. We discuss the molecular origins of prominent bands often found in the Raman spectra of biological samples. Finally, we examine several variations of Raman spectroscopy techniques in practice, looking at their ap-plications, strengths, and challenges. This review is intended to be a starting resource for scientists new to Raman spectroscopy, providing theoretical background and practical examples as the foundation for further study and exploration. © 2017 Optical Society of America
OCIS codes: (300.6450) Spectroscopy, Raman; (180.5655) Raman microscopy; (300.6230) Spectroscopy, coherent anti-Stokes Raman scattering; (170.3880) Medical and biological imaging; (170.6510) Spectroscopy, tissue diagnostics.
http://dx.doi.org/10.1364/aop.XX.XXXXXX
CONTENTS
1 Introduction 2
2 Raman Scattering: Inelastic Scattering of Light by Molecules 3
2.1 Molecular vibrations . . . 3
2.2 Classical Description of Raman Scattering . . . 5
2.3 Quantum Mechanical Description of Raman Scattering . . . 6
2.4 Resonance Raman scattering. . . 9
2.5 Coherent Raman Scattering . . . 10
2.6 Enhanced Raman Scattering . . . 12
3 Raman Spectra of Biological Molecules 15 3.1 Nucleic Acids . . . 15
3.2 Proteins. . . 17
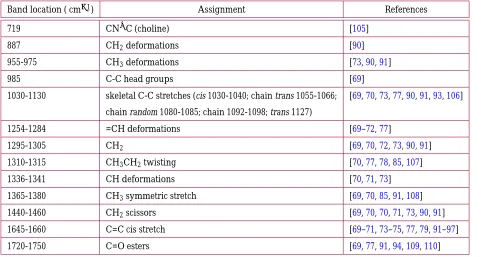
3.3 Lipids. . . 19
3.4 Other Biomolecules . . . 20
4 Techniques and Applications 23
4.1 Spontaneous Raman Microscopy . . . 23
4.2 Resonance Raman Spectroscopy . . . 31
4.3 Coherent Anti-Stokes Raman Scattering (CARS) . . . 31
4.4 Stimulated Raman Scattering (SRS). . . 36
4.5 Surface-enhanced Raman Scattering (SERS) . . . 38
4.6 Tip-enhanced Raman Scattering (TERS) . . . 42
4.7 Raman Spectroscopy in Turbid Media . . . 45
4.8 Fiber Optic Probes . . . 46
4.9 Selective Scanning Raman Spectroscopy . . . 50
4.10 Raman Label-based Techniques . . . 53
5 Data Analysis Techniques 56 5.1 General Procedure . . . 56
5.2 Direct Peak Analysis . . . 56
5.3 Prinicpal Component Analysis . . . 58
5.4 Cluster Analysis. . . 58
5.5 Linear Discriminant Analysis . . . 58
5.6 Logistic Regression . . . 58
5.7 Support Vector Machines. . . 58
5.8 Decision Trees . . . 59
5.9 Partial Least Squares Regression . . . 59
5.10 Other Techniques . . . 59
6 Future Perspective 59
1. INTRODUCTION
Raman scattering is a phenomenon in which photons incident on a sample are inelastically scattered after interacting with vibrating molecules within the sample. The effect was first discovered by Chandrasekhara Venkata Raman in 1928[1], for which discovery Prof. Raman received the 1930 Nobel Prize in Physics. While Raman spectroscopy is now used in biology and medicine, Raman spectroscopy found its first applications in physics and chemistry[2] and was mainly used to study vibrations and structure of molecules[3,4]. One early factor limiting the implementation of Raman spectroscopy was the weak scattering signal. Large intensities of monochromatic light are required to excite a detectable signal. This requirement became much easier to realize following the invention of the laser in 1960. Soon thereafter, lasers were used to drive Raman scattering[5, 6] and the number of applications increased rapidly, particularly in the analysis of biomolecules. Other important developments accelerating the progress of Raman spectroscopy include the digitization of spectra using charge-coupled devices (CCDs)[7,8], the confocal Raman microscope[9], and improved filters to remove light at the laser wavelength[10]. These inventions allowed a rapid increase in the popularity of using Raman to study biological samples in the early 1990s[11–13].
Raman spectroscopy is a popular technique in the biological sciences partially because it is non-destructive and in principle requires no sample preparation. It is therefore well-suited for applications requiring the sample to be unaltered, including in vivo measurements. Additionally, Raman systems operate at visible or near-infrared wavelengths can be easily integrated into standard microscopes and conventional optical fibers. Although usually a point-measurement technique, Raman spectroscopy based on laser or sample scanning can be used to create hyperspectral images.
For biological samples, Raman spectroscopy is typically sensitive to concentrations of bio-molecules such as lipids, proteins, carbohydrates, and nucleic acids. Raman spectroscopy can very accurately measure relative concentrations of these molecular classes, but is poorly suited to identify specific molecules (i.e. specific proteins or DNA sequences). The high accuracy of Raman spectroscopy comes from detecting small changes in the relative concentrations of bio-molecules, e.g., the ratio of protein to lipid within a cell or higher nucleic acid concentrations in tumour tissue. The high accuracy of Raman spectroscopy has received a great deal of attention as a potential diagnostic tool. Raman spectroscopy has been used to classify bacteria [14–16] and diagnose a broad range of diseases[17– 19].
Overview This review is meant as an introduction to the theory and techniques of Raman spectroscopy, as used in biological and medical applications. The theory of Raman scattering phenomena will be treated with sufficient depth to understand the technical requirements, strengths, and weaknesses of common Raman spectroscopy techniques.
Section2will outline the mechanism behind spontaneous, coherent, and enhanced Raman scattering. This will begin with a description of molecular vibrations. We will then describe various interactions of light with these molecular vibrations using both classical and quantum mechanical treatments.
Section3will address the molecular origins of some of the most common and most dominant Raman bands encountered when measuring biological samples. This section will focus on Raman spectral contributions from proteins, nucleic acids, lipids, and other common biological molecules.
Section4will discuss many of the common techniques currently used in Raman spectroscopy, including the biological applica-tions and shortcomings of each technique. Some of these techniques include spontaneous Raman scattering, coherent anti-Stokes Raman scattering (CARS), stimulated Raman scattering (SRS), surface-enhanced Raman scattering (SERS), fiber optic probes, selec-tive scanning Raman spectroscopy (SSRS), spatially offset Raman spectroscopy (SORS), and Raman-based labeling techniques.
Section5will outline some general techniques for classification and modeling studies using Raman spectroscopy. This discussion will address the segregation of data into training, validation, and test sets as well as basic principles of some of the classification models most popularly used with Raman spectroscopy.
Finally, Section6will present a brief outlook on the future of Raman spectroscopy in the life sciences.
2. RAMAN SCATTERING: INELASTIC SCATTERING OF LIGHT BY MOLECULES
2.1. Molecular vibrations
Molecular vibrational modes describe the relative motion of atoms within a molecule. For a molecule with N atoms, there are 3N degrees of freedom associated with the x, y, and z positions of each atom. Three of these degrees of freedom include translating the whole molecule without changing any of the intra-molecular distances. Three additional degrees of freedom are accounted for by rotating the whole molecule (two for linear molecules). All other changes in the positions of atoms result in stretching, contracting, or otherwise deforming chemical bonds between atoms. These represent the vibrational modes. There are therefore 3N−6 vibrational modes for a molecule with N atoms (3N−5 if molecule is linear).[26]
The analysis below will show that the energies of these molecular vibrations are quantized. The allowed vibrational energies are set by the properties of the atoms in the molecule and the bonds between them. These vibrational energies are fundamental to the phenomenon of Raman scattering.
2.1.1. Mass on a Spring
A molecular bond can be approximated as a spring connecting two masses. The potential energy U of the “spring” is given by
U=1
2kx
2, (1)
where k is the “spring constant,” and x is the displacement of the nuclei from their equilibrium bond position. Applying Schrödinger’s equation to this potential gives
−¯h2 2m
d2ψ dx2 +
1 2kx
2ψ=Eψ, (2)
where E is the vibration energy andψis the wavefunction of the system. In this equation, m is the reduced mass of the atoms involved in the vibration, given by m= m1m2
m1+m2.
Solving Equation2reveals that these vibrations are quantized. The vibrational energies are given by
Ev= (v+1
2)¯h
k
m, (3)
where v is the quantum number of the vibrational mode. This result can be applied to vibrational modes of molecules and shows that the energies are quantized. Indeed, for larger and more complex molecules, the dependence of k and m on the force constants and masses of the atoms is more complicated.
2.1.2. Energies of Molecular Vibrations
Wavenumbers Traditionally, energies of molecular vibrational modes are expressed with units of wavenumbers, or cm−1. This con-vention is a result of the origins of Raman spectroscopy in chemistry and the similarity of the technique to IR absorption spectroscopy, which also probes molecular vibrations.
The method of using wavenumbers as a unit of energy can be seen in the following example. Suppose a sample is illuminated with laser light at 785 nm. This wavelength can also be expressed as a photon energy in terms of wavenumbers. To do this,
˜
ν=λ[1
cm]. (4)
Forλi = 785 nm = 7.85×10⁻⁵cm,
˜
νi = 7.85×101−5cm = 1.27×104cm−1. (5)
Rules of Thumb for Vibration Energies A precise value for the spring constant, k, is difficult to calculate from theory for most molecules. Density-functional theory is sometimes used to estimate vibrational energies, but more often, the energy of a vibration is taken from measurements. However, several rules of thumb can provide useful information to estimate a vibrational mode’s energy or identify the vibration associated with a measured signal.
An increase in the reduced mass m in Equation3will lead to lower energies. Thus, bonds involving larger atoms will vibrate with lower energies. This is very apparent when comparing carbon-hydrogen (C-H) vibrations (2800-3100 cm−1) to carbon-carbon (C-C) vibrations (800-1100 cm−1).
Stronger bonds such as double- or triple-bonds increase the spring constant in Equation3. This leads to higher energies. For example, carbon double-bond vibrations (C=C) are found at 1550-1660 cm−1. The bond strength (i.e. spring constant) also depends on the type of vibration. Different types of vibrations include stretching, deformation (i.e. scissors, wagging), and others. The relationships between these vibrations can be complex, but some general rules apply. For example, stretching modes have a higher k than deformations and thus occur at higher energies[26].
If multiple bonds are involved in a vibrational mode, Raman scattering is usually more intense if the stretches happen in phase with each other (i.e. bonds get longer/shorter at the same time). In-phase vibrations allow the dipoles to constructively interfere with each other. Multiple similar bonds vibrating in phase often produce the most intense Raman scattering. Some examples of this include the breathing of a ring shaped molecule such as benzene or a nucleic acid base[26].
2.1.3. Vibrational Modes and Group Theory
Not all vibrations are active in absorption or Raman scattering. Multiple methods exist to determine if a particular vibration will be absorption-active, Raman-active, both, or neither. This behavior depends on the symmetry properties of the vibrational mode (treated in detail in Sections2.2and2.3).
In this analysis, it can be useful to categorize vibrational modes using group theory. Group theory classifies complicated molecular vibrations into groups that share symmetry properties. We will introduce this using the linear molecule CO2as an example. As a linear, invertible molecule, CO2 is in symmetry group (or point group) D∞h. This symmetry group has six symmetry operations
(named by Mulliken[27]): the identity operation (E), rotation of any angle about the dominant axis (2C∞), reflection about any plane intersecting the dominant axis (∞σv), inversion (i), improper rotation (rotation followed by reflection) of any angle about the
dominant axis (2S∞), and rotation of 180◦perpendicular to the dominant axis (∞C2).
The various vibrational modes of molecules belonging to symmetry group D∞h(including CO2) can be analyzed using the char-acter table in Table1. Each vibrational mode can be expressed as one of the irreducible representations found in the rows of Table1. The table describes how each irreducible representation behaves under each of the symmetry operations (columns). This behavior determines whether the mode will be absorption-active, Raman-active, both, or neither (see Section2.3). Similar tables for other symmetry groups (applying to other molecules) can be found in numerous sources, including Long[28] and Diem[29].
D∞h E 2C∞ ∞σv i 2S∞ ∞C2
A1g 1 1 1 1 1 1
A2g 1 1 -1 1 1 -1
E1g 2 2 cos(φ) 0 2 −2 cos(φ) 0 E2g 2 2 cos(2φ) 0 2 2 cos(2φ) 0
E3g 2 2 cos(3φ) 0 2 −2 cos(3φ) 0
A1u 1 1 1 -1 -1 -1
A2u 1 1 -1 -1 -1 1
E1u 2 2 cos(φ) 0 -2 2 cos(φ) 0
E2u 2 2 cos(2φ) 0 -2 −2 cos(2φ) 0 E3u 2 2 cos(3φ) 0 -2 2 cos(3φ) 0
Table 1. Character table for Point Group D∞hshowing behavior of irreducible representations under symmetry operations. CO2is a member of this point group, so the irreducible representations describe vibrational modes of this linear molecule.
For example, the symmetric stretching mode of CO2
see Figure1(a)is unchanged by each of the symmetry operations for D∞h.
This matches the behavior of the irreducible representation A1g.
Fig. 1. (a) CO2symmetric stretching vibrational mode. This mode can be expressed as the irreducible representation A1g (b) CO2asymmetric stretching vibrational mode. This mode can be expressed as the irreducible representation A1u
2.2. Classical Description of Raman Scattering
2.2.1. Electromagnetically Induced Changes to the Molecular Polarizibility
Many of the properties of Raman scattering can be understood by examining the process of an oscillating electric field interacting with a polarizible molecule. The most complete early derivation of the Raman effect was presented by Placzek in 1934[30]. An electric field with amplitude E0oscillating with frequencyωradinduces an electric dipole proportional to the polarizibility (α) of the molecule
that can be expressed as
μ=αE0sin(ωradt), (6)
where t is time. While this oscillating dipole can be responsible for absorption or elastic scattering of light, the polarizibilityαof the molecule changes during molecular vibrations. If the vibration has frequncyωvib, the vibration changes the displacement x between
atoms by
x=x0sin(ωvibt + φ), (7)
whereφis the phase of the vibration. Without knowing the exact dependence ofαon x, we can analyzeαgenerally. Assuming the displacement is small, we can expandαin a Taylor series to get
α=α0+∂α∂
xx=0x+. . . . (8)
Knowing the dependence of x on the molecular vibrations, the polarizibility can be written
α=α0+∂α∂
xx=0x0sin(ωvibt + φ). (9)
Applying this form of the polarizibility to Equation6, the electric dipole becomes
μ= [α0+∂α∂x
x=0x0sin(ωvibt + φ)]E0sin(ωradt), (10) which can be rewritten as
μ=α0E0sin(ωradt) +
E0 2
∂α ∂xx=0x0
cos[(ωrad−ωvib)t − φ]−cos[(ωrad+ωvib)t + φ]. (11) An induced dipole oscillating with a frequencyωemits radiation along an angleθwith intensity
I= ω 4μ2
0sinθ2 32π2ε
0c3
, (12)
where μ0 is the amplitude of the induced electric dipole and ε0 and c are the permittivity and speed of light in a vacuum, respectively[28,31]. The dipole derived in Equation11then radiates electromagnetic waves at the frequenciesωrad,(ωrad − ωvib),
and(ωrad + ωvib). In practice, it is usually the case thatωradωvib. Thus, as with other types of scattering, the intensity of Raman
scattered light decreases with the fourth power of the incident wavelength. The amplitude of the induced dipole, p0, scales linearly with the incident electric field. Therefore the intensity of Raman scattered light will scale linearly with the excitation intensity.
Rayleigh Scattering Analyzing each of the radiative frequencies in Equation11reveals different light scattering phenomena. The sin(ωradt)term corresponds to scattered radiation with a frequency equal to the incident light, which is called Rayleigh scattering.
As there is no change in energy, this event is also called elastic scattering.
Stokes Raman Scattering The radiation represented by the cos[(ωrad − ωvib)t] − φterm has been shifted down in frequency by
ωvib. This means that the scattered radiation has lost energy equal to the energy of the molecular vibrations. This difference in energy
is called a Stokes shift. This energy has been absorbed by molecule to excite the vibrational mode corresponding toωvib. This energy
is generally dissipated non-radiatively following the scattering event. Because the phaseφis different for every molecule, Stokes Raman scattered light (generally refered to as simply “Raman scattering,” or “spontaneous Raman scattering”) is incoherent.
Anti-Stokes Raman Scattering The cos[(ωrad + ωvib)t]term describes an increase in frequency of scattered radiation. In this process,
2.2.2. Energy Shift in Wavenumbers
Scattered radiation loses energy in the process of Stokes Raman scattering. Expressing this energy in terms of wavenumbers, the energy becomes
˜
νf =ν˜i−ν˜shi f t. (13)
For example, if the 785 nm radiation discussed in5excites the CH2scissors vibration vibrating at 1450 cm−1,
˜
νf = 1.27×104cm−1 − 1450 cm−1 =1.13×104cm−1. (14)
This value is again expressed as energy in terms of wavenumbers. We can convert this into the familiar wavelength by inverting Equation4. This gives usλf = 8.86×10⁻⁵cm = 886 nm. This method of calculation can be very useful when designing the filters and detectors for a Raman system.
2.2.3. Selection Rules
From Equation11, for Stokes or anti-Stokes Raman scattering to occur, the derivative of the molecule’s polarizibility must be non-zero. In more physical terms, the vibration must change the molecule such that it is more polarizible in one direction and less polarizible in the other. This provides a selection rule for vibrations that will be Raman-active.
This criterion is different from the selection rule for absorption-active vibrations used in infrared spectroscopy. Absorption-active vibrations must have a non-zero derivative of the electric dipole, rather than the polarizibility. These criteria are non-exclusive; some vibrations are absorption-active, some are Raman-active, some are both, and some are neither.
Carbon dioxide (CO2) provides examples of vibrational modes to illustrate these selection rules. Figure1(a) shows the symmetric stretching mode of CO2. In both directions of the vibration, the centers of positive and negative charge remain unchanged. Thus, the derivative of the electric dipole is zero and this vibration is absorption-inactive. On the other hand, when the atoms are extended in this vibration, the electron clouds are stretched and less tightly bound, making the molecule more polarizible. The opposite is true in the other direction of vibration. This means that the derivative of the polarizibility is non-zero and the vibration is Raman-active.
Another case is illustrated by the asymmetric stretching mode in Figure1(b). In the extremes of this vibration, the center of positive charge shifts back and forth, changing the dipole. This vibration is absorption-active because the electric dipole changes. However, the molecule’s polarizibility is the same in these extremes. Thus, the derivative of the polarizibility is zero and the vibration is Raman-inactive.
2.3. Quantum Mechanical Description of Raman Scattering
Additional insight may be gained by considering Raman scattering through the lens of quantum mechanics. In short, this quantum mechanical treatment reveals Raman scattering as a transition between energy levels via a “virtual state.” This virtual state is crucial to the phenomenon of resonance Raman scattering, which will be discussed in Section2.4. Quantum mechanics will also allow us to estimate the intensities of Raman bands. Additionally, quantum mechanics allows us to understand the relative dominance of Stokes Raman scattering over anti-Stokes and derive selection rules using group theory for different molecular vibrations.
2.3.1. Raman Scattering as a Transition Between States
Figure2shows various depctions of relevent scattering processes. The Jablonski energy level diagram of spontaneous Raman scat-tering in Figure2(c) describes the process in two steps. First, the incident light drives the molecule into an excited “virtual state.” This virtual state has arbitrary energy and does not have to correspond to an actual allowed state of the molecule.
Second, the molecule decays from the virtual state, releasing a photon. Most of the timedepending on the temperature and distribution of states in the molecule (see Equation20), the molecule will decay back into the ground state. The scattered photon will be equal in energy (and wavelength) to the incident photon. This event is called Rayleigh scattering.
Alternatively, the molecule may decay into an excited vibrational state. The scattered photon can lose energy equal to that of the vibrational state and increases in wavelength – this is Stokes Raman scattering. In anti-Stokes Raman scattering, the photon can be scattered by a molecule initially in an excited vibrational state. The scattered photon gains energy and decreases in wavelength as the molecule returns to the ground state.
The quantum paths for these processes are depicted in the Feynman diagrams in Figure2(d). The involvement of the virtual state is again apparent in this representation. Furthermore, the Feynman diagrams reveal the dependence of spontaneous Raman scat-tering on an interaction with the vacuum field[32]. This interaction has an arbitrary phase, making the resulting scattered radiation incoherent[33].
2.3.2. Transition Rate of Raman Scattering
Fermi’s Golden Rule uses quantum mechanics to provide a mathematical description of the transition rate between two states medi-ated by a transition dipole. Fermi’s Golden Rule is written as
R|i→|f≈f|μi f|i2|E0|2δ(f), (15)
where R|i→|f is the rate of transition from initial state|ito final state|f,μi f is the perturbation of the Hamiltonian coupling|i
Spontaneous Stokes Raman
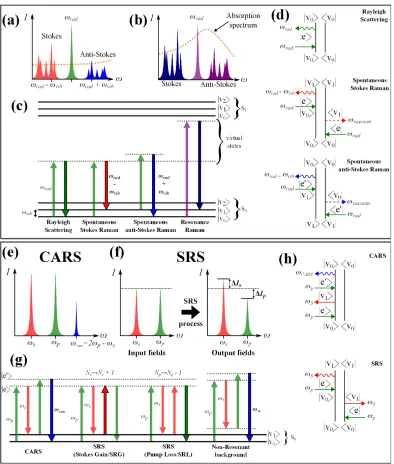
Fig. 2. Energy level, spectral, and Feynman diagrams for spontaneous and coherent Raman processes. Transition arrows with black outlines and bold labels indicate the experimentally measured feature. Spectral intensities are not to scale.
(a) Using a single excitation beam (away from absorption band) will generate weak Raman scattering at many different vibrational Stokes and anti-Stokes frequencies.
(b) Excitation near electronic resonance (absorption band) greatly increases the scattering signal (see resonance Raman, Section2.4) (c) Energy level diagrams for spontaneous scattering processes including Rayleigh, Stokes Raman, anti-Stokes Raman, and reso-nance Raman scattering.
(d) Feynman diagrams for Rayleigh, Stokes Raman, and anti-Stokes Raman scattering. In the spontaneous Raman scattering pro-cesses, the bra state interacts with the vacuum field[32].
(e) CARS utilizes pump and Stokes beams tuned toωvibto populate the excited vibrational state, from which anti-Stokes Raman scattering is measured. Non-resonant contributions are also possible in this scheme, whereby all intermediate transitions are medi-ated via virtual states.
(f) SRS also uses two input beams, but no additional frequencies are generated by the SRS process. Instead, the intensity change in the pump or Stokes beam is measured.
be written in terms of the transition dipole, a complex vector quantifying the interaction between the states. The transition dipole for Raman scattering is
d|i→|f= E0
¯h
∑
eμ(e f1)|ee|μ(ie1) ωrad−ωei−iΓe+
μ(e f2)|ee|μ(ie2) ωrad+ωei+iΓe
, (16)
where|eis an arbitrary excited electronic state,ωradis the frequency of incident light,ωeiis the separation of the ground state|iand
the excited state|eexpressed as a frequency, andΓeis ¯h/(2τe), whereτeis the lifetime of|ebefore decaying to|i[28]. Each term
within the sum can be considered independently and transition through different virtual states, so two transition dipoles are seen in Equation16. The total transition consists of contributions from the transitions involving all possible virtual states|e. By applying Fermi’s Golden Rule to this transition and restricting our analysis to the most significant terms, we find the rate of Raman scattering to be
R|i→|f≈f|d|i→|f|i2≈
∑
e
ωf|μe f|ee|μie|i
rad−ωei+iΓe
2|E0|2δ(f). (17)
The two step process of Raman scattering can be seen in the numerator of Equation17. The terme|μie|idescribes the transition
from the ground state to the virtual state while the termf|μe f|edescribes the transition from the virtual state to the final state – an
excited vibrational state.
Equation17can be assumed provided that
ωrad>ωf i, (18)
whereωf i is the frequency corresponding to the energy difference between the final and initial states|fand|i, respectively[28].
In other words, the photon initiating the Raman process must have more energy than the vibrational transition it is exciting. Most vibrational modes are quite low in energy, corresponding to mid-infrared radiation. Therefore, satisfying this condition is rarely a problem in practice.
2.3.3. Raman Scattering Rate
A number of properties of Raman scattering can be seen from these results. First, Equation17shows that the rate of the transition is proportional to|E0|2, meaning that Raman scattering scales linearly with the incident intensity. This is consistent with the classical model discussed in Section2.2.
Second, Raman scattering relies on a transition through a virtual state|e. The molecule is not stable in this virtual state, meaning that the Raman scattering process happens very fast. In practice, the time for a scattering event is on the order of femtoseconds. The difference in timing between Raman scattering and other phenomena is useful to discriminate against these slower effectse.g.,
fluorescence (see Section4.1).
Scattering Cross-section Long shows that typical values for the transition dipole can be calculated or measured to be on the order of 5×10−42 Cm2
V [28]. This value can be used to estimate the Raman scattering cross-section,σ. The scattering cross section is used to
express the intensity of scattered light as a function of the incident irradiance and density of scatterers being irradiated. Following the calculations by Long,σtakes values on the order of 5×10⁻³⁵ sr moleculem2 [28].
The scattering cross-section can be used to find the scattered intensity by
I=σJ N, (19)
where I is the scattered intensity in Watts per steradiant, J is the excitation irradiance in Watts per meter2, and N is the number of molecules irradiated.
Because typical values forσare very small, this results in very weak levels of Raman scattering compared to Rayleigh scattering. In most samples, one photon is Raman scattered for every 106−1010excitation photons incident on the sample. This weak signal is one of the main disadvantages of Raman spectroscopy. This will be discussed further in Section4.1.
Stokes and Anti-Stokes Raman Scattering Intensities From Equation17, the transition can also happen in the reverse direction, starting from the excited vibrational state and ending in the ground state. This event results in a blue-shifted photon and is called anti-Stokes Raman scattering. However, anti-Stokes Raman scattering can only occur if there are molecules already in an excited vibrational state when the incident photon arrives. The number of molecules in this state (Nv) relative to the ground state (Ng) is given by
Nv
Ng =e
−¯hωv
kB T, (20)
whereωvis the frequency corresponding the the energy of the vibration, kB is the Boltzman constant, and T is the temperature of
the sample. The occurence of anti-Stokes Raman scattering will be proportional to the number of molecules in an excited vibrational state. Therefore, the ratio of anti-Stokes Raman intensity IASto Stokes Raman intensity IScan be estimated by
IAS
IS =e
−¯hωv
kB T. (21)
2.3.4. Selection Rules
The quantum mechanically-derived selection rules for Raman-active vibrational modes are based on the transition dipoleμi f. These
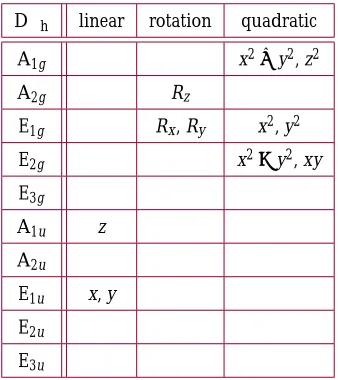
rules match the classical selection rules, but can be derived in different ways. This can simplify the selection rules for some molecules. The quantum mechanically-derived selection rules can be generalized using group theory. The character table in Table2again shows the irreducible representations in point group D∞h, corresponding to the vibrational modes of CO2. Here, however, the table shows which irreducible representations describe the transformations of linear, rotational, and quadratic coordinates. Similar tables for common symmetry groups have been published elsewhere, including by Long[28] and Diem[29].
D∞h linear rotation quadratic
A1g x2+y2, z2
A2g Rz
E1g Rx, Ry x2, y2
E2g x2−y2, xy
E3g
A1u z
A2u
E1u x, y
E2u
[image:9.612.225.394.136.326.2]E3u
Table 2. Character table for Point Group D∞hshowing linear, rotational, and quadratic transformations of irreducible
representa-tions.
The numerator of Equation17contains transitions through two dipole terms,μieandμe f. Each transition must be coupled through
a dipole (expressed as linear components). Thus, the polarizibility components are expressed as products of two linear components. These products are shown in Table2as quadratic components (e.g. x2, xy, yz, etc.)[29].
More formally, the product of the final state, polarizibility, and initial state must belong to a totally symmetric repesentation[28]. In most cases, the initial state will be the ground state and will not contribute to the triple product. Therefore, a vibrational mode will be Raman-active if its representation contains one or more quadratic components[29]. A vibrational mode is absorption-active if its representation contains one or more linear components.
As noted in Section2.1, the symmetric stretch of CO2 can be expressed as A1g. From Table 2, we see this vibrational mode transforms as x2 + y2, and z2. Because this representation describes quadratic transitions, this vibrational mode is Raman-active. There are no linear transitions associated with this representation, so the vibrational mode is absorption-inactive.
The asymmetric stretch corresponds to A1u. This irreducible representation transforms as z, so the vibrational mode is absorption-active, but Raman-inactive.
Because the selection rules depend on the transition dipoles, they are also based on the incident and detected polarization. How-ever, these effects tend to be less important in biological samples as the molecules are randomly oriented. In crystaline structures, on the other hand, these polarization effects are very pronounced.
Polarization effects can also be used to selectively detect some vibrations. For example, a symmetric vibration scatters with the same polarization as the incident light. An asymmetric vibration will partially scramble the polarization[29]. By detecting only the same polarization as the incident radiation, one can reduce the contribution of anti-symmetric vibrations. This can be helpful to characterize which vibrations are contributing to a complicated Raman spectrum.
2.4. Resonance Raman scattering
Looking at the denominator of Equation17, one can see that the rate of Raman scattering will be greatly enhanced whenωrad ≈ ωei.
This occurs when the incident light is tuned near resonance with an electronic transition of the molecule see Figure2(c). This enhancement is called resonance Raman scattering.
Unlike other enhancement effects, resonance Raman only amplifies Raman scattering from a specific vibrational mode of the molecule in resonance with the excitation illumination. Other modes and molecules in the sample are not affected. A suitable target molecule for resonance Raman spectroscopy must have strong Raman-active bands as well as absorption bands at practical wavelengths. It is also desirable that this absorption occurs without high levels of accompanying fluorescence.
2.5. Coherent Raman Scattering
With the development of the laser, it became possible to generate light at much higher irradiances than previously achievable. This revealed a plethora of new optical effects in materials, involving multiple photon transitions. This family of transitions were not observable previously, as the time-scale of many optical interactions is short enough that only a single incident photon is involved in any particular transition, as with spontaneous Raman scattering.
If there are sufficient numbers of photons incident upon a molecule within a sufficiently short space of time, the probability of a multiple-photon transition pathway increases. Another way of visualizing this is that the light is of sufficient intensity to modify the optical properties of the material, which allows new processes to occur[38]. This is the premise of the field of nonlinear optics, which considers effects such as second (and higher order) harmonic generation, sum- and difference-frequency generation, saturable and multi-photon absorption, and coherent Raman processes, among many others. These techniques all rely on the ability of pulsed lasers (with pulse durations ranging from femtoseconds to picoseconds) to generate high peak powers, which allow nonlinear optical processes to occur, whilst maintaining a sufficiently low average power to avoid photo-damage.
The focus of this part of the review will be on coherent Raman effects, which are nonlinear optical processes that are mediated by vibrational states. In particular we will discuss coherent anti-Stokes Raman scattering (CARS) and stimulated Raman scattering (SRS), as they are pertinent to studies in the life sciences. Other coherent Raman processes such as the Raman-induced Kerr effect, coherent Stokes Raman scattering and higher order processes are addressed in references [38,39].
To understand CARS and SRS, it is convenient to discuss the material response in terms of the macroscopic electromagnetic parameters. In linear optics, the relationship between the polarization density P and incident electric field E in one direction is written
P=0χ(ω)E (22)
where0is the permittivity of free space andχ(ω)is the dielectric susceptibility, which is generally frequency dependent (note: this equation can be viewed as the macroscopic representation of Equation6). For nonlinear optics however, this polarization response is not necessarily linear, and Equation22may be expanded more generally as
Pi=0χ(ij1)Ej+0χijk(2)EjEk+0χijkl(3)EjEkEl+. . .=P(1)+P(2)+P(3)+. . . (23)
where the superscript denotes the order of the nonlinear effect, and the subscripts i, j, k, l each indicate a Cartesian component 1, 2, 3 linked to the outgoing (Pi) and incident (Ej, Ek, El) fields (the subscripts will be omitted for clarity). For linear effects described by
Equation22(corresponding to P(1)), vector components can often be reduced to a scalar form. However in nonlinear optics, the efficiency of a process occurring generally requires consideration of the relative orientations of the incident and output field vectors, known as phase-matching conditions.
CARS and SRS processes in particular are mediated by the third-order nonlinear susceptibility (χ(3)) in Equation23. The three electric field terms associated withχ(3)in Equation23originate from two incident laser beams, usually labeled the pump frequency (ωp) and the Stokes frequency (ωs), such that the total third order polarization is P(3) =χ(3)EpEsEp. It should be noted that these
naming conventions vary, with the secondωpin the CARS process orωsin SRS sometimes being labeled the "probe" beam. Both
CARS and SRS processes involve coherently driving the vibrational modes of molecules within a sample volume using these two input beams.
CARS is a parametric process, which means the initial and final real vibrational states of the material in the process are identical, and energy is only exchanged between the input/output fields, not the medium. Conversely, SRS is non-parametric meaning the fields exchange energy with the medium in a dissipative process. Another way of thinking about this is that CARS is analogous to other scattering processes such as Rayleigh and spontaneous Raman, whereas SRS is more of a nonlinear version of absorp-tion/emission (loss/gain) involving Raman transitions. Introductory CARS and SRS theory focusing on the physical processes will be introduced in this section (more rigorous mathematical descriptions can be found in [38–40]). Specific information on CARS and SRS for microscopy will be introduced later in the corresponding application Sections4.3and4.4.
2.5.1. CARS
CARS is a special case of the more general four-wave mixing nonlinear process, and was first reported in 1965 by Maker and Tehrune (where it was then termed “Raman laser action”). There it was described as the change in the refractive index of the medium (i.e. the introduction of a nonlinear contribution to the dielectric susceptibility) at one frequency, due to waves at a different frequency[41]. The authors were able to demonstrate CARS in liquid benzene, as seen in Figure3(a) which highlights the angular-dependent scat-tering geometry for a collinear or weakly focused excitation source (this condition can be relaxed in a microscope using high NA objectives).
The left half of the resonant CARS Jablonski diagram in Figure2(g) is similar to a spontaneous Stokes-Raman process, except that the second transition now predominantly results from a second input (Stokes) beam. This can be viewed as a driving force at the beat-frequency generated by the two input beamsωp−ωs, which when tuned to be resonant withωvib, will coherently drive
molecular vibrations - resulting in the modified refractive index at this frequency mentioned above. The molecules collectively in this vibrational state undergo anti-Stokes Raman scattering excited by the beam atωp, producing light at the anti-Stokes frequency
ωCARS=2ωp−ωs, which can be detected by standard spectroscopic methods.
As the radiation atωCARSis generated coherently, contributions from the molecules vibrating in phase will constructively interfere,
resulting in orders of magnitude stronger signals compared with spontaneous Raman processes. A related process called coherent Stokes-Raman scattering (CSRS) is possible, producing a frequencyωCSRS=2ωs−ωp. However this process is not often studied as
ωp-ωs-ωvib (cm-1)
(a)
(b) kp kp
kCARS
ks
CARS resonant phase matching condition
[image:11.612.68.543.49.180.2](d) (c)
Fig. 3. CARS process.
(a) First observation of CARS (modified from [41]) in benzene (in our notationωp =ωL,ωvib=Δbwhich is the 992 cm−1benzene
Raman mode).
(b) Phase-matching condition for CARS with twoωpand oneωsphoton, demonstrating angular dependence of input and output
field directions (see angular distribution in (a)).
(c) Theoretical dependence of the resonant and non-resonant intensities (and their ratio) on laser pulse-width used, and (d) the cor-responding effect on CARS lineshape distortion (theoretical model using data from polystyrene 1601 cm−1band[42]). Reprinted (adapted) with permission. Copyright 2004 American Chemical Society.
As fields of different frequencies are involved in the resonant CARS process, the matching of the corresponding wave-vectors (|ki|=n(ωi)ωi/c, where n(ωi)is the refractive index and i=p, s, CARS) must be considered. As the CARS process requires
2ωp−ωs−ωCARS=0 (24)
for energy conservation, the momentum must also be conserved resulting in the phase–matching condition for the field k-vectors. This is shown schematically in Figure3(b), and can be expressed as
Δk=|2kp−ks−kCARS|=0 (25)
where the k-vector subscripts correspond to the frequencies of each field involved. Figure3(b) shows non-collinear excitation for kp and ks, which is in fact necessary because of dispersion (the fact that n varies withω)[39]. Explicitly, we need both equation24and 25to be satisfied, which is not possible as collinear excitation implies the latter becomes 2npωp−nsωs−nCARSωCARS =0, which
is only compatible if the refractive indices are the same at different frequencies (this will not generally be true even for an isotropic medium). This suggests the need for angle-dependent excitation and/or detection to be used in general. This was observed for the first CARS measurements shown in Figure3(a) (reproduced from Maker and Terhune[41]), where a single input pump beam was used, which generated an amplified Stokes field within the sample, leading to CARS scattering at various angles. However, this condition can be relaxed such thatΔk=0 for microscopic measurements by considering the shorter length scale of the vibrational coherence (Δk<π/l, where l is the typical sample length), and using collinear beams which are tightly focused (e.g. by a high-NA microscope objective) resulting in a distribution of incident directions for kpand ks[42].
One of the major drawbacks to CARS is the contributions generated by unwanted processes which are also possible with the incident light fields that are used. These can be seen when writing the third order susceptibility as
χ(3)(ω
vib) =χ(RR3)(ωvib) +χ(NR3) +χ(
3)
TP (26)
whereχ(RR3)represents the Raman-resonant susceptibility whenωp−ωs=ωvib(which, by itself, would produce a normal lineshape),
χ(NR3) represents non-resonant four-wave mixing contributions which are possible due to the electronic background allowing pro-cesses mediated by a virtual state atωp−ωs instead of a vibrational resonance, andχ(TP3)is a two-photon enhanced non-resonant
contribution which occurs when 2ωpis close to an electronic energy level. From the form of Equation23it can be seen that the CARS
signal intensity will follow
ICARS(ωvib)∝|χ(3)(ωvib)|2·Ip2·Is (27)
where Ipand Isdenote the pump and Stokes beam intensities respectively. Due to the dependence of ICARS(ωvib)on|χ(3)(ωvib)|2,
there will be interference between the different contributions ofχ(3)(ω
vib) which create distorted lineshapes such as those seen
2.5.2. SRS
SRS was first observed during the development of the ruby laser in 1962 by Woodbury and Ng[43]. Their instrument, shown schemati-cally in Figure4(a), produced an additional emission line at the Stokes-shifted Raman frequencies of the nitrobenzene cell in the cavity (in the absence of the sample cell)[44]. This emission was too intense to be due to incoherent (i.e. spontaneous) Raman scattering, and was attributed to stimulated Raman gain (SRG) in the ruby laser cavity via the 1344 cm−1nitrobenzene mode[45,46]. This original experiment differs in that only one incident laser field (ωp) is applied, and the second (ωs) was generated due to SRG in the laser
cavity, whereas modern SRS utilizes two applied fields withωp−ωstuned to match a particular vibrational mode.
The use of two incident fields atωpandωsis the key difference between spontaneous and stimulated Raman processes. In terms
of the photon population numbers, in spontaneous Raman the single incident excitation field has many photons, while the Stokes field has zero photons before the Raman transition, and one after. In SRS, both theωpandωs fields initially contain large photon
populations, which will induce vibrational coherence in the material if it has a level atωp−ωs. This leads to an increased rate of
Raman transitions involvingωp andωs, which can be detected by changes in their respective photon numbers, i.e. the measured
beam intensities (loss inωp, gain inωs). Furthermore, as the SRS process does not generate any photons at frequencies different from
ωpandωs, the phase-matching condition is automatically satisfied as shown in Figure4(b).
Expressions for the magnitude of gain or loss are dependent only on theχ(RR3)(ωvib) component from Equation26. The non–
resonant contribution is not present as SRS detection is based on measuring intensity changes at pump and Stokes frequencies, not spectroscopic detection at the CARS frequency. As the CARS nonresonant background originates from a parametric generation process (no energy exchanged with the medium), this would not be observed in such intensity-based detection schemes. However other nonlinear optical processes such as cross-phase modulation, transient absorption and photothermal lensing can interfere with the phase-sensitive SRS detection, though are not typically as detrimental as the non-resonant background in CARS microscopy[47]. Several approaches have been demonstrated to reduce these contributions, such as spectral modulation of the lasers to switch on and off the Raman resonance in single-wavenumber SRS [48] and using polarization modulation combined with standard amplitude modulation for hyperspectral SRS[49]. Thus the interaction of the induced pump/Stokes nonlinear polarizations with the incident pump/Stokes fields leads to intensity gain (ΔIs) and loss (ΔIp) given by
ΔIs∝Im[χ(RR3)(ωvib)]·Ip·Is (28)
for SRG of the Stokes field, and
ΔIp∝−Im[χRR(3)(ωvib)]·Ip·Is (29)
for stimulated Raman loss (SRL) in the pump field[22,23]. These intensity differences are typically small compared with Ipand Is.
It should be noted that the SRG/SRL signals will also scale linearly with N. The phase-matching condition is also automatically satisfied as opposing kpvectors experience the same n(ωp)(similarly for the opposing ksvectors at n(ωs)).
The cumulative effect of the SRG/SRL can be observed over large distances in simple crystals and liquids[43], but would be too small to directly measure from microscopic samples due to laser intensity noise. To circumvent this, Owyoung and Jones demon-strated SRS spectroscopy using intensity modulation techniques for detection by lock-in amplification[50]. They were able to measure the 992 cm−1SRG band of liquid benzene with high spectral resolution, free of the artifacts seen in CARS due to non-resonant back-groundsee Figure4(c). Extension of this idea to high-frequency modulation of pulsed laser beams was shown in the past decade by Xie and colleagues, who have demonstrated sufficient SRG/SRL detection sensitivity to measure microscopic biological samples (either SRL/SRG of the pump/Stokes fields can be used for generating image contrast by SRS, and provide similar sensitivity to one another[22]). This will be discussed further in Section4.4.
2.6. Enhanced Raman Scattering
Spontaneous Raman scattering is very weak relative to the excitation radiation and other scattering processes, with roughly one in 1×10⁸excitation photons undergoing Raman scattering, depending on the particular vibrational mode (see Section2.3). This typically limits the sensitivity of Raman spectroscopy of biological materials to roughly≈0.1−1μM concentrations or greater.
In order to attain measurements with improved sensitivity, the Raman scattering process must be aided by an enhancement mechanism. Resonance Raman can provide some enhancement, but depends on the absorption profile of the particular material being studied. By chance, Fleischmann et al. discovered a huge enhancement of Raman scattering from pyridine when molecules were adsorbed on a rough silver electrode in 1974[51], the dominant mechanism for which was attributed to a surface–plasmon– mediated electric field enhancement[52]. This came to be known as surface-enhanced Raman scattering (SERS). SERS experiments utilize the localized electric-field enhancement from many nanoparticles within the sampling volume. The instrumentation for the actual Raman spectra acquisition is then much the same as standard Raman spectrometer; it is the sample itself which is modified to include the enhancement particles. Tip-enhanced Raman spectroscopy (TERS) is an extreme variant of SERS in which only a single nanoparticle is used at the apex of a scanning tip. This particle can then be accurately manipulated in 3D, allowing enhanced Raman measurements with diffraction-limit-breaking nanoscale resolution.
The basic theory for the enhancement mechanism in SERS and TERS relies on the optical properties of metallic nanoparticles, primarily gold (Au) and silver (Ag) nanoparticles. In metals, the negative ’sea’ of free electrons will oscillate about the lattice of positive nuclei in response to an external fieldEsee Figure5(a), following the Drude-Sommerfeld model equation
me∂∂x
t2+meΓ
∂x
∂t =eE=e· ne 0(1−)x
k
p
-k
p
k
s
-k
s
[image:13.612.111.507.47.276.2]SRS automatic phase matching
Fig. 4. SRS process.
(a) Schematic of the ruby laser in which SRS was first observed by Woodbury and Ng (reproduced from “The Stimulated Raman Effect” by N. Bloembergen, American Journal of Physics 35(11), 989 (1967) with the permission of the American Association of Physics Teachers[44]). The nitrobenzene Kerr cell produced stimulated emission at the Stokes-shifted frequency.
(b) Automatic phase matching inherent in SRS.
(c) SRG spectrum of liquid benzene (modified from Owyoung and Jones[50]) .
where we have used the macroscopic polarizationP= nex=0(1−)E to link the applied fieldE to the displacement of the free
electronsx. Here, e refers to electron charge, meis the electron effective mass,Γis a damping term equal to the Fermi velocity over
the electron mean-free path (i.e.Γ = vf/le),0is the permittivity of free space, andis the relative permittivity of the metal. For an oscillating solution of the displacementx, the solution to this equation (upon re-arranging forwhich we now write as a function of frequency,ω) is
(ω) =1− ω
2
p
ω2+Γ2+i
Γω2
p
ω(ω2+Γ2) (31)
whereω2p = ne2/0me is called the plasma frequency - the natural frequency of the free electrons for a particular metal, known
as a bulk plasmon. Empirical values for the permittivity (or equivalently the complex refractive index) can be found tabulated in various references[53–56]. For anE in the visible region of the spectrum, the real part of(ω)will be negative, seen in Figure6(a), resulting in rapid attenuation of the field through the material (as n = (ω)will have a significant imaginary component) at some characteristic length usually known as the skin-depth. However, if dimensions of the material are much smaller than this skin depth,E can be considered uniform (typically below 100 nm, depending on the metal). For small spherical particles of metal, the
plasmon oscillation of the electron sea will now be highly localized, resulting in changes from bulk behavior. It can be shown[57–59] that for such a particle of diameter a surrounded by external medium of relative permittivity2, the particle has an induced dipole p = 2α(ω)E where the polarizability is
α(ω) =4π0a3((ωω) +)−22 2
(32)
which will become large whenever near resonance ( (ω) ≈ −22). The green line in Figure6(a) shows this value for water (n =
(ω) = 1.33), with the points where it crosses(ω)for gold and silver showing their expected resonant wavelengths conveniently placed in the visible spectrum. The scattering and absorption cross-sections can then be written in terms of the polarizability as
σscatt= k
4
6π20|α(ω)|
2 (33)
and
σabs= k
0Im(α(ω))
(34)
by considering the ratio of the total radiated power with incident power, and internal losses in the medium respectively[57]. Fig-ure6(c) and (d) shows the expected behavior for σscatt andσabs using experimental and theoretical data for (ω), showing the
E k
Fig. 5. Illustration of plasmonic near-field enhancement of noble metal nanoparticles.
(a) An incident E field close to the plasma frequency of the metal will cause the free electrons to oscillate about the positive fixed nuclei. This causes an oscillating dipole at the plasma frequency in the nanoparticle.
(b) The time-averaged electric near-field due to the free electrons will decay away from the surface of the metal, with hot-spots loca-tions determined by the polarization of the incident field (here the simplest case of a dipolar mode for a sphere is shown).
(c) When two plasmonic nanoparticles as within the near-field distance, but sufficiently separated to avoid charge transfer or tun-neling, an increased "gap-mode" enhancement is observed.
6(e), and match the results in Figure6(c) and (d) remarkably well. The inset photographs also visually highlight the drastic change in appearance of the metals when they are reduced in size (first discussed scientifically by Michael Faraday in 1857[60]). It should be noted that the absorption component is most important for near-field enhancement, and will typically dominate for smaller particle size.
Fig. 6. Optical properties of gold (red lines and markers) and silver (blue lines and markers). Data in (a)-(d) corresponds to exper-imentally measured values for the dielectric constant (◦[53],[54],∗[55],[56]) and a theoretical model from the appendix of Le and Etchegoin[59] (solid line).
(a) Real part of the gold and silver dielectric constants. The green line shows the value of -22for water (n=1.33), which (for a neg-ligible imaginary part of the dielectric constant) will indicate the position of the polarizability resonance when it crosses the Re() line.
(b) Imaginary part of the gold and silver dielectric constants.
The scattering (c) and absorption (d) cross sections calculated from the dielectric constant in (a) and (b) for 10 nm diameter particles surrounded by water.
(e) Experimental extinction (absorption + scattering) spectra measured using a UV-NIR spectrometer for gold and silver nanopar-ticles approximately 10 nm in diameter immersed in water. The inset shows photographs of the measured samples (Note: value of optical density (O.D.) is dependent on the particle solution concentration).
These plots also highlight the performance of silver and gold, with Im((ω))in Figure6(b), which relates to the internal losses in the material, being closer to zero for silver than in gold. This is particularly noticeable in gold, where intra-band excitation of bound electrons occurs at smaller wavelengths in addition to the driving of the free electrons (which is also the reason for the different colors of gold and silver at a macroscopic level). While it can be seen that silver is more ideal in terms of these parameters, gold is more popular due to other properties such as stability in ambient conditions and ease in synthesis procedures. Other metals also exhibit plasmons, but tend to have much weaker absorption, with frequencies in difficult spectral regions for laser excitation.
It should also be noted that in the current theory, changing the diameter of the particle will only change the magnitude ofσscattand
σabs(absorption dominating scattering for smaller particles), not the position of the plasmon resonance. This is not true in reality, and
mean-free path which for these metals will be larger than the particle dimensions, which can be thought of as the particle having a size dependent dielectric constant ((ω) → (ω, a))[61]. Additionally, larger and anisotropic particles will produce additional extinction bands due to higher-order multipole and directional/polarized plasmons respectively. These features can actually be used for engineering nanoparticles with tailored excitation profiles[62–65].
At this stage, the properties of these plasmonic nanoparticles can be exploited in a variety of ways for a multitude of sensing applications. Their specific use in Raman spectroscopy comes as a result of the greatly enhanced electric field very close to the particle surface when it is being driven close to resonance by an applied EM wave (this location is often called the SERS ’hot-spot’). This enhanced field is evanescent, i.e. exponentially decaying intensity away from the surface as shown in Figure5(b), where the decay length z is typically the order of tens of nanometers. Thus the analyte must be sufficiently close to experience noticeable Raman enhancement.
As the spontaneous Raman scattering process involves two dipole transitions (see Figure2), the amplified field associated with each one results in approximately|E|4enhancement factor dependence, which is the major advantage of SERS. For a modest increase in the local field at a nanoparticle surface, the Raman scattering can be enhanced by as much as×108 for single silver particles. This can be increased further towards pico-molar sensitivity (≈ ×1014−1015[66]) by considering coupling between nanoparticles, allowing single-molecule sensitive measurements[66–68].
It should be understood that the|E|4 dependence is an approximation, and enhancement can vary depending on several other parameters, which complicates interpretation for particular SERS configurations. This includes effects from excitation polarization relative to analyte which can modify Raman selection rules (often producing SERS spectra different to spontaneous Raman spectra for the same material), variation of the plasmon absorption (and by association the enhancement) profile in the Raman spectral window, and chemical-enhancement effects (involving charge transfer between nanoparticle and analyte).
To summarize, a good Raman–enhancing nanoparticle must fulfill several criteria. The laser wavelength being used on the Ra-man instrument should be close to a particle absorption resonance to maximize the near-field amplitude for enhancement. The analyte/label must be within the hot–spot set by the particle shape/size and excitation geometry. As SERS measurements usually measure many enhancing nanoparticles in a single acquisition, it is also preferable to have a nanoparticle population with as uniform a size/shape distribution as possible.
3. RAMAN SPECTRA OF BIOLOGICAL MOLECULES
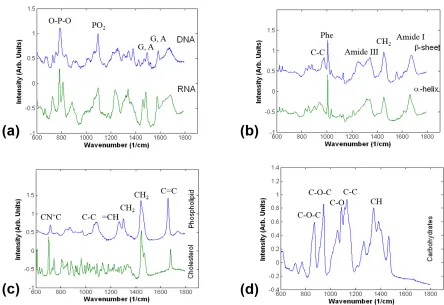
Many biological molecules contribute to the Raman spectra of cells and tissues. Most common spectral features are caused by vibrational modes in lipid, protein, and nucleic acid molecules.
Raman spectra of biological samples are divided into three spectral regions. The fingerprint region covers the range between 600 and 1800 cm−1. This region gets its name from the diversity of sharp, localized spectral features that give molecules unique “fingerprints.” These molecular fingerprints can allow sample classification and chemometric analysis. Vibrations contributing bands to this region usually involve somewhat larger atoms (e.g., carbon, nitrogen, oxygen) or complexes of several hydrogen atoms.
The fingerprint region of the Raman spectra of common bio-molecules is shown in Figure7. The majority of this section will describe the most dominant components of these spectra in detail.
Most bonds involving independently vibrating hydrogen atoms vibrate with much higher energies than other bonds. The small mass of hydrogen causes a smaller reduced mass for the whole bond (see Equation3). These higher energy vibrations occupy the region from 2500 to 3400 cm−1, which is known as the “high wavenumber region” of a Raman spectrum. Vibrational modes contributing bands to the spectral region will be discussed in Section3.5.
Between the fingerprint and high wavenumber regions lies the “silent region.” This spectral region from 1800 to 2500 cm−1 is mostly empty of contributions from biological molecules, although there are some exceptions including alkynes (see Section4.10).
Very large, usually non-biological atoms can contribute Raman bands in the “low wavenumber region” below 600 cm−1. Any intersection of these bands with studies of biological samples will be very application dependent, so we will not provide a general treatment here.
3.1. Nucleic Acids
3.1.1. Molecular Structure
Nucleic acids, including DNA and RNA, are present in every organism. In eukaryotes, nucleic acid is the dominant material in the cell nucleus. The structure of a nuclic acid can be considered in two parts, the backbone and the nucleotide bases. The molecular structure of a nucleic acid backbone is shown in Figure8(a). The difference between RNA and DNA is in the OH group shown in parentheses. This OH in RNA is replaced by an H in DNA. This structure is repeated in a chain with a nucleotide as each link. The bases attach at the location marked as B. RNA usually exists as one such chain while DNA is almost always double-stranded.
Figure8(b) shows the structure of individual nucleotide bases. Thymine is shown bonding to its pair adenine while cytosine is shown with its pair guanine. In RNA, thymine is replaced by uracil, which differs in structure from thymine by replacing the CH3in parenthesis with a single hydrogen atom. These bases attach to their respective nucleic acid backbone at the locations marked as B.
3.1.2. Major Raman Bands
Fig. 7. Raman spectra of biological materials in the fingerprint region between 600 and 1800 cm−1. Spectra are shifted vertically for clarity.
Fig. 8. (a) Structure of a nucleic acid molecule. The OH in parenthesis is only present in RNA. It is replaced by an H in DNA. The B represents the base: adenine, thymine, guanine, cytosine, or uracil. The dots connect the CH2of one nulceotide to the O-P-O back-bone of the next.
[image:16.612.75.519.61.366.2](b) Structure of nucleotide bases. The CH3in parenthesis is replaced by an H in uracil. The B represents where the base group con-nects to the nucleic acid backbone
Fig. 9. Vibrational modes associated with most prominent Raman bands corresponding to the backbone in nucleic acids. (a) PO−2 symmetric stretching associated with the band near 1095 cm−1.
Band location ( cm−1) Assignment References
669 Thymine, Guanine [69]
723-728 C-N head group in Adenine [69–74]
763 Pyrimidines (Cytosine, Thymine, Uracil) [74–76]
782-792 Uracil, Cytosine, Thymine ring breathing; O-P-O symmetric stretch
[69,70,72,73,76–79]
813 RNA, A-type DNA [77,80,81]
828 O-P-O [69,72,73]
898 Adenine, nucleotide backbone [69,70,72]
1084-1095 PO2stretch [69,71,77,82,83]
1173-1180 Cytosine, Guanine, Adenine [79,84,85]
1252-1254 Cytosine, Guanine, Adenine [69,70,72,84,86]
1304-1342 Adenine, Guanine [69,70,72,73,78,84,87–91]
1369 Thymine, Adenine, Guanine [70,72]
1487 Guanine, Adenine [72]
1510 Adenine [72]
1578 Guanine, Adenine [69,72]
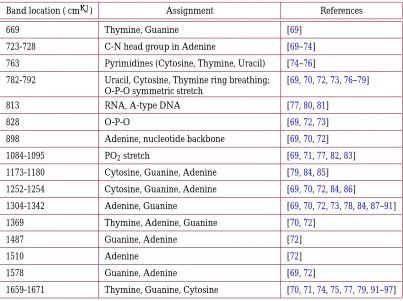
[image:17.612.108.511.44.345.2]1659-1671 Thymine, Guanine, Cytosine [70,71,74,75,77,79,91–97]
Table 3. Assignments for major Raman bands associated with nucleic acids.
Table3lists other Raman bands originating from nucleic acids. Most of these bands are associated with vibrations of the individual nucleotide bases. Of these bands, the most visible are often the bands near 1330 and 1575 cm−1, both of which are assigned to adenine and guanine.
3.2. Proteins
3.2.1. Molecular structure
Proteins are responsible for a myriad of structural and functional roles in living systems. Every protein is assembled from chains of amino acid building blocks, of which there are 21 main types. All amino acids consist of a backbone unit of Cα−C(=O) =N which
repeats along the polypeptide, and a side-chain group attached to the alpha-Carbon (Cα), which distinguishes the amino acids from one another (usually denoted R).
For a chain of amino acids, the interaction between side-chain groups and the backbone determines the secondary structure, i.e. how the 1D backbone chain will be arranged and oriented. There are a several mechanisms for these interactions, as different side-chains can either be charged, polar, hydrophobic or contain certain atoms such as sulfur (for the amino acid cysteine) which can form disulfide bonds. These interactions also usually sensitive to the solvent and pH environment which surrounds the protein.
The two most common types of secondary structures in proteins areα−helices and β−sheets (see Figure10(c) and (d)), which usually occur within a single protein multiple times, leading to unique higher-order “tertiary”, or globular, structure.
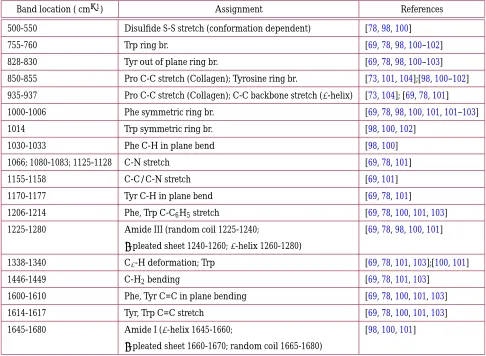
3.2.2. Major Raman bands
Since all proteins share the same amino-acid backbone molecular structure, they all contain a class of vibrations called the Amide modes. These modes are composed of complex combinations of motions from different parts of the backbone, and thus are not usually referred to by a specific chemical bond, but by their spectroscopic label of Amide vibrations (this terminology is shared with IR and NMR spectroscopies). Within this class of vibrations, the Amide I and Amide III modes (see Figure11) are the most readily observed in Raman spectroscopy (Amide II, and IV-VII are observed in IR more strongly than Raman spectroscopy, Amide A and B overlap with water bands)[98]. The relatively large range of frequencies of the Amide I and III vibrations (see Table4) is due to the varied local molecular environment in which each backbone unit will be in due to the secondary structure. For living systems such as cells or tissues, typically many different proteins with a mix of secondary structure will be measured in one sampling volume, resulting in broad amide bands, thus it is usually impossible to identify the presence of specific proteins directly.