1 Accepted 21 May 2018
International Journal of Mechanical Sciences
Ref: SUBMIT2IJMS_2017_2141_R1
Extracting Elastic-Plastic Properties from Experimental Loading-Unloading Indentation Curves using Different Optimization Techniques
Ji Jun Kang, Adib A. Becker*, Wen Wu and Wei Sun
Faculty of Engineering University of Nottingham
UK
Highlights
Elastic-plastic material properties are extracted from indentation tests
Three numerical optimisation techniques are applied with Finite Element Analysis (FEA)
Optimised solutions are compared to the corresponding experimental test data
Applicability and limitations of Finite Element (FE) and optimisation techniques are evaluated
Graphical Abstract
2
Abstract
This work is focused on the determination of elastic-plastic material properties from indentation
loading-unloading curves using optimisation techniques and experimental data from instrumented
indentation tests. Three different numerical optimisation methods (namely, FE analysis, dimensional
mathematical functions and simplified mathematical equations approaches) have been used to
determine three material properties; Young’s modulus, yield stress and work-hardening exponent. The
predictions of the material properties from the three approaches have been validated against the values
obtained from uniaxial tensile tests and compared to the experimental loading-unloading curves. In
general, the elastic-plastic material properties predicted from these three proposed optimisation
methods estimate the Young’s modulus to within 6% and the yield stress and work-hardening exponent
to within 12%, compared to the values obtained from the uniaxial tensile tests.
Keywords:
Indentation; Finite Element Analysis; Optimization, elastic-plastic, material properties
1. Introduction
Indentation techniques have been used for mechanical characterisation of materials for decades due to
their non-destructive nature and applicability to small sized samples. Figure 1 shows a schematic illustration of an indentation testing system [1] where a downward load is applied to the indenter to
penetrate the test sample, and the reaction force and the displacement at the indenter tip are recorded
during the test. Different approaches have been proposed to obtain the mechanical material properties,
such as Young’s modulus (E), yield stress (𝜎𝑦) and work-hardening exponent (n), from the indentation
data, see e.g. [2-12]. In many studies, there is only one interpreting method involved and it is usually
performed using numerical simulations, see e.g. [4, 8]. Experimental indentation tests have been
carried out for different materials using different indenter geometries and compared to the
3
Figure 1. Schematic illustration of a typical instrumented indentation system [1].
To analyse the material response of an indented specimen, the effects of the indenter geometry on the
prediction of the material properties have been investigated by Kang et al [13] using the commercial
FE software ABAQUS with new optimisation approaches combining three different methods: (i)
Combined FE Simulation and optimisation [14] (ii) Combined dimensional analysis and optimisation
[15] and (iii) Optimisation using simplified equations [16]. However, the previous optimisation
techniques [14-16] have been mainly based on simulated target FE loading-unloading curves, rather
than curves obtained from experimental tests. It has been found in a previous study [14] that
determining elastic-plastic properties from indentation data using only FE simulation and optimisation
is less accurate when it is based on experimental indentation data with random errors. Therefore, it is
worth extending the investigation to the other two developed optimisation approaches to evaluate their
feasibility and robustness.
This study highlights the extraction of elastic-plastic properties from experimental instrumented
indentation loading-unloading curves, using the three developed optimization techniques. The general
performance and the applicability of these techniques are evaluated and some limitations and areas
that need to be explored in the future are addressed. In this study, the experimental loading-unloading
4
To investigate the mechanical properties of materials that exhibit a power law hardening, which is
generally assumed to characterise the work-hardening plasticity behaviour of metals including steels,
the stress-strain relationship is given as follows:
σ = { Eε, ε ≤
𝜎𝑦
𝐸
K𝜀𝑛, ε >𝜎𝑦
𝐸
(1)
where the coefficient K is given by:
K = 𝐸𝑛𝜎
𝑦1−𝑛 (2)
2. Nanoindentation and tensile experimental data
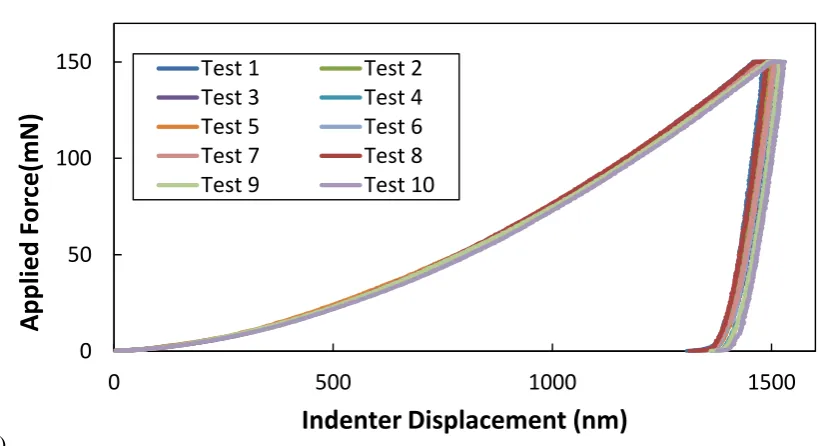
Room temperature nanoindentation tests with a Berkovich indenter have been performed in [17] on
P91 steel specimens with maximum loads of 150mN, 200mN as shown in Figure 2. Ten indentation tests have been completed at each load level to provide accurate indentation curves. The details of the
nanoindentation tests are presented in Table 1 where the loading time and the unloading time were set at 20s and 10s respectively. Young’s modulus of the P91 steel at room temperature can be obtained
based on the Oliver-Pharr method which uses the unloading part of the indentation curve to obtain
[image:4.595.64.474.533.756.2]Young’s modulus [19]. The average values of Young’s modulus at each load level are presented in
Table 2.
(a)
0 50 100 150
0 500 1000 1500
App
lied
For
ce(m
N)
Indenter Displacement (nm)
Test 1 Test 2
Test 3 Test 4
Test 5 Test 6
Test 7 Test 8
5
(b)
[image:5.595.76.480.76.292.2]Figure 2. Experimental loading-unloading curves at (a) 150mN and (b) 200mN load levels using a Berkovich indenter [17].
Table 1 Details of the nanoindentation tests
Material Geometry of
indenter Temperature Applied Force
P91 steel Berkovich indenter Room (23°C) (100mN, 150mN and 200mN)
Table 2 Young’s modulus from nanoindentation tests based on the Oliver-Pharr method.
Load (mN) 100 150 200
Young’s modulus (GPa) 251 253 244
Uniaxial tensile tests at room temperature (23°C) on P91 steel specimens have also been performed [18]
to obtain the stress-strain uniaxial data. P91 true stress-true strain curve is shown in Figure 3 where Young’s modulus (E) is 215 GPa and the yield stress (𝜎𝑦) is 515 MPa at a strain of 0.0033. A power
law hardening, described by equations (1) and (2), was assumed for the plasticity of the material. By
fitting the stress-strain data from Figure 2, the hardening exponent n was determined to be 0.136. The
0 50 100 150 200
0 200 400 600 800 1000 1200 1400 1600 1800
App
lied
For
ce
(mN)
Indenter Displacement (nm)
Test 1 Test 2
Test 3 Test 4
Test 5 Test 6
Test 7 Test 8
[image:5.595.58.543.586.630.2]6
material properties obtained from the uniaxial tensile stress-strain data can be used to validate the
optimised results based on the three different optimisation techniques. It is interesting to note that
Young’s modulus values for P91 steel obtained from the nanoindentation tests using the Oliver-Pharr
[image:6.595.69.526.195.458.2]method [2] are approximately 14% higher than those from the uniaxial tensile tests.
Figure 3. True stress-strain curves for the P91 steel specimen.
3. Applying three different optimisation methods to experimental indentation
loading-unloading curves
3.1 Optimisation Method 1:Combined FE simulation and optimisation algorithm approach
A combined FE simulation and optimisation approach has been developed to determine the
elastic-plastic material properties in a previous study [14], in which the simulated FE loading-unloading
curves have been used as the target loading-unloading curves. In other studies (e.g. [20]), indentation
tests results have been used together with FE simulations to determine the mechanical material
properties, but the results are less accurate compared to the purely numerical studies [20]. The
experimental nanoindentation tests in this study have been performed using a Berkovich indenter with
different applied loads. 3D FE indentation models of the Berkovich indenter have been implemented
0 100 200 300 400 500 600 700 800
0 0.02 0.04 0.06 0.08 0.1 0.12 0.14 0.16 0.18 0.2
Tr
ue
st
res
s
(MP
a)
7
using the ABAQUS FE software with four-node linear tetrahedron elements (C3D4 in ABAQUS). A
high element density was implemented in the vicinity of the indenter tip to model the steep stress
gradients in this region, as shown in Figure 4. Boundary conditions were applied in the x and y directions to prevent rigid body motion. The depth and diameter of the bulk material are 1.5 mm and
10 mm respectively.
[image:7.595.184.412.212.405.2]
Figure 4. 3D FE mesh around the contact region of a 3D Berkovich indenter.
3D indentation FE models have been used with the maximum applied forces of the Berkovich indenter
of 150mN and 200Nm. The simulation has been carried out in two distinct steps, a loading step and an
unloading step. In the first step, the maximum load has been imposed and the rigid indenter moved
downwards along the vertical direction penetrating the foundation up to the maximum specified load.
In the second step, the indenter is moved upwards to the initial position.
Previous optimisation results in [15] and [16] showed that using just a single loading-unloading curve with a single indenter geometry could not guarantee arriving at a unique set of elastic-plastic material
properties since optimisation methods may come up with more than one set of material properties that
result in the same indentation loading-unloading curve. Therefore, to compare with other optimisation
methods, two different loading-unloading curves based on the same Berkovich geometry but with two
different applied loads (150 mN and 200 mN) are used as two (dual) loading-unloading curves. To
determine the elastic-plastic material properties, loading-unloading curves for tests 3 and 7 for both
8
close to the average of the results of the repeated tests. As Figure 1 shows, there are some differences
between the results of the repeated tests, which indicates that nanoindentation is a sensitive testing
technique. The focus of the current study is applying the inverse optimisation method to the
experimental data from the indentation tests. The optimised results using the combined FE simulation
and optimisation algorithm approach are shown in Table 3 for test 3 and Table 4 for test 7.
The optimisation methods work by assuming an initial guess for the material properties and then
performing iterations to improve the predictions by comparing the predicted loading curves to the
actual loading curves [13-16]. The results show that optimised results are reached in about 18-38
iterations and the total number of iterations increases as the initial guess values deviate from the target
values. Young’s modulus and yield stress are generally in good agreement compared with the uniaxial
tensile test data. However, both optimised results of the work hardening exponent are approximately
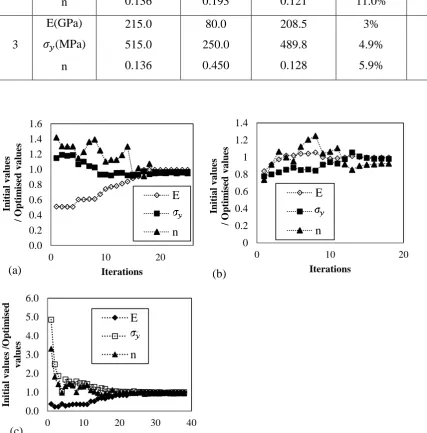
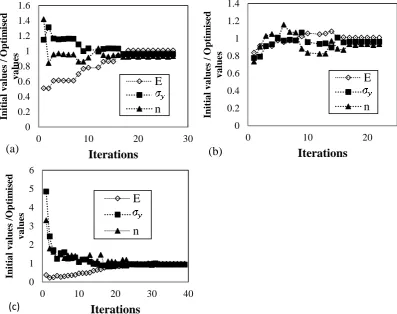
5-12% less than the value obtained from the tensile test data. Figures 5 and 6 show the convergence history of the material properties for tests 3 and 7, respectively. In general, convergence starts after 15
[image:8.595.57.552.430.669.2]iterations, with the exception of case 1(b) in Figure 5.
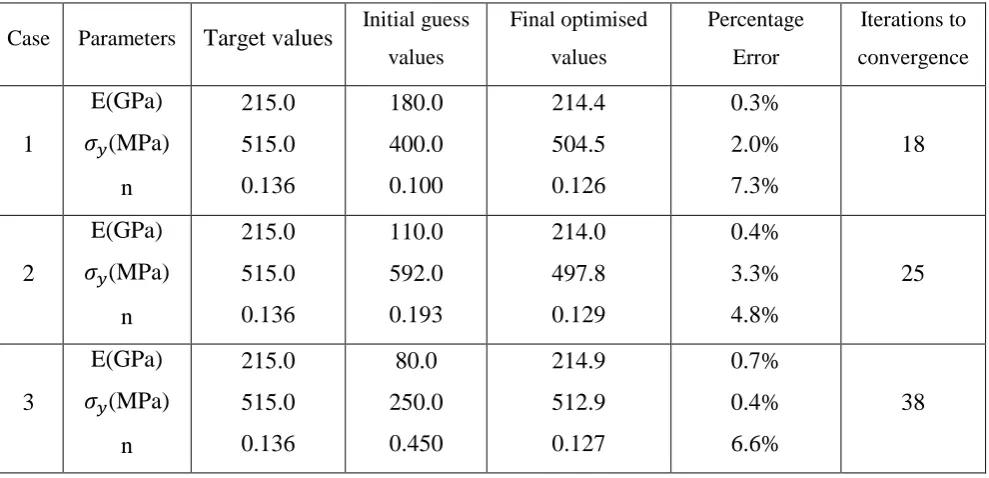
Table 3 Optimisation results with different initial values for 150mN and 200mN tests (Test 3 with Optimisation Method 1)
Case Parameters Target values Initial guess
values Final optimised values Percentage Error Iterations to convergence 1 E(GPa)
𝜎𝑦(MPa)
n 215.0 515.0 0.136 180.0 400.0 0.100 214.4 504.5 0.126 0.3% 2.0% 7.3% 18 2 E(GPa)
𝜎𝑦(MPa)
n 215.0 515.0 0.136 110.0 592.0 0.193 214.0 497.8 0.129 0.4% 3.3% 4.8% 25 3 E(GPa) 𝜎𝑦(MPa)
n 215.0 515.0 0.136 80.0 250.0 0.450 214.9 512.9 0.127 0.7% 0.4% 6.6% 38
9
Case Parameters Target values Initial guess values Final optimised values Percentage Error Iterations to convergence 1 E(GPa) 𝜎𝑦(MPa)
n 215.0 515.0 0.136 180.0 400.0 0.100 217.1 495.4 0.127 1.3% 4.5% 6.6% 21 2 E(GPa)
𝜎𝑦(MPa)
n 215.0 515.0 0.136 110.0 592.0 0.193 217.9 490.2 0.121 0.9% 3.9% 11.0% 27 3 E(GPa)
𝜎𝑦(MPa)
[image:9.595.56.484.248.682.2]n 215.0 515.0 0.136 80.0 250.0 0.450 208.5 489.8 0.128 3% 4.9% 5.9% 39
Figure 5. Optimised parameter values versus iterations for test 3
(a) case 1, (b) case 2 and (c) case 3 (Berkovich indenter using Optimisation Method 1)
0.0 0.2 0.4 0.6 0.8 1.0 1.2 1.4 1.6
0 10 20
Initia l v a lues / O ptim is ed v a lues Iterations E Y n (a) 0 0.2 0.4 0.6 0.8 1 1.2 1.4
0 10 20
In itia l v a lu es / O ptim is ed v a lues Iterations E Y n (b) 0.0 1.0 2.0 3.0 4.0 5.0 6.0
0 10 20 30 40
10
Figure 6. Optimised parameter values versus iterations for test 7
[image:10.595.60.529.562.738.2](a) case 1, (b) case 2 and (c) case 3 (Berkovich indenter using Optimisation Method 1)
Figure 7 shows the comparison between experimental loading-unloading curves and the optimised FE simulated loading-unloading curves for a Berkovich indenter with 150mN and 200mN based on the
set of the final optimised parameters in Tables 3 and 4, respectively, where a good agreement is obtained. Optimisation Method 1 generally estimates the elastic-plastic material properties well,
despite the under-estimation of the value of the work hardening exponent.
Figure 7. Comparison between Experimental curves and FE curves from final optimised results (a) Experimental test 3 (b) Experimental test 7 (Berkovich indenter using Optimisation Method 1)
0 0.2 0.4 0.6 0.8 1 1.2 1.4 1.6
0 10 20 30
Initia l v a lues / O ptim is ed v a lues Iterations E Y n (a) 0 0.2 0.4 0.6 0.8 1 1.2 1.4
0 10 20
Initia l v a lues / O ptim is ed v a lu es Iterations E Y n (b) 0 1 2 3 4 5 6
0 10 20 30 40
Initia l v a lues /O ptim is ed v a lues Iterations E Y n (c) 0 50 100 150 200 250
0 500 1000 1500 2000
App li ed F or ce (m N)
(a) Indenter Displacement (nm) Experimental Test 3: 150mN and 200mN
Optimised FE modelling 0 50 100 150 200 250
0 500 1000 1500 2000
App li ed F or ce (m N)
11
3.2 Optimisation Method 2: Combined dimensional approach and optimisation
A combined dimensional analysis and optimisation approach has been developed and used to
determine the elastic-plastic material properties from loading-unloading curves, as discussed in [15].
To construct the dimensional functions, a parametric study using FE analyses with a wide range of
steel material properties and a sharp indenter has been performed. In general, the elastic-plastic
material properties may not uniquely be determined using a single indentation loading-unloading curve
[1]. Since more accurate estimated results can be obtained from more than one indentation curve,
indenters with different indenter angles were used to arrive at the dimensionless functions.
The dimensional functions used in [15] were constructed by using a representative plastic strain and a
representative stress. From the P91 true stress-strain curve in Figure 2, the representative strain value is 0.0115 which corresponds to a stress value of approximately 560 MPa.
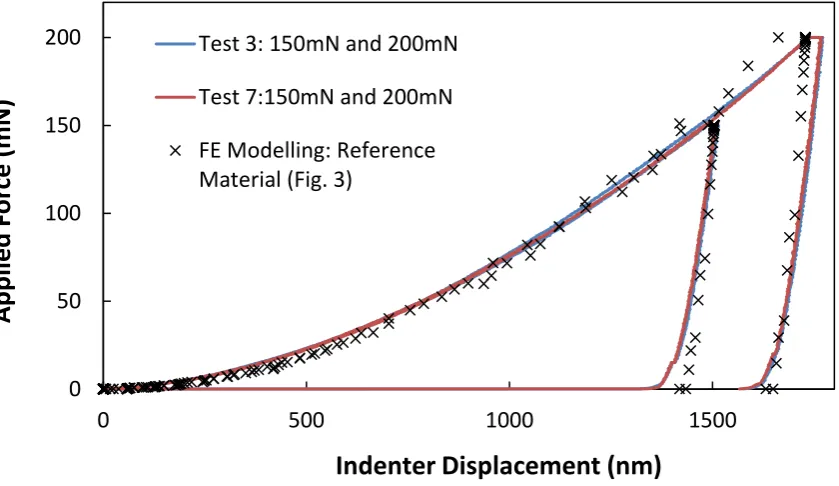
Figure 8 shows the comparison between the experimental loading-unloading curves and the FE simulated curves, based on the reference properties obtained from the uniaxial tensile tests. FE
simulated curves generally agree well with both experimental loading-unloading curves.
Figure 8. Comparison between experimental loading-unloading curves of test 3 and test 7 and FE simulated curves (Berkovich indenter using Optimisation Method 2)
0 50 100 150 200
0 500 1000 1500
App
lied
For
ce
(mN)
Indenter Displacement (nm)
Test 3: 150mN and 200mN
Test 7:150mN and 200mN
[image:11.595.71.491.417.660.2]12
Table 5 shows the optimisation results based on the experimental indentation curves for tests 3 and 7, where it is shown that Young’s modulus is estimated more accurately than the values of the yield stress
and work hardening exponent. Compared with the Oliver and Pharr’s method shown in Table 2, the predictions of Young’s modulus using this approach are more accurate. However, the errors in the
predictions of the yield stress and work hardening exponent for both experimental tests are relatively
large, with errors of approximately 10% for the yield stress and 5-10% for the work hardening
exponent.
Figure 19 shows the experimental indentation curves and the FE simulated curves based on the final optimised results in Tables 5 and 6. It is can be seen that the optimised curves agree well with the experimental loading-unloading curves despite the prediction errors of the yield stress and work
hardening exponent. This means that the dimensional functions can capture the physical relationships
between the indenter and the specimen due to the fact that the functions have been generated from FE
simulations performed with a wide range of material properties.
To demonstrate that using dual loading-unloading curves with different loads does not guarantee the
uniqueness of the optimised material properties, loading-unloading curves has been generated from
the FE analysis of five different sets of elastic-plastic properties obtained during the optimisation
procedure, as shown in Figure 10 . It can be seen that visually it is hard to distinguish the differences between the loading-unloading curves. Therefore, it is advisable to use indentation curves based on
different indenter geometries, rather than just different indentation loads. Also, this indicates that a
combined dimensional approach and optimisation algorithm could not arrive at the elastic-plastic
material properties uniquely without further background information. Therefore, to improve the
accuracy and uniqueness of Optimisation Method 2, dual loading-unloading curves with different
13
Table 5 Optimisation results with two different initial values for Test 3 (Berkovich indenter using Optimisation Method 2)
Case Parameters Target values
Initial guess values Final optimised values Percentage
Error Iteration
1
E(GPa) 𝜎0.0115(MPa)
n 215.0 560.0 0.136 180.0 400.0 0.100 203.1 628.9 0.128 5.5% 10.8% 5.9% 36 2 E(GPa)
𝜎0.0115(MPa)
n 215.0 560.0 0.136 110.0 592.0 0.193 203.1 638.5 0.122 5.5% 12.3% 10.3% 25
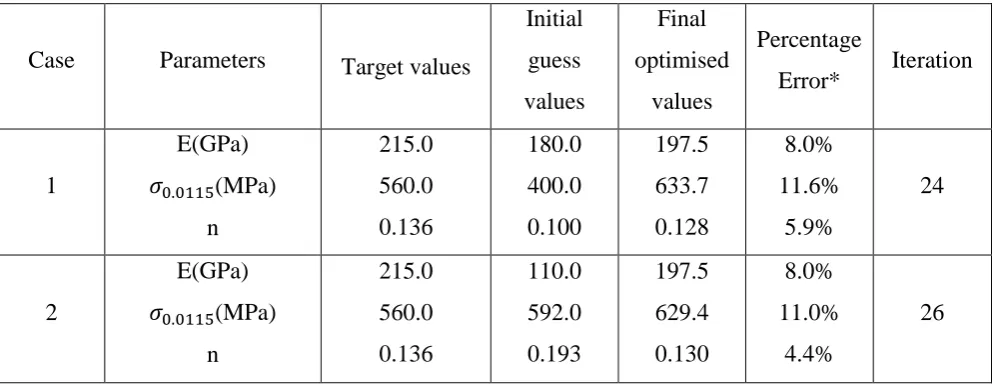
Table 6 Optimisation results with two different initial values for Test 7 (Berkovich indenter using Optimisation Method 2)
Case Parameters Target values
Initial guess values Final optimised values Percentage
Error* Iteration
1
E(GPa) 𝜎0.0115(MPa)
n 215.0 560.0 0.136 180.0 400.0 0.100 197.5 633.7 0.128 8.0% 11.6% 5.9% 24 2 E(GPa) 𝜎0.0115(MPa)
[image:13.595.64.544.118.311.2] [image:13.595.55.553.399.593.2]14
Figure 9. Loading-unloading curves for experimental tests and curves generated by FE simulation based on the final optimised values in (a) Tables 5 and (b) Tables 6 (Berkovich indenter using Optimisation Method 2)
Figure 10. Loading-unloading curves for FE simulated curves based on different elastic-plastic material properties and the target value of FEA curves (Berkovich indenter using Optimisation
Method 2)
0 50 100 150 200 250
0 1000 2000
App
li
ed
L
oad
(m
N)
Indenter Displacement (nm)
Experimental Test 3
FEA_cases_1
FEA_cases_2
(a)
0 50 100 150 200 250
0 1000 2000
App
li
ed
L
oad
(m
N)
Indenter Displacement (nm)
Experimental Test 7
FEA_cases_1
FEA_cases_2
(b)
0 50 100 150 200 250
0 500 1000 1500 2000
A
pp
lied
Load
(m
N
)
Indenter Displacement (nm) Case 1 E=202865.6, Y=552.69, n =0.172
[image:14.595.86.504.388.597.2]15
3.3 Optimisation Method 3: Obtaining material properties from indentation loading-unloading curves using simplified equations
Material properties from indentation loading-unloading curves can be obtained using simplified
equations. This has been achieved using a MATLAB nonlinear least square routine with
LAQNONLIN function to produce the best fit between the experimental loading-unloading curve and
the predicted optimised curves. Further details of the simplified equations can be found in [15].
Tables7 and 8 show the target and final optimised values based on different initial guess values of the material properties. In general, there are excellent agreements for Young’s modulus and the
work-hardening exponent, which agree within 5% with both experimental loading-unloading curves. However, the yield stress values 𝜎0.0115 are approximately 12% over-estimated. To demonstrate how
the elastic-plastic material parameters reach convergence, Figure 11 shows the forward differences (𝑋𝑡+1− 𝑋𝑡) versus iterations in case 2 in Table 8.
Table 7 Optimisation results with two different initial values for Test 3 (Berkovich indenter using Optimisation Method 3)
Case Parameters Target values Initial guess values
Final optimised values
Percentage Error for
E,𝜎𝑦,n
1 𝜎0.0115E(GPa) (MPa) n
215.0 560.0 0.136
180.0 400.0 0.100
217.0 635.9 0.140
1.0% 12.0%
3.5%
2
E(GPa) 𝜎0.0115(MPa)
n
215.0 560.0 0.136
110.0 592.0 0.193
214.7 635.5 0.140
1.0% 12.0%
[image:15.595.55.546.461.666.2]16
Table 8 Optimisation results with two different initial values for Test 7 (Berkovich indenter using Optimisation Method 3)
Case Parameters Target values Initial guess values
Final optimised values
Percentage Error for
E,𝜎𝑦,n
1
E(GPa) 𝜎0.0115(MPa)
n
215.0 560.0 0.136
180.0 400.0 0.100
217.7 638.3 0.138
1.0% 12.0%
1.4%
2
E(GPa) 𝜎0.0115(MPa)
n
215.0 560.0 0.136
110.0 592.0 0.193
218.4 635.6 0.140
1.0% 12.0%
[image:16.595.46.550.120.302.2]2.6%
Figure 11. Forward differences (𝑋𝑡+1− 𝑋𝑡) versus iterations for case 2 in Table 8 (Berkovich indenter
using Optimisation Method 3)
Figure 12 shows the comparisons between the optimised curve from MATLAB and the experimental loading-unloading curves. In addition, the final optimised material properties are fed as input into the
FE simulation to generate two FE simulated loading-unloading curves. The optimised curves from
MATLAB agree well with the experimental test curves. However, there is some deviation between the
FE simulated curves and the optimised curves from MATLAB. Therefore, accurate and unique
material properties using simplified mathematical equations cannot be guaranteed based on
loading-0.4 0.6 0.8 1 1.2 1.4
0 5 10 15 20 25 30 35
Xt
+
1
-Xt
Iterations
E
y
[image:16.595.68.542.225.523.2]17
unloading curves with different loads. It can be said that the mathematical equations may not accurately
capture the physical relationships between the indenter and the specimen. Therefore, further
investigations with more experimental tests using different indenter geometries may be required to
improve this optimisation method.
[image:17.595.57.531.166.397.2]
Figure 12. Loading-unloading curves for FE simulated curves based on the different elastic-plastic material properties from the optimised values and the target value of FE curves (Berkovich
indenter using Optimisation Method 3)
4. Discussion
Three different optimisation methods; FE analysis, dimensional analysis and a simplified empirical
method, are used to extract elastic-plastic material properties (E, 𝜎𝑦, n) from experimental loading-unloading indentation curves using a Berkovich indenter. Room temperature nanoindentation tests
have been performed on a P91 steel specimen with two maximum load levels of 150 and 200 mN to
provide two sets of indentation loading-unloading curves.
With regards to Optimisation Method 1 (FE method), there are small differences between the
experimental test curves and the corresponding FE generated curves, especially in the loading portion
of the curve. The differences are expected since the effects of friction, sharpness of the indenter tip,
indentation size effects and strain rate effects in the experimental indentation tests are not taken into
account in the FE analysis. The optimised results are very similar to the results obtained in [14]. Both 0
50 100 150 200 250
0 500 1000 1500 2000
App
li
ed
L
oad
(m
N)
Indenter Displacement (nm)
FE simulated case 1 for Test 7
FE simulated case 2 for Test 7
Experimental test 7
18
the values of Young’s modulus and yield stress are close to the results obtained from the uniaxial
tensile test. However, the values of the work-hardening exponentare over-estimated. This indicates
that using an experimental indentation curve from a single indenter, albeit with two different load
levels, may not be sufficient to arrive at accurate predictions of the work hardening exponent.
With respect to Optimisation Method 2 (dimensional functions approach), the values of Young’s
modulus and work hardening exponent are relatively more accurate than the values of yield stress. The
issues of uniqueness have clearly been illustrated in Figure 9, which shows that different sets of material properties can result in similar loading-unloading curves. This raises the issue of uniqueness
of the material properties obtained from optimisation methods, i.e. using the same indenter geometry
with different loads does not guarantee obtaining a unique set of elastic-plastic material properties.
With reference to Optimisation Method 3 (simplified equations approach), the results show that the
values of Young’s modulus and work hardening exponents agree well with those obtained from
uniaxial tensile tests, but the final optimised values of the yield stress are generally over-estimated.
Figure 12 shows that the FE simulated loading-unloading curves do not match well with the corresponding experimental curves, even though the final simulated curves from MATLAB agree well
with the experimental curves.
5. Conclusions
Three different optimisation methods have been used to establish the accuracy and robustness of
optimisation techniques in extracting the elastic-plastic material properties from an experimental
indentation test in which a loading-unloading curve can be obtained. A Berkovich indenter and two
different loads, 150mN and 200mN, have been applied to provide dual indentation data.
In general, the elastic-plastic material properties from these three proposed methods estimate the
values of Young’s modules to within 6%, compared to the actual values obtained from the uniaxial tensile tests. Furthermore, the estimations of Young’s modulus are much better than those obtained
from the Olive-Pharr method, which are approximately 20% over-estimated. The yield stress and
work-hardening exponent are obtained to within 12%, compared to the values obtained from the
19
To obtain a unique set of elastic-plastic material properties, especially the yield stress and work
hardening exponent, it is recommended that different indenter geometries should be used to generate
loading-unloading curves rather than using the same indenter geometry with different loads.
References
[1] Wen W, Becker AA, Sun W. Determination of material properties of thin films and coatings using indentation tests: a review. Journal of Materials Science 2017; 52: 12553-73.
[2] Oliver WC, Pharr GM. An improved technique for determining hardness and elastic modulus using load and displacement sensing indentation experiments, Journal of Materials Research 1992; 7: 1564-83.
[3] Bell TJ, Bendeli A, Field S, Swain MV, Thwaite EG. The determination of surface plastic and elastic properties by ultra micro-indentation, Metrologia 1992; 28: 463-469.
[4] Cheng Y, Cheng C. Scaling approach to conical indentation in elastic-plastic solids with work hardening. Journal of Applied Physics 1998; 84: 1284-91.
[5] Dao M, Chollacoop N, Vliet KJ Van, Venkatesh TA, Suresh S. Computational modeling of the forward and reverse problems in instrumented sharp indentation. Acta Materialia 2001; 49: 3899–918.
[6] Stauss S, Schwaller P, Bucaille JL, Rabe R, Rohr L, Michler J, Blank E. Determining the stress-strain behaviour of small devices by nanoindentation in combination with inverse methods. Microelectronic Engineering 2003; 67-68: 818–25.
[7] Chollacoop N, Dao M, Suresh S. Depth-sensing instrumented indentation with dual sharp indenters. Acta Materialia 2003; 51: 3713-29.
[8] Ogasawara N, Chiba N, Chen X. Measuring the plastic properties of bulk materials by single indentation test. Scripta Materialia 2006; 54: 65–70.
[9] Luo J, Lin J, Dean TA. A study on the determination of mechanical properties of a power law material by its indentation force–depth curve. Philosophical Magazine 2006; 86: 2881–905.
[10] Gamonpilas C, Busso EP. Characterization of elastoplastic properties based on inverse analysis and finite element modeling of two separate indenters. Journal of Engineering Materials and Technology 2007; 129: 603-8.
[11] Zhang J, Niebur GL, Ovaert TC. Mechanical property determination of bone through nano- and micro-indentation testing and finite element simulation. Journal of Biomechanics 2008; 41: 267–75.
20
[13] Kang J, Becker AA, Sun W. Effect of indenter geometries on material properties. Applied mechanics and Materials 2011; 70: 219-24
[14] Kang J, Becker AA, Sun W. Determining elastic-plastic properties from indentation data obtained from Finite element simulations and experimental results. Int. J. Mech.Sci. 2012; 62: 34-46
[15] Kang J, Becker AA, Sun W. A combined dimensional analysis and optimisation approach for determining elastic-plastic properties from indentation tests, Journal of Strain analysis 2011; 46: 749-759
[16] Kang JJ, Boris M, Becker AA, Sun W. Obtaining material properties from indentation loading unloading curves using simplified equations. Proc. Eleventh Int. Conf. on Computational Structures Technology, B.H.V. Topping, (Editor), Civil-Comp Press, Stirlingshire, Paper 263, 4-7 September 2012, Dubrovnik Croatia
[17] Davies MI. High temperature nanoindentation characterisation of P91 and P92 steel. PhD thesis,
University of Nottingham, 2013.
[18] Yaghi AH, Hyde TH, Becker AA, Sun W, Hilson G, Simandjuntak S, Flewitt PEJ, Pavier MJ, Smith DJ, A comparison between measured and modelled residual stresses in a circumferentially butt-welded P91 steel pipe. J. Pressure vessel Technol 2010; 132: 011206-1-10
[19] Pharr GM, Oliver WC, Brotzen FR. On the generality of the relationship among contact stiffness,
contact area and elastic modulus during indentation. J. Mater. Res.1992; 7: 613-7.
[20] Khan MK, Hainsworth SV, Fitzpatrick LE. A combined experimental and finite element approach
for determining mechanical properties of aluminium alloys by nanoindentation. Comput.Mater.Sci.
![Figure 1. Schematic illustration of a typical instrumented indentation system [1].](https://thumb-us.123doks.com/thumbv2/123dok_us/8557873.364781/3.595.167.422.78.280/figure-schematic-illustration-typical-instrumented-indentation.webp)