ORIGINAL ARTICLE
Genetic variants affecting cross-sectional lung
function in adults show little or no effect on
longitudinal lung function decline
Catherine John,
1María Soler Artigas,
1Jennie Hui,
2,3,4,5Sune Fallgaard Nielsen,
6Nicholas Rafaels,
7Peter D Paré,
8Nadia N Hansel,
9Nick Shrine,
1Iain Kilty,
10Anders Malarstig,
11Scott A Jelinsky,
10Signe Vedel-Krogh,
6Kathleen Barnes,
7Ian P Hall,
12John Beilby,
2,3,4Arthur W Musk,
4,5,13,14Børge G Nordestgaard,
6Alan James,
4,14,15Louise V Wain,
1,16Martin D Tobin
1,16ABSTRACT
Background Genome-wide association studies have identified numerous genetic regions that influence cross-sectional lung function. Longitudinal decline in lung function also includes a heritable component but the genetic determinants have yet to be defined. Objectives We aimed to determine whether regions associated with cross-sectional lung function were also associated with longitudinal decline and to seek novel variants which influence decline.
Methods We analysed genome-wide data from 4167 individuals from the Busselton Health Study cohort, who had undergone spirometry (12 695 observations across eight time points). A mixed model wasfitted and weighted risk scores were calculated for the joint effect of 26 known regions on baseline and longitudinal changes in FEV1and FEV1/FVC. Potential additional regions of interest were identified and followed up in two independent cohorts.
Results The 26 regions previously associated with cross-sectional lung function jointly showed a strong effect on baseline lung function ( p=4.44×10⁻¹⁶for FEV1/FVC) but no effect on longitudinal decline ( p=0.160 for FEV1/FVC). This was replicated in an independent cohort. 39 additional regions of interest (48 variants) were identified; these associations were not replicated in two further cohorts.
Conclusions Previously identified genetic variants jointly have a strong effect on cross-sectional lung function in adults but little or no effect on the rate of decline of lung function. It is possible that they influence COPD risk through lung development. Although no genetic variants have yet been associated with lung function decline at stringent genome-wide significance, longitudinal change in lung function is heritable suggesting that there is scope for future discoveries.
INTRODUCTION
Reduction of FEV1relative to FVC defines COPD,
one of the leading causes of death worldwide. Measures of lung function are also important pre-dictors of morbidity and mortality in the general population.1–3 While environmental factors, par-ticularly smoking, impact lung function, genetic variation is also a major determinant.4
Genome-wide association studies (GWAS) to date have identified numerous regions associated with lung function measured at a single point in time (ie, cross-sectional lung function).5–9 The lung function attained at a given time point in adult-hood will be influenced by factors that affect either the development of lung function in earlier life or the rate of subsequent decline in lung function or both. Both cross-sectional lung function and longi-tudinal change in lung function are heritable. Although heritability estimates for longitudinal decline in lung function range between 10% and 39%,10 the individual genetic determinants have yet to be defined. Identifying the responsible genes could provide a promising route for intervention in COPD, since this is typically diagnosed well after lung function has reached its peak and modifying its further decline could prove to be a feasible therapeutic option.
The objectives of our study were as follows: (1) to examine the association with longitudinal change for those regions previously identified as significantly associated with cross-sectional FEV1or
FEV1/FVC and (2) to seek novel variants which
Key messages
What is the key question?
▸ Do genetic regions associated with cross-sectional lung function also show association with rate of decline?
What is the bottom line?
▸ Twenty-six regions associated with cross-sectional lung function in adults—many of them associated with COPD risk—were not associated with rate of decline in lung function.
Why read on?
▸ Thesefindings provide an important insight into the possible pathways through which known genetic regions influence lung function and risk of COPD.
400
To cite: John C, Soler Artigas M, Hui J, et al. Thorax 2017;72:400–408.
►Additional material is published online only. To view please visit the journal online (http:// dx. doi. org/ 10. 1136/ thoraxjnl- 2016- 208448).
For numbered affiliations see end of article.
Correspondence to Dr Catherine John, University of Leicester, Department of Health Sciences, Centre for Medicine, University Road, Leicester LE1 7RH, UK; cj153@ leicester. ac. uk
CJ, MSA, LVW and MDT contributed equally.
Received 5 February 2016 Accepted 25 November 2016 Published Online First 7 February 2017
reach genome-wide significance for association with longitudinal change in lung function, using a cohort with multiple lung func-tion measurements over an extended period of up to 40 years and an imputation panel which provides dense coverage of both common and low-frequency variants.
METHODS
Discovery data source and study population
The Busselton Health Study (BHS) is a longitudinal health survey that began in 1966 in the town of Busselton in the south-western region of Western Australia. In 1994/1995, a cross-sectional community follow-up study was undertaken where blood was taken for DNA extraction. A sample of 1468 indivi-duals with European ancestry were genotyped using the Illumina 610-Quad BeadChip (BHS1) and subsequent genotyp-ing was carried out on an independent group of 3407 indivi-duals with European ancestry using Illumina 660W-Quad (BHS2). Spirometric measures of FEV1and FVC were assessed.
From 1966 to 1978 (five surveys), FEV1and FVC were
mea-sured using a McDermott dry spirometer (Pneumoconiosis Research Unit, Penarth, UK) and recorded as the highest values from three measurements ( provided that two recordings were within 10% of each other). Wedge spirometers (Vitalograph, Buckingham, UK) were used in the 1981 survey and pneumo-tachograph spirometers (Welch Allyn, Skaneateles Falls, New York, USA) were used in 1994/1995.11 12FEV1and FVC
were measured in 2005 using Medgraphics pneumotachograph spirometers and recorded with BreezeSuite 6.2 (Medical Graphics, St Paul, USA).13 From 1981 onwards, spirometric measurements met American Thoracic Society guidelines (52% of the total number of measurements).14 15
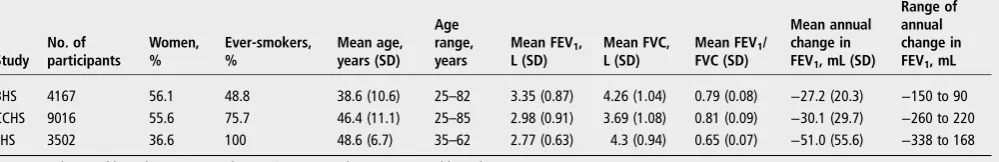
Demographic details and mean lung function measurements for this and replication cohorts are shown in table 1. Observations prior to age 25 were excluded from both discov-ery and replication analyses.16
Genotype quality control and imputation
Genotype data from BHS1 and BHS2 samples were merged and quality control (QC) was undertaken for both variant quality and sample quality. Prior to imputation, variants were excluded if they had a call rate <95%, deviated from Hardy-Weinberg equilibrium ( p<10−6) or had a minor allele frequency (MAF) of
<1% (100 240 variants). Individuals were excluded if their call rate was <95%, if their submitted gender and gender inferred by genotype were inconsistent, if they were a duplicate or if they were an outlier for heterozygosity (169 individuals). Principal components analysis was used to exclude individuals of non-European ancestry (those at least four SDs away from the mean for at least one of thefirst two principal components) (27 individuals). Analysis of identity by descent (IBD) was com-pared with the reported pedigree; any inconsistencies were reviewed and individuals were excluded as appropriate (40 indi-viduals; see online supplementary material for further details). QC was undertaken using PLINK V.1.07 (Purcell S; http://pngu. mph.harvard.edu/purcell/plink),17EIGENSOFT (V.4.2)18 19and R V.2.15 (R Core Team; http://www.R-project.org).
Imputation was undertaken using the 1000 Genomes Project reference panel (1000G Phase I Integrated Release V.3 (March 2012)).20 Chunking was performed using ChunkChromosome, phasing using MaCH (V.1.0.18)21 and imputation using Minimac (V.2012.10.3).22Variants where imputation quality (r2) was <0.3 or MAF <1% were excluded.
Phenotype QC and analysis
Data on age and smoking were checked for consistency over time. Where possible, missing data on height or smoking at one time point were imputed to be the same as that at the nearest time point (407 data items imputed in total). Otherwise, observations with missing data on lung function, age or height or where FEV1was greater than FVC were excluded from the
analysis. After phenotype and genotype datasets were merged, and after samples failing genotype QC were excluded, 12 863 observations for 4170 individuals and up to eight time points were available prior to further phenotype QC.
A time variable was created for each observation, determined by the difference between the age of the individual at that obser-vation and their age at thefirst time point for which data were available on that individual. Family was defined based on IBD, such that all individuals in a family were related (IBD >0.2) with at least one other person in the family. A full model with age, age2, height, height2, sex and time asfixed effects and an inter-cept varying per individual, an interinter-cept varying per family and a slope for time varying per individual as random effects wasfitted to the data for each trait (FEV1, FEV1/FVC and FVC).
Additionally, another four models were fitted, excluding the random intercept varying per family, the random slope for time varying per individual and age2and height2one at a time and comparing with the full model using Akaike information criter-ion and Bayesian informatcriter-ion critercriter-ion. Thefinal model included all the terms in the full model, except for age2as this did not
improve thefit of the model (see online supplementary table S1). Outlying observations (with residuals more than four SDs away from the mean) for any of the three traits analysed, FEV1, FEV1/
FVC and FVC, were then excluded from the analysis (168 obser-vations and three individuals excluded). This resulted in 12 695 observations for 4167 individuals and up to eight time points included in thefinal analysis. The mean number of measurements per participant was three (see online supplementary figure S1) and the mean length of follow-up was 15.5 years.
Genetic risk scores
Previously published studies identified variants in 26 regions sig-nificantly associated with cross-sectional FEV1 and/or FEV1/
FVC.5–8We compared the effect size estimates for these 26 var-iants in BHS with the previously published effect size estimates. A weighted risk score was calculated for the joint effect of these 26 regions on baseline FEV1 and FEV1/FVC as well as on
change over time in both traits. The single-nucleotide poly-morphisms (SNPs) included in this analysis are shown in the online supplementary table S2.
Unbiased (winner’s curse-free) effect sizes, as calculated previ-ously but excluding any data from BHS,8were used as weights for the 26 variants in the risk score calculations (weights, range 0.2–2.57, provided in online supplementary table S3). The number of risk alleles for each variant was multiplied by its cor-responding weight and then summed across variants in order to obtain the risk score for each individual and to create the risk score variable. This risk score variable was then added to the final model described above, together with the risk score by time interaction, in order to obtain both the effect on baseline and on change over time.
Genome-wide association analysis and selection of variants for follow-up analysis
was tested by adding a variant and variant-by-time interaction into the final phenotypic model described above. Using this model, genome-wide association analyses were undertaken for 29 798 550 variants assuming an additive genetic effect. Genomic control was subsequently applied (genomic inflation factors for slope change were 1.04, 1.03 and 1.06 for FEV1,
FEV1/FVC and FVC, respectively).23
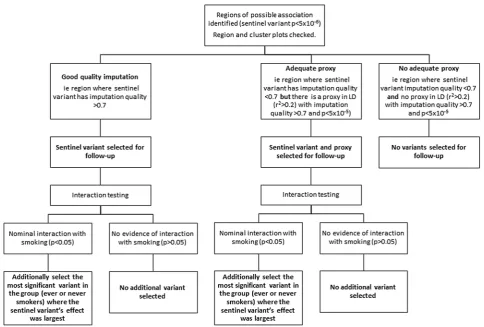
Figure 1 illustrates our criteria for selection of variants for follow-up analysis. We identified variants potentially associated ( p<5×10⁻⁶taken as suggestive of association) with longitudinal FEV1, FEV1/FVC or FVC. We defined regions of association
around the most strongly associated variant (sentinel variant) ±500 kb. We examined region plots to assess support from neighbouring variants and cluster plots for the closest genotyped variant to the sentinel variant in order to rule out associations driven by genotyping errors. Regions were selected for follow-up if they had at least one variant (either the top variant or a proxy in linkage disequilibrium with r2>0.2) with imput-ation quality >0.7 and p value <5×10⁻⁵.
Within each region, we selected variants for follow-up ana-lysis as follows: (1) the sentinel variant, (2) a second variant in the region with imputation quality >0.7 and p value <5×10⁻⁵ where the sentinel variant had imputation quality <0.7 and (3) for regions in which variants showed nominal interaction with smoking ( p <0.05 for interaction term based on a Z-test between ever-smokers and never-smokers), the most significant variant in the group (ever-smokers or never-smokers) where the sentinel variant’s effect size estimate was largest.
Sensitivity analyses were also undertaken for the regions which met the criteria for follow-up analysis to assess whether their effect could be mediated through smoking behaviour. The same model was fitted, with an additional term for smoking status (ever-smoked or never-smoked), and effect sizes were compared.
Estimations of power were also obtained for the discovery of new signals and for detection of associations with the 26 var-iants previously reported to be associated with cross-sectional lung function (see online supplementary materials).
Replication
Follow-up analyses for the 39 new regions potentially associated with longitudinal change were undertaken in the Copenhagen City Heart Study (CCHS), a prospective study of a random sample of the Danish general population, aged ≥20 years, drawn using the Danish Civil Registration System (n=9016) who had lung function measurements at up to three time points between 1976 and 1994,24 with a further measurement in 2001–03.25Follow-up was also undertaken in the Lung Health Study (LHS), a North American cohort of smokers with mild airflow limitation who had annual lung function measurements for 5 years (n=3502).26Risk score analyses with the previously
reported 26 variants were also undertaken in CCHS.5–8 QC procedures (including inspection of cluster plots) were applied and the same model wasfitted as for BHS, but without adjust-ment for relatedness, given that there were no related indivi-duals. Demographic details and mean lung function measurements for CCHS and LHS are shown intable 1.
All risk score and association analyses were undertaken in R using the package‘lme4’(Bates D, Maechler M, Bolker B,et al; http://CRAN.R-project.org/package=lme4).
RESULTS
Known regions: calculation of risk scores and replication
Comparison of effect sizes for cross-sectional lung function and longitudinal change and weighted risk score analyses showed that 26 variants previously identified as associated with cross-sectional lung function were not significantly associated with longitudinal change in our cohort.
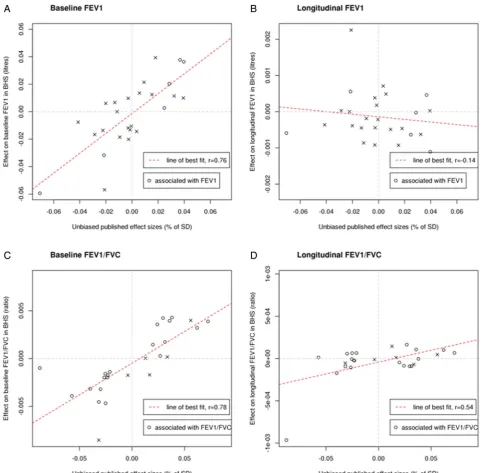
There was a strong correlation between estimated SNP effects on baseline lung function in BHS and in published estimates6–8 for both FEV1 (r=0.76) and FEV1/FVC (r=0.78). However,
estimated SNP effects on change in FEV1and FEV1/FVC were
weakly correlated with published estimates for the respective cross-sectional trait (figure 2 and online supplementary figure S2).
A weighted risk score was calculated for the joint effect of these 26 regions on baseline FEV1 and FEV1/FVC as well as
change over time in both traits. This showed a strong effect on baseline FEV1 ( p=9.75×10⁻¹²) and FEV1/FVC
( p=4.44×10⁻¹⁶) but no effect was observed on change over time for either FEV1 ( p=0.409) or FEV1/FVC ( p=0.160)
(table 2).
In silico data were available for eight known variants in CCHS and genotyping was undertaken for the remaining 18 variants. All of these passed QC procedures. They showed a joint effect similar to that seen in BHS: a strong association with baseline measurement ( p=4.45×10⁻¹⁰) but no association
with change over time in FEV1/FVC ( p=0.302) and strong
association with baseline measurement ( p=8.92×10⁻⁷) but
only borderline association with change over time for FEV1
( p=0.030) (table 2).
New signals: discovery and replication
Genome-wide analysis identified 56 independent regions which were associated with decline in FEV1, FEV1/FVC and/or FVC at
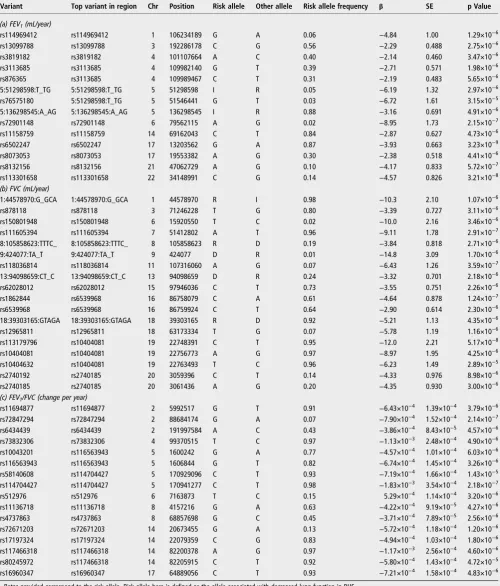
a significance threshold of p<5x10⁻⁶. Thirty-nine of these regions (48 variants) were selected for follow-up based on the criteria described under‘Methods’: 11 regions (13 variants) for change in FEV1, 15 regions (19 variants) for change in FVC and
13 regions (16 variants) for change in FEV1/FVC. These are
[image:3.595.51.551.70.151.2]shown in table 3. The most significantly associated variant Table 1 Descriptive characteristics of cohorts included in discovery and follow-up (age and lung function measurements as at first time point)
Study No. of participants Women, % Ever-smokers, % Mean age, years (SD) Age range, years
Mean FEV1,
L (SD)
Mean FVC, L (SD)
Mean FEV1/
FVC (SD)
Mean annual change in FEV1, mL (SD)
Range of annual change in FEV1, mL
BHS 4167 56.1 48.8 38.6 (10.6) 25–82 3.35 (0.87) 4.26 (1.04) 0.79 (0.08) −27.2 (20.3) −150 to 90
CCHS 9016 55.6 75.7 46.4 (11.1) 25–85 2.98 (0.91) 3.69 (1.08) 0.81 (0.09) −30.1 (29.7) −260 to 220
LHS 3502 36.6 100 48.6 (6.7) 35–62 2.77 (0.63) 4.3 (0.94) 0.65 (0.07) −51.0 (55.6) −338 to 168
(rs6502247) showed an effect of 3.93 mL/year on decline in FEV1( p=3.23×10⁻⁹).
Effect size estimates for these variants were not attenuated after adjusting for smoking status and no variant-by-smoking interaction met a Bonferroni-corrected threshold for the number of regions tested ( p<1.3×10⁻³).
De novo genotyping of all 48 variants was undertaken in CCHS. Where genotyping failed, tags were identified, if pos-sible. In total, 34 variants in 30 independent regions passed QC procedures (including the inspection of cluster plots) and 14 failed. The analysis included 9016 individuals with up to four time points (25 796 observations). None of these 34 variants showed replicated association with change in lung function (using a significance threshold of p<0.0016, representing a Bonferroni correction for 30 independent regions withα=0.05) (see online supplementary table S4).
Thirty-one variants (in 26 of the 39 regions) for which in silico data were available were also followed up in LHS. None of these SNPs showed significant association with lung function decline in LHS (using a significance threshold of p<0.0019, representing a Bonferroni correction for 26 independent regions with α=0.05) (see online supplementary table S5). Results from both CCHS and LHS are shown in the online supplementary materials. In total, 21 variants were analysed in both follow-up studies, of these, 14 had the same direction of effect as BHS after meta-analysing results from CCHS and LHS ( p=0.095).
For sentinel variants in regions previously reported to show suggestive evidence of association with longitudinal lung func-tion (though none met genome-wide significance and replicated
in previous papers), we assessed association with FEV1, FVC
and/or FEV1/FVC in our data.26–28 Of these 51 variants,10
showed nominal evidence of association with at least one of the lung function traits either in the whole cohort or in one of the smoking subgroups. However, none were significant after cor-rection for multiple testing (using a threshold of p<9.8×10⁻⁴)
(see online supplementary table S6).
DISCUSSION
We analysed the joint effect of regions previously associated with cross-sectional lung function on longitudinal change in the general population, and undertook a GWAS to identify new signals associated with longitudinal change. Regions pre-viously identified as significantly associated with cross-sectional FEV1 and/or FEV1/FVC5–8 were jointly strongly
associated with baseline measurements in both discovery (BHS) and replication (CCHS) cohorts. However, although many of these variants have previously shown association with COPD risk (TNS1, RARB, FAM13A, GSTCD, HHIP, HTR4, ADAM19,AGER,GPR126,C10orf11, THSD4),29–33 we have shown that they are not associated with change in FEV1 or
FEV1/FVC over time in our cohorts. We identified novel
var-iants associated with decline in lung function in BHS which did not replicate in either a general population cohort (CCHS) or a cohort of smokers with mild lung function impairment (LHS).
[image:4.595.55.540.45.372.2]which have used HapMap reference panels.26 27 34 Another strength is the high number of lung function measurements in BHS: up to eight measurements over a range of up to 40 years. This is longer than other published studies, including most of the individual studies in a meta-analysis by Tanget al,34which included a portion of our dataset. Our study also adds value as it is thefirst to calculate risk scores for longitudinal lung func-tion. Nevertheless, such a long follow-up period brings some challenges. Spirometry equipment changed over time and the earlier surveys in BHS were performed before protocols for
standardisation of spirometry were published.11 14 15 In add-ition, repeated measurements over a number of years could train participants in optimal technique and underestimate decline in lung function. The detection of known associations with cross-sectional lung function provides some reassurance regarding the extent of any potential measurement error in lung function measurement.
[image:5.595.56.539.45.518.2]The biggest challenge we faced was the availability of large sample sizes for well-characterised longitudinal measures of lung function. The sample size, in combination with possible Figure 2 Representations showing the (A) correlation between estimated single-nucleotide polymorphism (SNP) effects on baseline FEV1in Busselton Health Study (BHS) and published estimates, (B) correlation between estimated SNP effects on change in FEV1in BHS and published estimates of SNP effects on cross-sectional FEV1, (C) correlation between estimated SNP effects on baseline FEV1/FVC in BHS and published estimates and (D) correlation between estimated SNP effects on change in FEV1/FVC in BHS and published estimates of SNP effects on
measurement error, may have limited our ability to identify indi-vidual variants which reach stringent genome-wide significant levels and replicate. However, our study will have had much greater power to detect longitudinal effects of aggregate risk scores comprised of the 26 variants previously reported to be associated with cross-sectional lung function. We did not examine risk scores for FVC, as at the time of the analyses there were no published associations with FVC, and our focus was on the determinants of obstructive lung disease. It is possible there-fore that there are genetic associations with change in FVC over time which we did not identify. We did not undertake analyses stratified by sex, for reasons of power. However, effect estimates were adjusted for sex. We did not adjust for smoking in the primary analysis, since the analysis also had potential to high-light novel signals for smoking behaviour. We undertook sensi-tivity analyses to assess whether any top signals could be mediated by smoking behaviour. The signals were not attenu-ated after adjustment for smoking. However, this was based on binary smoking status and there remains potential for incom-plete adjustment.
Our study—thefirst to our knowledge to examine risk scores for change in lung function over time—complements existing studies which have sought individual SNP associations,26–28 including a large meta-analysis of longitudinal lung function.34 The meta-analysis by Tang et al34 (concurrent with our study) incorporated data from 27 349 individuals from 14 population-based cohorts (including a subset of 1009 individuals from BHS) and identified evidence for two novel regions associated with rate of change in FEV1. However, these did not replicate
in two further cohort studies (including LHS). The authors noted that the number of lung function measurements and dur-ation of follow-up varied considerably between studies included in the discovery phase and may have affected their ability to detect associations. The failure to replicate novel associations may relate to lack of power or, given that the larger replication cohort in their study (LHS) was composed of smokers with mild COPD, may indicate that the genetic determinants of lung function decline in those with COPD differ from those in healthy individuals.34
Similarly, a GWAS examining change in FEV1% predicted (in
a cohort of smokers with mild lung function impairment from LHS) identified two regions reaching genome-wide significance which did not replicate in four general population cohorts or in a cohort with moderate-to-severe COPD. The authors suggested that regions which modify the effect of cigarette smoke on lung function decline (or determine rate of decline at different stages of COPD) may be distinct from those which influence lung function decline in the general population.26A small number of studies have begun to explore interaction between genetic var-iants and smoking in relation to lung function decline, though
these have not identified any significant associations which also replicated.35 36
The suggestion that variants which determine lung function decline may show heterogeneity across different groups is further supported by findings from an earlier GWAS which identified suggestive evidence that different regions were asso-ciated with lung function decline in asthmatic and non-asthmatic individuals. Only the signal in non-asthmatic individuals (rs9316500 in DLEU7) showed evidence of replication (at p<0.05) in largely population-based cohorts, but it did not reach genome-wide significance in discovery, replication or two-stage meta-analysis.27None of the top variants reported in these papers reached significance after correction for multiple testing in our data.
Our findings are also consistent with recent work by Lange et al37 which identified two distinct trajectories of FEV
1 in
people who developed COPD. In their study, approximately half of those diagnosed with COPD by the end of follow-up started with normal lung function in early adulthood (mean age 40) and then showed rapid decline, whereas the remaining half started with low FEV1 in early adulthood followed by a
rela-tively normal rate of decline. This suggests that rapid lung func-tion decline in later life is not necessary for development of COPD. We hypothesise that the known genetic variants exam-ined in this paper may exert much of their effect in earlier life. Of the 26 regions examined in this paper, 19 have previously been shown to have directions of effect on lung function in chil-dren (aged 7–9 years) consistent with that in adults.8 An add-itional study has also shown evidence of association with lung function as early as 5–14 weeks of age for variants in 4 of the 26 loci.38 However, further large GWAS of lung development are required to test this hypothesis.
These findings emphasise the continuing public health importance of focusing on the key environmental determinants of lung function decline, particularly smoking. Nevertheless, genetic determinants of decline may remain a therapeutic target in the half of people with COPD for whom accelerated decline is important in pathogenesis.37 A potential strategy to identify these would be to focus on older cohorts and adjust for the effect of all known variants which affect cross-sectional lung function. Large sample sizes will also be the key to help confirm or refute ourfindings. However, as the largest existing meta-analysis identified significant challenges posed by pheno-typic heterogeneity, ensuring comparability of the participating studies’ approach to measuring longitudinal change must also be a high priority. An alternative approach would be to study longitudinal lung function in large, more homogeneous populations.
[image:6.595.47.552.78.161.2]In summary, regions previously identified as significantly associated with cross-sectional FEV1and/or FEV1/FVC5–8were Table 2 Weighted risk score in Busselton Health Study (BHS) and Copenhagen City Heart Study (CCHS) for 26 known regions associated with FEV1or FEV1/FVC
BHS CCHS
β SE p Value β SE p Value
FEV1, mL (baseline) −13.0 1.97 9.75×10⁻¹² −6.10 1.24 8.92×10⁻⁷
FEV1, mL/year (change over time) 0.070 0.085 0.409 −0.13 0.058 0.030
FEV1/FVC (baseline) −2.62×10⁻³ 3.23×10⁻⁴ 4.44×10⁻¹⁶ −1.28×10⁻³ 2.05×10⁻⁴ 4.45×10⁻¹⁰
FEV1/FVC (change over time) −2.42×10⁻⁵ 1.72×10⁻⁵ 0.160 −1.37×10⁻⁵ 1.33×10⁻⁵ 0.302
jointly strongly associated with baseline measurements in both discovery and replication cohorts but were not associated with change in FEV1 or FEV1/FVC over time. The present study
and others to date have identified no regions associated with
[image:7.595.48.549.78.665.2]lung function decline which reach genome-wide significance and replicate in independent cohorts. Genetic variants identi-fied to date that influence cross-sectional lung function, while still relevant in predicting the risk of COPD, appear to have Table 3 Variants selected for follow-up and their association with longitudinal change in lung function (FEV1, FVC and FEV1/FVC) in Busselton Health Study (BHS)
Variant Top variant in region Chr Position Risk allele Other allele Risk allele frequency β SE p Value
(a) FEV1(mL/year)
rs114969412 rs114969412 1 106234189 G A 0.06 −4.84 1.00 1.29×10⁻⁶
rs13099788 rs13099788 3 192286178 C G 0.56 −2.29 0.488 2.75×10⁻⁶
rs3819182 rs3819182 4 101107664 A C 0.40 −2.14 0.460 3.47×10⁻⁶
rs3113685 rs3113685 4 109982140 G T 0.39 −2.71 0.571 1.98×10⁻⁶
rs876365 rs3113685 4 109989467 C T 0.31 −2.19 0.483 5.65×10⁻⁶
5:51298598:T_TG 5:51298598:T_TG 5 51298598 I R 0.05 −6.19 1.32 2.97×10⁻⁶
rs76575180 5:51298598:T_TG 5 51546441 G T 0.03 −6.72 1.61 3.15×10⁻⁵
5:136298545:A_AG 5:136298545:A_AG 5 136298545 I R 0.88 −3.16 0.691 4.91×10⁻⁶
rs72901148 rs72901148 6 79562115 A G 0.02 −8.95 1.73 2.15×10⁻⁷
rs11158759 rs11158759 14 69162043 C T 0.84 −2.87 0.627 4.73×10⁻⁶
rs6502247 rs6502247 17 13203562 G A 0.87 −3.93 0.663 3.23×10⁻⁹
rs8073053 rs8073053 17 19553382 A G 0.30 −2.38 0.518 4.41×10⁻⁶
rs8132156 rs8132156 21 47062729 A G 0.10 −4.17 0.833 5.72×10⁻⁷
rs113301658 rs113301658 22 34148991 C G 0.14 −4.57 0.826 3.21×10⁻⁸
(b) FVC (mL/year)
1:44578970:G_GCA 1:44578970:G_GCA 1 44578970 R I 0.98 −10.3 2.10 1.07×10⁻⁶
rs878118 rs878118 3 71246228 T G 0.80 −3.39 0.727 3.11×10⁻⁶
rs150801948 rs150801948 6 15920550 T C 0.02 −10.0 2.16 3.46×10⁻⁶
rs111605394 rs111605394 7 51412802 A T 0.96 −9.11 1.78 2.91×10⁻⁷
8:105858623:TTTC_ 8:105858623:TTTC_ 8 105858623 R D 0.19 −3.84 0.818 2.71×10⁻⁶
9:424077:TA_T 9:424077:TA_T 9 424077 D R 0.01 −14.8 3.09 1.70×10⁻⁶
rs118036814 rs118036814 11 107316060 A G 0.07 −6.43 1.26 3.59×10⁻⁷
13:94098659:CT_C 13:94098659:CT_C 13 94098659 D R 0.24 −3.32 0.701 2.18×10⁻⁶
rs62028012 rs62028012 15 97946036 C T 0.73 −3.55 0.751 2.26×10⁻⁶
rs1862844 rs6539968 16 86758079 C A 0.61 −4.64 0.878 1.24×10⁻⁷
rs6539968 rs6539968 16 86759924 C T 0.64 −2.90 0.614 2.30×10⁻⁶
18:39303165:GTAGA 18:39303165:GTAGA 18 39303165 R D 0.92 −5.21 1.13 4.35×10⁻⁶
rs12965811 rs12965811 18 63173334 T G 0.07 −5.78 1.19 1.16×10⁻⁶
rs113179796 rs10404081 19 22748391 C T 0.95 −12.0 2.21 5.17×10⁻⁸
rs10404081 rs10404081 19 22756773 A G 0.97 −8.97 1.95 4.25×10⁻⁶
rs10404632 rs10404081 19 22763493 T C 0.96 −6.23 1.49 2.89×10⁻⁵
rs2740192 rs2740185 20 3059396 C T 0.14 −4.33 0.976 8.98×10⁻⁶
rs2740185 rs2740185 20 3061436 A G 0.20 −4.35 0.930 3.00×10⁻⁶
(c) FEV1/FVC (change per year)
rs11694877 rs11694877 2 5992517 G T 0.91 −6.43×10⁻⁴ 1.39×10⁻⁴ 3.79×10⁻⁶
rs72847294 rs72847294 2 88684174 G A 0.07 −7.90×10⁻⁴ 1.52×10⁻⁴ 2.14×10⁻⁷
rs6434439 rs6434439 2 191997584 A C 0.43 −3.86×10⁻⁴ 8.43×10⁻⁵ 4.57×10⁻⁶
rs73832306 rs73832306 4 99370515 T C 0.97 −1.13×10⁻³ 2.48×10⁻⁴ 4.90×10⁻⁶
rs10043201 rs116563943 5 1600242 G A 0.77 −4.57×10⁻⁴ 1.01×10⁻⁴ 6.03×10⁻⁶
rs116563943 rs116563943 5 1606844 G T 0.82 −6.74×10⁻⁴ 1.45×10⁻⁴ 3.26×10⁻⁶
rs58140608 rs114704427 5 170929096 C T 0.93 −7.19×10⁻⁴ 1.66×10⁻⁴ 1.43×10⁻⁵
rs114704427 rs114704427 5 170941277 C T 0.98 −1.83×10⁻³ 3.54×10⁻⁴ 2.18×10⁻⁷
rs512976 rs512976 6 7163873 T C 0.15 5.29×10⁻⁴ 1.14×10⁻⁴ 3.20×10⁻⁶
rs11136718 rs11136718 8 4157216 G A 0.63 −4.22×10⁻⁴ 9.19×10⁻⁵ 4.27×10⁻⁶
rs4737863 rs4737863 8 68857698 G C 0.45 −3.71×10⁻⁴ 7.89×10⁻⁵ 2.56×10⁻⁶
rs72671203 rs72671203 14 20673455 G A 0.13 −5.72×10⁻⁴ 1.18×10⁻⁴ 1.20×10⁻⁶
rs17197324 rs17197324 14 22079359 C G 0.83 −4.94×10⁻⁴ 1.03×10⁻⁴ 1.80×10⁻⁶
rs117466318 rs117466318 14 82200378 A G 0.97 −1.17×10⁻³ 2.56×10⁻⁴ 4.60×10⁻⁶
rs80245972 rs117466318 14 82205915 C T 0.92 −5.80×10⁻⁴ 1.43×10⁻⁴ 4.72×10⁻⁵
rs16960347 rs16960347 17 64889056 C T 0.93 −7.21×10⁻⁴ 1.58×10⁻⁴ 4.83×10⁻⁶
Betas provided correspond to the risk allele. Risk allele here is defined as the allele associated with decreased lung function in BHS. Variants are given in order of Chr and position.
little or no effect on the rate of change in adult lung function over time in our study.
Author affiliations
1
Genetic Epidemiology Group, Department of Health Sciences, University of Leicester, Leicester, UK
2
School of Pathology and Laboratory Medicine, The University of Western Australia, Australia
3
PathWest, Department of Health, Government of Western Australia, Perth, WA, Australia
4
Busselton Population Medical Research Institute, Sir Charles Gairdner Hospital, Western Australia, Australia
5
School of Population Health, The University of Western Australia, Australia
6Department of Clinical Biochemistry, Herlev and Gentofte Hospital, Copenhagen
University Hospital, Denmark
7Center for Personalized Medicine and Biomedical Informatics, School of Medicine,
University of Colorado, Anschutz Medical Campus
8University of British Columbia Centre for Heart Lung Innovation, St Paul's Hospital,
Vancouver, British Columbia, Canada
9Department of Medicine, School of Medicine, Johns Hopkins University, Baltimore,
Maryland, USA
10Pfizer Worldwide Research and Development, Cambridge, Massachusetts, USA 11Pfizer Worldwide Research and Development, Stockholm, Sweden
12Division of Respiratory Medicine, Queen's Medical Centre, University of
Nottingham, Nottingham, UK
13Department of Respiratory Medicine, Sir Charles Gairdner Hospital, Nedlands,
Western Australia, Australia
14School of Medicine and Pharmacology, The University of Western Australia,
Australia
15Department of Pulmonary Physiology and Sleep Medicine/West Australian Sleep
Disorders Research Institute, Sir Charles Gairdner Hospital, Nedlands, Western Australia, Australia
16
National Institute for Health Research (NIHR) Leicester Respiratory Biomedical Research Unit, Glenfield Hospital, Leicester, UK
Acknowledgements This research used the ALICE and SPECTRE High Performance Computing Facilities at the University of Leicester. The authors thank the staff, volunteers and participants of the Busselton Health Study, the Copenhagen City Heart Study and the Lung Health Study.
Contributors Project design and management: CJ, MSA, PDP, AM, IPH, JB, AWM, BGN, AJ, LVW and MDT. Phenotype collection and data management: JH, SFN, NR, NNH, SV-K, KB, JB, AWM, BGN and AJ. Genotype collection and data management: JH, SFN, NR, PDP, NNH, IK, AM, SAJ, SV, KB, JB, AWM, BGN and AJ. Data analysis and interpretation: CJ, MSA, SFN, NR, PDP, NNH, NS, IPH, LVW and MDT. Writing: CJ, MSA, SFN, PDP, IPH, AJ, LVW, MDT. CJ, MSA, LVW and MDT contributed equally to this work.
Funding This work was supported by the Medical Research Council (G0902313 to MDT) and Pfizer. This paper presents independent research funded partially by the National Institute for Health Research (NIHR). The views expressed are those of the author(s) and not necessarily those of the NHS, the NIHR or the Department of Health. The Busselton Health Study acknowledges the support of the National Health and Medical Research Council of Australia, the Government of Western Australia (Health Department, Sir Charles Gairdner Hospital, PathWest and Healthway) and Pfizer. The Copenhagen City Heart Study (CCHS) was supported by Department of Clinical Biochemistry, Herlev and Gentofte Hospital, Copenhagen University Hospital and the Danish Heart Foundation. The Lung Health Study (LHS) I was supported by the NIH (contract NIH/N01-HR-46002) and genome-wide association genotyping and analysis of LHS was supported by the NIH as part of the Gene Environment Association Studies (GENEVA) (U01HG004738).
Competing interests SAJ, AM and IK are employed by Pfizer. IPH reports grants from Pfizer, outside the submitted work. KB reports grants from NIH, during the conduct of the study; personal fees from Up-To-Date, outside the submitted work.
Ethics approval The Busselton Health Study genetics study was approved by the University of Western Australia Human Ethics Committee under project numbers RA/ 4/1/1516 and RA/4/1/2077. The genetic CCHS study was approved by Herlev and Gentofte Hospital, Copenhagen University Hospital, Denmark, by Danish ethical committees (the Copenhagen and Frederiksberg committee and the Copenhagen County committee; KF-100.2039/91, KF-01-144/01, H-KF-01-144/01). The LHS protocols were approved by the institutional review board for human studies at each clinical centre and written informed consent was obtained from each participant.
Provenance and peer reviewNot commissioned; externally peer reviewed.
Open Access This is an Open Access article distributed in accordance with the terms of the Creative Commons Attribution (CC BY 4.0) license, which permits
others to distribute, remix, adapt and build upon this work, for commercial use, provided the original work is properly cited. See: http://creativecommons.org/licenses/ by/4.0/
REFERENCES
1 Hole DJ, Watt GC, Davey-Smith G,et al. Impaired lung function and mortality risk in men and women:findings from the Renfrew and Paisley prospective population study.Br Med J1996;313:711–16.
2 Schunemann HJ, Dorn J, Grant BJ,et al. Pulmonary function is a long-term predictor of mortality in the general population: 29-year follow-up of the Buffalo Health Study.Chest2000;118:656–64.
3 James AL, Knuiman MW, Divitini ML,et al. Associations between white blood cell count, lung function, respiratory illness and mortality: the Busselton Health Study. Eur Respir J1999;13:1115–19.
4 DeMeo DL, Silverman EK. Genetics of chronic obstructive pulmonary disease. Semin Respir Crit Care Med2003;24:151–60.
5 Wilk JB, Chen TH, Gottlieb DJ,et al. A genome-wide association study of pulmonary function measures in the Framingham Heart Study.PLoS Genet2009;5: e1000429.
6 Hancock DB, Eijgelsheim M, Wilk JB,et al. Meta-analyses of genome-wide association studies identify multiple loci associated with pulmonary function. Nat Genet2010;42:45–52.
7 Repapi E, Sayers I, Wain LV,et al. Genome-wide association study identifiesfive loci associated with lung function.Nat Genet2010;42:36–44.
8 Soler Artigas M, Loth DW, Wain LV,et al. Genome-wide association and large-scale follow up identifies 16 new loci influencing lung function.Nat Genet
2011;43:1082–90.
9 Loth DW, Soler Artigas M, Gharib SA,et al. Genome-wide association analysis identifies six new loci associated with forced vital capacity.Nat Genet 2014;46:669–77.
10 Gottlieb DJ, Wilk JB, Harmon M,et al. Heritability of longitudinal change in lung function. The Framingham study.Am J Respir Crit Care Med 2001;164:1655–9.
11 Ryan G, Knuiman MW, Divitini ML,et al. Decline in lung function and mortality: the Busselton Health Study.J Epidemiol Community Health1999;53:230–4. 12 James AL, Palmer LJ, Kicic E,et al. Decline in lung function in the Busselton Health
Study: the effects of asthma and cigarette smoking.Am J Respir Crit Care Med 2005;171:109–14.
13 James AL, Knuiman MW, Divitini ML,et al. Changes in the prevalence of asthma in adults since 1966: the Busselton health study.Eur Respir J2010;35:273–8. 14 American Thoracic Society. ATS statement: snowbird workshop on standardization of
spirometry.Am Rev Respir Dis1979;119:831–8.
15 American Thoracic Society. Standardization of spirometry, 1994 update.Am J Respir Crit Care Med1995;152:1107–36.
16 Fletcher C, Peto R. The natural history of chronic airflow obstruction.Br Med J 1977;1:1645–8.
17 Purcell S, Neale B, Todd-Brown K,et al. PLINK: a tool set for whole-genome association and population-based linkage analyses.Am J Hum Genet 2007;81:559–75.
18 Price AL, Patterson NJ, Plenge RM,et al. Principal components analysis corrects for stratification in genome-wide association studies.Nat Genet2006;38:904–9. 19 Patterson N, Price AL, Reich D. Population structure and eigenanalysis.PLoS Genet
2006;2:e190.
20 Abecasis GR, Auton A, Brooks LD,et al. 1000 Genomes Project Consortium. An integrated map of genetic variation from 1,092 human genomes.Nature 2012;491:56–65.
21 Li Y, Abecasis GR. Mach 1.0: Rapid haplotype construction and missing genotype inference.Am J Hum Genet2006;S79:2290.
22 Howie B, Fuchsberger C, Stephens M,et al. Fast and accurate genotype imputation in genome-wide association studies through pre-phasing.Nat Genet
2012;44:955–9.
23 Devlin B, Roeder K. Genomic control for association studies.Biometrics 1999;55:997–1004.
24 Schnohr P, Jensen GB, Appleyard M,et al. The Copenhagen city heart study. Eur Heart J Suppl2001;3(Supplement H):1–83.
25 Afzal S, Lange P, Bojesen SE,et al. Plasma 25-hydroxyvitamin D, lung function and risk of chronic obstructive pulmonary disease.Thorax2014;69:24–31.
26 Hansel NN, Ruczinski I, Rafaels N,et al. Genome-wide study identifies two loci associated with lung function decline in mild to moderate COPD.Hum Genet 2013;132:79–90.
27 Imboden M, Bouzigon E, Curjuric I,et al. Genome-wide association study of lung function decline in adults with and without asthma.J Allergy Clin Immunol 2012;129:1218–28.
29 Pillai SG, Ge D, Zhu G,et al. A genome-wide association study in chronic obstructive pulmonary disease (COPD): identification of two major susceptibility loci. PLoS Genet2009;5:e1000421.
30 Cho MH, Boutaoui N, Klanderman BJ,et al. Variants in FAM13A are associated with chronic obstructive pulmonary disease.Nat Genet2010;42:200–2.
31 Castaldi PJ, Cho MH, Litonjua AA,et al. The association of genome-wide significant spirometric loci with chronic obstructive pulmonary disease susceptibility. Am J Respir Cell Mol Biol2011;45:1147–53.
32 Soler Artigas M, Wain LV, Repapi E,et al. Effect offive genetic variants associated with lung function on the risk of chronic obstructive lung disease, and their joint effects on lung function.Am J Respir Crit Care Med2011;184:786–95. 33 Wilk JB, Shrine NR, Loehr LR,et al. Genome-wide association studies identify
CHRNA5/3 and HTR4 in the development of airflow obstruction.Am J Respir Crit Care Med2012;186:622–32.
34 Tang W, Kowgier M, Loth DW,et al. Large-scale genome-wide association studies and meta-analyses of longitudinal change in adult lung function.PLoS ONE2014;9: e100776.
35 Thun GA, Imboden M, Kunzli N,et al. Follow-up on genome-wide main effects: do polymorphisms modify the air pollution effect on lung function decline in adults? Environ Int2014;64:110–15.
36 Curjuric I, Imboden M, Nadif R,et al. Different genes interact with particulate matter and tobacco smoke exposure in affecting lung function decline in the general population.PLoS ONE2012;7:e40175.
37 Lange P, Celli B, Agustí A,et al. Lung-function trajectories leading to chronic obstructive pulmonary disease.N Engl J Med2015;373:111–22.