ISSN Print: 2167-9495
DOI: 10.4236/ajcc.2019.81008 Mar. 6, 2019 137 American Journal of Climate Change
Variability of Future Rainfall over the Mono
River Basin of West-Africa
Batablinlè Lamboni
1, Lawin Agnidé Emmanuel
2, Celestin Manirakiza
1, Zakari Moussa Djibib
31Institute of Mathematics and Physical Sciences, University of Abomey-Calavi, Abomey-Calavi, Benin 2Applied Hydrology Laboratory, University of Abomey-Calavi, Abomey-Calavi, Benin
3Faculty of Sciences, Department of Mathematic, University of Lomé, Lomé, Togo
Abstract
This study assessed the rainfall trends and changes over Mono river basin under the highest greenhouse gas emission scenario RCP8.5. Simulations of eight regional climate models (RCMs) provided by Africa-CORDEX program were considered. To analyze the performance of a set of regional climate models, the MBE (mean bias error), the RMSE (root mean square error), the volume bias (VB), correlation coefficient (R2) and the t-Test statistics were
calculated. The precipitation concentration index (PCI), Mann-Kendall trend test, Theil-Sen’s slope estimator (β), and relative percentage change methods were also adopted for data analysis. Changes from the baseline period 1981-2010 were computed for far future (2061-2090 and 2071-2100). As results, the analysis herein highlighted the multi-models’ mean ability to simulate the Mono river basin rainfall adequately. Two distinct patterns emerged from the calculated PCI indicating that stations in southern basin will have moderate, irregular, and strongly irregular rainfall concentrations, whereas stations in northern basin will have irregular and strongly irregular rainfall concentra-tions. Significant declining in the rainfall was detected in most stations for the future period. The evolution of the monthly average rainfall amounts will be broadly characterized by a decrease and increase between 32.4 and 12% with late rainy seasons. It is understood that future changes in rainfall distribution and trends will affect the availability of water for crops, which should affect the productivity of rain fed agriculture.
Keywords
Future Rainfall, Variability, Trend, Change, Mono Basin
1. Introduction
Global warming and climate variability are emerging as the foremost environ-How to cite this paper: Lamboni, B.,
Em-manuel, L.A., Manirakiza, C. and Djibib, Z.M. (2019) Variability of Future Rainfall over the Mono River Basin of West-Africa. American Journal of Climate Change, 8, 137-155.
https://doi.org/10.4236/ajcc.2019.81008
Received: November 29, 2018 Accepted: March 3, 2019 Published: March 6, 2019
Copyright © 2019 by author(s) and Scientific Research Publishing Inc. This work is licensed under the Creative Commons Attribution International License (CC BY 4.0).
http://creativecommons.org/licenses/by/4.0/
DOI: 10.4236/ajcc.2019.81008 138 American Journal of Climate Change
mental problems in the 21st century, particularly in developing countries. The research from scientific community on climate change has estimated and pre-dicts that the frequency, intensity and extent of these phenomena (drought on continental regions and violent cyclonic storms) are and will be likely to increase across the world which will increase the exposure of populations in the years to come [1].
Africa is one of the most vulnerable continents to climate change across the world. This situation will aggravate by different interactions between population and ecosystems and low adaptive capacity [2] [3]. For example, this continent was particularly hit in 2007 by floods which affected more than two millions lives in the Central and Eastern parts in January, and 2.6 millions victims in a large region from west to east in July and August of the same year [4].
It is thus common that the developing countries’ low-income populations are likely to be affected by factors related to global warming, as West Africa one of the regions in the world that are most vulnerable to climate change. This is par-ticularly true for rural areas in West Africa where agriculture is the most promi-nent instrument for securing income and overcoming poverty. This region ex-periencing exponential population growth is already facing the consequences of climate change through gradual land degradation and loss of croplands and ecosystem services [5] [6] and high water stress and scarcity year [7], along with recurrent and localized droughts and flash floods year [8]. These conditions, ex-pected to be exacerbated in the future, constitute significant threats to water re-sources, energy, agricultural activities and ecosystem services.
For the specific case of Togo, according to the report of Togo Republic [9], floods, droughts, late rains, high temperatures and high winds, are the major risks in the country. The drought covers the entire territory except for the coast-al zone which is however facing sea level rise risk. It should be noted that among the latest climatic events, flooding takes precedence over other risks with its share of material damage and loss of life. It is becoming more and more dan-gerous across the whole country. Activities which are most exposed to these risks are farming, livestock farming, marketing of agricultural products and market gardening. Mono river basin that is our study area has not been spared by these events [10] [11].
resolu-DOI: 10.4236/ajcc.2019.81008 139 American Journal of Climate Change
tion (10 to 100 km) [12]. However, in general, these RCMs have different biases depending on the climatic zones and the multi-model approach generally gives remarkable results compared to the use of a single RCM. We have noted that the analysis and evaluation of climate change using RCMs are generally made at the regional scale of the Cordex-Africa domain; thus, most of the RCMs mul-ti-model studies have focused on Africa [13], West Africa [14] or on the Sahel
[15] scale. Few studies have been done locally over Cordex-Africa countries as well as at basins domain over Africa.
The aim of this study is therefore threefold: 1) to evaluate the performance of some RCMs in simulating rainfall over Mono basin in Togo (West Africa); 2) to exanimate trends of future rainfall over Mono basin in Togo (West-Africa).; 3) to project future changes in rainfall in the period 2061-2090 and 2071-2100 us-ing a regional climate model (Africa-cordex) under highest emission scenarios (i.e. RCP8.5).
The study area, used data and methods are described in the next Section 2. Section 3 was only reserved to the results. The Section 4 represents the discus-sions and conclusion is in the Section 5.
2. Study Area, Data and Methods Used
2.1. Study Area
Located on the coast of the Gulf of Guinea in West Africa, Togo (TG) has a sur-face area of 56,600 km2, bordering the Atlantic Ocean in the south, Burkina Faso
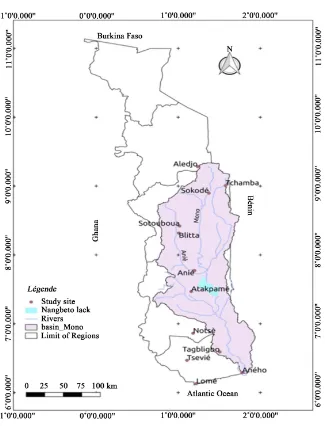
in the north, Benin in the east and Ghana in the west. The Togolese population was estimated at 6.3 million inhabitants in 2007 according to the report of UNDP in 2007. The main important rivers are Oti, Mono, Kara, Keran, Kou-mongou, Anie, Zio and Haho. Mono basin, which is the study area, is located in the Gulf of Guinea region, more precisely between 6˚16'N and 9˚20'N and 42˚E and 20˚25'E (Figure 1). The Mono river basin is almost entirely in Togo al-though its lower course is between Togo and Bénin. Our study considered the part in Togo. It houses a dam of hydroelectric power plant called Nangbeto. Draining a surface of 25,400 km2, the Mono river is the major one of Togo [10]
DOI: 10.4236/ajcc.2019.81008 140 American Journal of Climate Change Figure 1. Study area location.
average discharge of the main watercourse of this basin is approximately 106 m3/s at Nangbeto hydrometric station from 1981 to 2010. The annual rainfall
average is 1915 mm from 1981 to 2010. The mean maximum temperature for the whole basin varies between 28.4˚C and 33.7˚C while the mean of minimum temperature fluctuates between 24.3˚C and 27.8˚C from 1981 to 2010. Ac-cording to the report of WAEMU in 2006, the population of the basin is more than two million, with an annual increase of 2.9%. This population also dis-tributed at high densities in the south of the basin has as main activities, agri-culture (mainly rain fed); in the lower valleys, fishing and salt-farming are the major activities [17].
2.2. Data Used
DOI: 10.4236/ajcc.2019.81008 141 American Journal of Climate Change
simulations over different regions in the world. In this study datasets from CORDEX Africa are accessed from
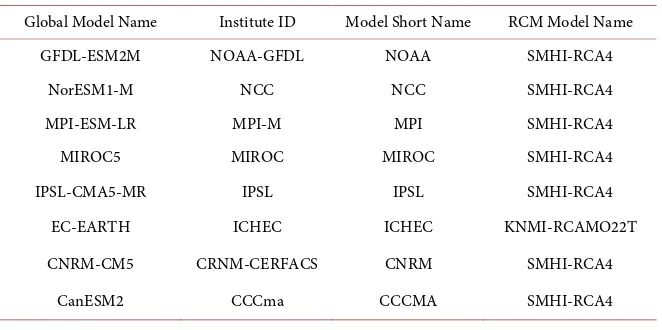
https://esgf-data.dkrz.de/projects/esgf-dkrz/. The datasets are quality controlled. The spatial grid resolutions of all CORDEX Africa RCMs were set to longitude 0.44˚ and latitude 0.44˚ using a rotated pole system coordinate. These models operate over an equatorial domain with a quasi-uniform resolution of approx-imately 50 km by 50 km. The components of the model are based on the scena-rio or Representative Concentration Pathway (RCP). Detailed description of CORDEX RCMs and their dynamics as well as their physical parameterization are given by [3]. Those authors listed the details of CORDEX-RCMs and the driving GCMs: CNRM-CERFACS-CNRM-CM5 (CNRM), ICHEC-EC-EARTH (ICHEC) and MPI-M-MPI-ESM-LR (MPI).These data have also been used over West-Africa [10]. Table 1 presents the eight climatic models used with daily time step outputs. The last source of data is the observed rainfall provided by the National Meteorology Agency of Togo (Météo Togo) for the period 1980-2010 for 12 stations spatially located as shown by Figure 1. The stations were selected based on the length of record period and the relative completeness of the data.
2.3. Methods
In this study, to evaluate the accuracy of the estimated data, from the models described above, the following statistical estimators were used: MBE (Mean Bias Error), RMSE (Root Mean Square Error), MPE (mean percentage error) and the correlation coefficient (R2), to test the linear relationship between simulated and
observed values. For higher modeling accuracy, these estimators should be closer to zero, and the correlation coefficient, (R2), should approach to 1. However,
[image:5.595.210.541.561.726.2]these estimated errors provide reasonable criteria to compare models but do not objectively indicate whether the estimates from a model are statistically signifi-cant. The t-Test statistic allows models to be compared and at the same time it
Table 1. Used climatic models, global model under which they are run (column 1), their Institute of origin (column 2), their short name (column 3) and RCM model Name (column 4).
Global Model Name Institute ID Model Short Name RCM Model Name GFDL-ESM2M NOAA-GFDL NOAA SMHI-RCA4
NorESM1-M NCC NCC SMHI-RCA4
MPI-ESM-LR MPI-M MPI SMHI-RCA4
MIROC5 MIROC MIROC SMHI-RCA4
IPSL-CMA5-MR IPSL IPSL SMHI-RCA4 EC-EARTH ICHEC ICHEC KNMI-RCAMO22T CNRM-CM5 CRNM-CERFACS CNRM SMHI-RCA4
DOI: 10.4236/ajcc.2019.81008 142 American Journal of Climate Change
indicates whether a model’s estimate is statistically significant at a particular confidence level. So, the t-Test was carried out on the models to determine the statistical significance of the predicted values. Lawin et al. (2019) used these me-thods in a similar study [11]:
Mean Bias Error (MBE)
To evaluate the accuracy of the predicted data from the models described above, this test provides information on the long-term performance of a model. The validation period is from 1999 to 2008. A low MBE value is desired. A nega-tive value gives the average amount of underestimation in the calculated value. The MBE value is computed by Equation (1). The subscript i refer to the ith value
of the daily rainfall; n is the number of the daily rainfall. The subscripts “s.” and “o.” refer to the simulated and measured daily climatic parameters (rainfall) values. A percentage error between −10% and +10% is considered acceptable
[17].
(
)
1
1
MBE=n
∑
n Xis−Xio ×100 (1)Root Mean Square Error (RMSE)
The value of RMSE given by Equation (2) is always positive and is zero in the ideal case. The RMSE gives information on the short-term performance of the correlations by allowing a term-by-term comparison of the deviation between the simulated and observed values. The smaller the value, the better the model’s performance is [18].
(
)
1 2 2 1
1
RMSE=n n Xis−Xio
∑
(2)The correlation coefficient (R2)
In statistics literature, it is the proportion of variability in a data set that is ac-counted for by a statistical model, where the variability is measured quantita-tively as the sum of square deviations. A high value of R2 is desirable as this
shows a lower unexplained variation. R2 is a statistic that gives some information
about the goodness-of-fit of a model. In regression, the R2 coefficient of
deter-mination is a statistical measure of how well the regression line approximates the real data points. An R2 of 1.0 indicates that the regression line perfectly fits the
data, which is never valid in any climatic parameters estimation model [18]. The relative error (E)
The relative error (EP and ET), respectively for precipitations and tempera-ture of the estimated values of the rainfall or temperatempera-ture (minimum or maxi-mum) may be calculated from the following:
EP o s
o
X X
X −
= (4)
DOI: 10.4236/ajcc.2019.81008 143 American Journal of Climate Change
Volume bias (VB) which indicates over and underestimations is representing by equation:
(
)
(
)
1 1 RCMs OBS VB OBS n t n t = = − =∑
∑
(6)RCMs and OBS designed the values of observed and simulated data for valida-tion period (1999-2008).
The t-Test statistic (t)
The tests for mean values, the random variable t with n − 1 degrees of free-dom may be written here as follows. The smaller values of t-statistic the better the performance of modeling.
(
)(
)
(
)
(
)
1 2 2 2 2 1 MBE MBE RMSE nt= − −
(7)
Mann-Kendall Trend Test:
Many techniques can be used for analyzing the series trends, yet the most commonly used technique by meteorologists is the Mann-Kendall (MK) test
[19]-[24]. There are two advantages of using this test. The Mann-Kendall test is
non-parametric, does not require normally distributed data, and has a low sensi-tivity to missing data [20]. This method has also an advantage to have a low sen-sitivity to abrupt breaks due to inhomogeneous time series [21] [24]. Null hypo-thesis H0 means that no trend changes in series data have been found (the data are independent and randomly ordered), and H0 is tested against the alternative hypothesis H1, which assumes a trend exists. The Mann-Kendall statistics are calculated as follow:
(
)
1 1 1sgn
n n
j i i j i
S − X X
= = +
=
∑ ∑
− (8)Positive S value indicates an increasing trend and negative value indicates a decreasing trend in the data series. The sign function is given as:
(
)
1 ifsgn
0
0 if 0
1 if 0
j i j i i j i j X X X X X X X X − > − = − − − < = (9)
In cases where the sample size n > 10, the statistics S is approximately stan-dard normal distribution with the mean zero and variance is denoted by the fol-lowing:
( )
(
1 2)(
5)
1(
1 2)(
5)
18 m
i i i
i
n n n t t t
VAR S =
− + − − +
=
∑
(10)DOI: 10.4236/ajcc.2019.81008 144 American Journal of Climate Change Z from the following Equation (11):
( )
( )
1 if 0
0 if 0
1 if 0
S S VAR S S S S VAR S Z − > = + < = (11)
A positive value of Z indicates an upward trend; a negative value indicates a downward trend, and a zero value indicates no trend.
Sen’s slope estimator and relative percentage change (RPC):
β which is Sen’s slope estimator, sign reflects data trend reflection, while its value indicates the steepness of the trends (Equation (12)):
Median x xj k
j k
β
−−
=
(12)
Equation bellow (13) was used to compute the relative percentage change (RPC) of the annual as well as monthly rainfall:
RCP n 100
Xmean β
= ∗
(13)
where n is the length of the trend period; β is the magnitude of the trend slope of the time series determined by the Theil-Sen median estimator; and X is the ab-solute average value of the time series. This method was used in a similar study by Tabari et al. (2013) [25] and Somée et al. (2013) [26].
Precipitation Concentration Index (PCI)
In order to study monthly and annual variability of rainfall in the study area of each weather station, a Precipitation Concentration Index (PCI) was used. The guidelines for interpretation of PCI are presented in Table 2. The PCI was designed as an indicator of rainfall concentration over specified time scales. For the purpose of this study, the PCI is calculated on an annual scale for each sta-tion. This index is described as:
12 2 1 2 12 1
PCI i i 100
i i P P = = = ∗
∑
∑
(14)Table 2. Classification of PCI adapted from Oliver (1980).
PCI Value Distribution of Precipitation
<10 Uniform precipitation distribution (i.e., low precipitation concentration) 11 - 15 Moderate precipitation concentration
16 - 20 Irregular distribution
DOI: 10.4236/ajcc.2019.81008 145 American Journal of Climate Change
where Pi is the monthly precipitation in month i. An interpretation of the PCI
classification as suggested by Oliver (1980) is represented in Table 2. Recently, many researchers [27] [28] [29] have adopted this method. In addition to the above, the frequency count of PCI classes in each station is carried out.
Changes in precipitation from the reference period:
Finally, the changes from the reference period are assessed as shown by Equa-tion (15) for precipitaEqua-tions:
FF HIST 100 HIST
p
I = − ×
(15)
where FF and HIST represent respectively the mean for the far future (2061-2090 and 2071-2100) and the historical or reference period (1981-2010) [11].
The seasonal averages as well as the annual averages were calculated using the Climate Data Operator Commands and the free software R is used to compute all the statistical parameters and the plots presented in the following [11] [12].
3. Results
This section is divided into two main parts. The first part focuses on statistical tests of the performance of the eight models used. The second part analyses the results of the seasonal and annual distribution of rainfall, changes and trends in rainfall over Mono basin in Togo.
3.1. Statistical Tests
Summarized values of statistical parameters over the period 1999-2008 are given
by Table 3. From this table, we analyze the model with the most accurate
per-formance to estimate rainfall by assessing overall perper-formances using MBE, RMSE, MPE, R2, t-test and VB. The MBE between RCMs simulations and
servations are from −18.75% to 6.72% for precipitation. The largest MBE is ob-served with models MIROC5 (mean value −18.75) and the smallest MBE is given by the multi-models’ mean (Model-Mean) where the value is −2.33. With re-gards to RMSE, the models MIROC5, GFDL-ESM2M and MPI-ESM-LR exhi-bited the largest biases for precipitation. On the other hand, the highest values of R2 for rainfall are presented by the models EC-EARTH, IPSL-CMA5-MR,
DOI: 10.4236/ajcc.2019.81008 146 American Journal of Climate Change Table 3. Summary of Statistical parameters in rainfall between GPCP and models data over Mono basin.
Model name MBE Rainfall
RMSE R2 t-test VB
GFDL-ESM2M −8.17 5.63 0.723 3.42 −8.13 NorESM1-M 5.84 2.52 0.921 2.61 15.01 MPI-ESM-LR −4.56 8.23 0.812 2.18 −13.33
MIROC5 −18.75 6.52 0.736 2.13 −3.66 IPSL-CMA5-M −3.82 2.13 0.899 7.13 7.55
EC-EARTH −6.33 4.11 0.863 4.35 13.33 CNRM-CM5 −6.13 1.63 0.833 6.71 −7.55 CanESM2 5.35 4.32 0.679 5.52 6.52 Model-Mean −2.33 1.31 0.952 1.87 11.53
Table 4. Monthly relative percentage error (E) in rainfall of the models in the present study over Mono river basin.
Models Relative error J F M A M J J A S O N D
NOAA E (mm) 0 0 1.1 −1.9 3.7 0.8 1.3 1.6 3.7 1.9 0.3 0 E (%) 0 0 6 −15 29 5 7 8 18 15 5 0
NCC E (mm) 1.6 1.4 1.1 3.7 3.4 2.3 2.6 2.2 3.9 0.8 0.9 −1.3 E (%) 6 9 6 51 34 14 14 10 15 12 37 −6.3
MPI E (mm) 0.4 1.0 1.1 0.3 1.2 2.5 3.8 2.7 2.6 1.1 2.1 1.3 E (%) 4 12 7 4 11 16 20 12 10 5 11 3
MIROC E (mm) 1.2 2 1.3 0.5 0.5 3.1 2.1 3.2 4.5 1.4 0 1.1 E (%) 6 6 15 15 17 20 12 12 16 6 0 2
IPSL E (mm) 1.7 1.7 1.2 3.0 4.8 3.9 3.3 1.0 1.3 −0.8 0.7 1.8 E (%) 8 8 4 32 37 24 22 13 17 −4 3 2
ICHEC E (mm) 1.8 0.8 1.3 −2.7 3.8 −4 0.5 1.3 1.8 2.2 −0.9 3.1 E (%) 9 3 4 −28 31 −26 31 27 19 11 −15 4
CNRM E (mm) 2.1 0.2 1.4 2.0 2.9 2.2 1.3 −2 3.3 3.2 0.4 0.5 E (%) 2 26 5 33 28 13 18 −22 15 13 11 6
CCCMA E (mm) 1.2 0.8 1.3 3.5 3.6 −3 2.5 1.4 1.2 0.3 −1.8 0.1 E (%) 4 2 3 34 25 −16 28 12 9 14 −8 12
Model-Mean E (mm) 0 0.1 0 1.9 1.3 2.8 3.1 2.5 2.3 2.7 0.2 0.3 E (%) 0 9 0 11 10 8 9 9.3 10 7 2 3
[image:10.595.208.538.331.653.2]DOI: 10.4236/ajcc.2019.81008 147 American Journal of Climate Change
by compensation or cancellation of the biases between the different RCMs. In the next section the multi-models mean only will be considered. To bi-as-correct the model future projection, the cumulative distribution function matching (CD FM) of the model in the reference period is used to identify the corresponding percentile values of the future period [10].
3.2. Variability, Changes and Trends in Rainfall
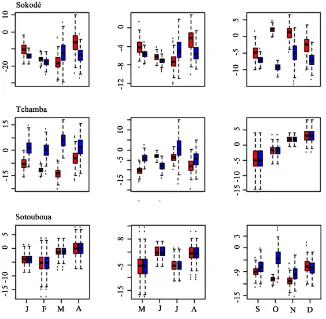
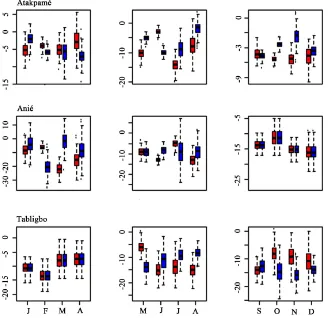
Seasonal Changes of Rainfall [image:11.595.214.540.342.661.2]Seasonal variations were investigated to provide more detail about the changes in climatological monthly precipitation, averaged across Mono basin using the multi-models mean. The analysis of the results obtained by the rainfall changes is presented in Figure 2 and Figure 3. The evolution of the monthly average rainfall amounts will be broadly characterized by a decrease and increase be-tween the 1981-2010 reference period and the far future (2061-2090 and 2071-2100). In the rainy season (May to August), all the stations selected in the basin show a decrease in fluviometric heights, in general. This indicates that Mono Basin will be characterized by late rains in the future. In any time, slices,
DOI: 10.4236/ajcc.2019.81008 148 American Journal of Climate Change Figure 3. Changes in rainfall in the South of Mono basin for each calendar month from the reference period ((1981-2010) to future (2061-2090 in color red and 2071-2100 in color blue). The band near the middle of the box shows the median and the bottom and top of the central rectangle spans the first quartile to the third quartile. Whiskers above and below the box show the location of the maximum and minimum.
results from the multi-models mean suggest a decrease in precipitation in gener-al, with no significant differences between the stations and the horizons consi-dered. Thus, the magnitude of the decrease peaks in rainy season (April to Oc-tober), with the smallest increase in dry season (November to March).
Future Annual and seasonal rainfall patterns
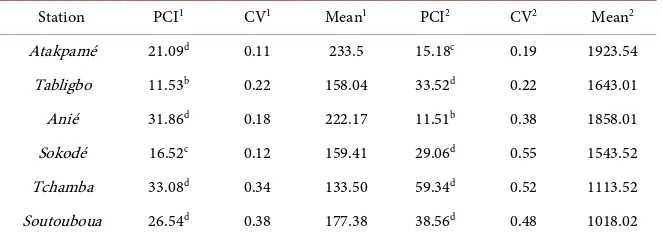
This section analyzes future annual and seasonal rainfall patterns. According to the rainfall data analysis, the long-term mean annual rainfall from 2061 to 2100 in the region is 1784.3 mm. However, as shown in Table 5, the mean an-nual rainfall ranges from 1018 to 1924 mm. The lowest rainfall (1018.02) was observed in the northern part of the basin (Tchamba) and the highest rainfall (1923.54) was recorded in the southwest of basin (Atakpamé), with a coefficient of variation of 0.48 and 0.19, respectively.
DOI: 10.4236/ajcc.2019.81008 149 American Journal of Climate Change Table 5. Annual and seasonal mean rainfall (mm), coefficient of variation and PCI (2061-2100) for the Tabligbo, Atakpamé, Anié, Sotouboua, Sokodé and Tchamba sta-tions.
Station PCI1 CV1 Mean1 PCI2 CV2 Mean2
Atakpamé 21.09d 0.11 233.5 15.18c 0.19 1923.54
Tabligbo 11.53b 0.22 158.04 33.52d 0.22 1643.01
Anié 31.86d 0.18 222.17 11.51b 0.38 1858.01
Sokodé 16.52c 0.12 159.41 29.06d 0.55 1543.52
Tchamba 33.08d 0.34 133.50 59.34d 0.52 1113.52
Soutouboua 26.54d 0.38 177.38 38.56d 0.48 1018.02
aUniform distribution, bModerate distribution, cIrregular distribution, dStrong irregular distribution. 1and 2represent Annual and seasonal mean rainfall, respectively.
precipitation distribution and a strongly irregular distribution. The highest val-ues of PCI were recorded at the Tabligbo rain gauge station. The PCI valval-ues for humid tropical climate stations (Sokodé, Sotouboua and Tchamba) were in the same range (between 16.36 and 59.34) in the climate subequatorial but with a predominant occurrence of irregular and strongly irregular distributions. The highest values of PCI were recorded at the Soutouboua and Tchamba rain gauge stations. As would be expected, these two stations are on the northwestern and northeastern flank of the study area where the mean annual total rainfall is low-est in Togo.
Rainfall Trend Analysis
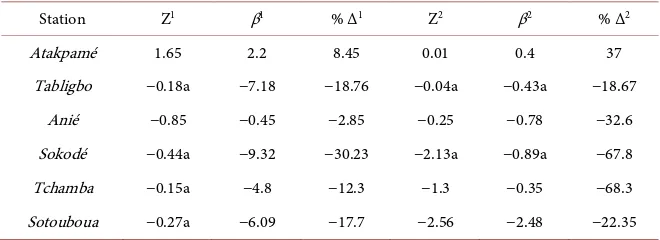
DOI: 10.4236/ajcc.2019.81008 150 American Journal of Climate Change Table 6. Trendand change analysis of Annual and seasonal mean rainfall 2061-2100 for the Tabligbo, Atakpamé, Anié, Sotouboua, Sokodé and Tchamba stations.
Station Z1 β1 % Δ1 Z2 β2 % Δ2
Atakpamé 1.65 2.2 8.45 0.01 0.4 37 Tabligbo −0.18a −7.18 −18.76 −0.04a −0.43a −18.67
Anié −0.85 −0.45 −2.85 −0.25 −0.78 −32.6 Sokodé −0.44a −9.32 −30.23 −2.13a −0.89a −67.8 Tchamba −0.15a −4.8 −12.3 −1.3 −0.35 −68.3 Sotouboua −0.27a −6.09 −17.7 −2.56 −2.48 −22.35
aand % Δ denote significant level at 5%, and percentage change, respectively. 1and 2denote Annual and
Sea-sonal mean rainfall, respectively.
(0.89 mm/year) with percentage changes of 18.67 and 67.8, respectively (Table 6). On the other hand, stations in Anié and Sotouboua show a statistically insig-nificant decreasing rainfall trend with a percentage change of 32.6% and 22.35%, respectively during this season. Station Atakpamé shows a no-significant in-creasing trend at 0.4 mm/year, with a percentage change of 37%.
4. Discussions
We notice from the above discussion that the models are performed differently for different months. Some models performed well, while others performed poorly, and vice versa. This is explained by compensation or cancellation of the biases between the different RCMs. However, the analysis herein highlighted the multi-models’ mean ability to simulate the Mono river basin rainfall adequately and therefore can be used for assessment of future climate projections for this region. To have better comprehension of results of in this paper it is important to look at the results of other regions and countries. The disparity observed in the evolution of precipitation could be due to the type of forcing models or the convection pattern used in West Africa [15]. This divergence of models on cli-mate projections on precipitation in West Africa is still uncertain [30]. The in-consistent trends and changes of rainfall noticed are likely linked to the high he-terogeneousness types seasons. Indeed, the Mono basin is characterized by two types of rainfall regime. In southern basin, there are two rainy seasons which ex-tend from mid-March to mid-July and from mid-August to October. In north-ern basin, there is one rainy season which extends from April to October.
In this study, the precipitation decreases projected by the average mul-ti-models are consistent with other studies in West Africa: Kouakou et al.[31]
DOI: 10.4236/ajcc.2019.81008 151 American Journal of Climate Change
weakening of the moisture from local sources, slowing down the hydrological cycle. Tall et al. [33], found a strong decrease in precipitation by 2100 under the RCP8.5 scenario. Thus, the results of this investigation showed that the long term mensural precipitation of study area in general has decrease. These results are in line with Dosio and Panitz [34] using the regional climate model CCLM, have predicted a significant reduction of precipitation at the end of the century in West Africa. It is also in line with the recent special IPCC report which states that West Africa will likely experience longer and more intense droughts in the near future [1] [2].
However, we note that the divergence of climate change patterns is still un-certain over the world. Some climate projections suggest an increase in the rain-fall and others indicate a decrease. Significant positive trends have been observed in the USA [35] East and Northeast Australia [36], Chinas coastal area [37],
In-dia [38], eastern and western Indochina Peninsula [39].
The results indicate that the rainfall coefficient of variability is high in the area with low annual rainfall. This is supported by Birara et al. 2018 [21], whose study confirms the relationship between the area with low annual rainfall and high va-riability of rainfall. For example, we have noted that, Atakpamé located near the mountainous area in the region receive higher amounts of rainfall as compared with the stations at lower elevations. A similar study by Haile et al. (2009) [17]
on rainfall variability in the Blue Nile region concludes that the probability of rainfall occurrence is high at stations in mountainous areas compared with sta-tions located at lower elevasta-tions.
In RCP8.5 context, the agricultural sector, main economic activity in Mono basin watershed would be affected. Furthermore, a significant decrease in water availability (surface water and groundwater) due to a decrease in rainfall showed
by [30] will exacerbate following the scenario RCP8.5. The reduction of inflow
will affect economic activities in basin. The river discharges are the most impor-tant component of hydrological cycle for water planning and management in Mono basin [40]. Indeed, due to financial and technological constraints hinder-ing a satisfactory development, and exploration of groundwater and reservoir resources in Mono basin, river water is the most accessible water for many uses such as irrigation, livestock watering, washing, energy. So all these activities will be affected.
5. Conclusion
DOI: 10.4236/ajcc.2019.81008 152 American Journal of Climate Change
Stations in the south have moderate, irregular, and strongly irregular rainfall concentrations, whereas stations in the North of basin have irregular and strongly irregular rainfall concentrations. In addition, annual and the monthly Mann Kendall trends indicate that both significant and insignificant negative and positive changes in rainfall have occurred across the Mono basin in Togo. With regard to the changes of the seasons, a decrease is found for the precipita-tions in general. In addition, it indicates that Mono Basin will be characterized by late rains in the future. It is understood that future changes in rainfall distri-bution and trends will affect the availability of water for crops, which should af-fect the productivity of rain fed agriculture. In short, further work is needed in order to improve the future impact assessments of the climate change on water resources and on some human activities such as agriculture, energy, fisheries and breeding.
Acknowledgements
We acknowledge the financial support from the Deutscher Akademischer Aus-tausch Dienst (DAAD).
Conflicts of Interest
The authors declare no conflicts of interest.
References
[1] IPCC (2013) Summary for Policymakers. Climate Change Scientific Evidence. Con-tribution of Working Group I to the Fifth Assessment Report of the Intergovern-mental Panel on Climate Change. Cambridge University Press, Cambridge, UK and New York (New York State), USA.
[2] IPCC (2014) Climate Change 2014: Synthesis Report. Contribution of Working Groups I, II and III to the Fifth Assessment Report of the Intergovernmental Panel on Climate Change. In: Pachauri, R.K. and Meyer, L.A., Eds., Core Writing Team, IPCC, Geneva, Switzerland, 151 p.
[3] Nikiema, P.M., Sylla, B., Ogunjobi, K., Kebe, I. and Giorgi, F. (2016) Multi-Model CMIP5 and CORDEX Simulations of Historical Summer Temperature and Precipi-tation Variabilities over West Africa.
[4] Wade, N.R.S., Faye, S., Dieng, M., Kaba, M. and Kane (2009) Télédétection des catastrophes d inondation urbaine: Le cas de la région de Dakar (Sénégal). Journ. d’Animat. Sci. (JAS09), 8, 203-210.
[5] Awotwi, A., Kumi, M., Jansson, P.E., Yeboah, F. and Nti, I.K. (2015) Predicting Hy-drological Response to Climate Change in the White Volta Catchment, West Africa. Journal of Earth Science & Climatic Change, 6, 249.
[6] Lambin, E.F., Geist, H.J. and Lepers, E. (2003) Dynamics of Land-Use and Land-Cover Change in Tropical Regions. Annual Review of Environment and Re-sources, 28, 205-241. https://doi.org/10.1146/annurev.energy.28.050302.105459 [7] Carney, L.T., Reinsch, S.S., Lane, P.D., Solberg, O.D., Jansen, L.S., Williams, K.P., et
DOI: 10.4236/ajcc.2019.81008 153 American Journal of Climate Change [8] Schewe, J., Heinke, J., Gerten, D., Haddeland, I., Arnell, N.W., Clark, D.B., et al. (2014) Multi-Model Assessment of Water Scarcity under Climate Change. PNAS, 111, 3245-3250. https://doi.org/10.1073/pnas.1222460110
[9] Douglas, I., Alam, K., Maghenda, M., McDonnell, Y., Mclean, L. and Campbell, J. (2008) Unjust Waters: Climate Change, Flooding and the Urban Poor in Africa. Environment and Urbanization, 20, 187-205.
https://doi.org/10.1177/0956247808089156
[10] MERF (2009) Plan d’action national d’adaptation aux changements climatiques (PANA), (National Action Plan for Adaptation to Climate Change). Republic of Togo, Lomé.
[11] Batablinle, L., Lawin, E. and Agnide, S. (2018) Africa-Cordex Simulations Projec-tion of Future Temperature, PrecipitaProjec-tion, Frequency and Intensity Indices Over Mono Basin in West Africa. Journal of Earth Science & Climatic Change, 9, 1-12. https://doi.org/10.4172/2157-7617.1000490
[12] Lawin, A.E., Batablinlè, L., Celestin, M. and Hodabalo, K. (2018) Future Extremes Temperature: Trends and Changes Assessment over the Mono River Basin, Togo (West-Africa). Journal of Water Resource and Protection, 1, 82-98.
https://doi.org/10.4236/jwarp.2019.111006
[13] D.I. Camara, M., Di edhiou, A., Sow, B.A., Diallo, M.D., Diatta, S. and Mbaye, I. (2013) Analyse de la pluie simulee par les mod_eles climatiques regionaux de CORDEX en Afrique de l’Ouest. Secheresse, 24, 14-28.
https://doi.org/10.1684/sec.2013.0375
[14] Nikulin, G., Jones, C., Giorgi, F., Asrar, G., Büchner, M., van, M.E., Christensen, O.B., Déqué, M., Fernandez, J., Hänsler, A., van Meijgaard, E., Samuelsson, P. and Sylla, M.B. (2012) Precipitation Climatology in an Ensemble of CORDEX-Africa Regional Climate Simulations. Journal of Climate, 25, 6057-6078.
https://doi.org/10.1175/JCLI-D-11-00375.1
[15] Laux, P. and Kunstmann, H. (2008) Predicting the Regional Onset of the Rainy Season in West Africa. International Journal of Climatology, 28, 329-342.
https://doi.org/10.1002/joc.1542
[16] Klutse, N., Sylla, M., Diallo, I., Sarr, A. and Dosio (2016) Daily Characteristics of West African Summer Monsoon Precipitation in CORDEX Simulations. Theoreti-cal and Applied Climatology, 123, 369-386.
https://doi.org/10.1007/s00704-014-1352-3
[17] Amoussou, E., Tramblay, Y., Totin, V.S.H., Mahé, G. and Camberlin, P. (2014) Dynamique et modélisation des crues dans le bassin du Mono (Togo/Bénin). Hy-drological Sciences Journal, 59, 2060-2071.
https://doi.org/10.1080/02626667.2013.871015
[18] Hamdy, K.E., Ahmed, E.G., El-Hussainy, F., Hamid, R. and Beheary, M.M. (2006) Optimum Solar Flat-Plate Collector Slope: Case Study for Helwan, Egypt. Energy Conversion and Management, 47, 624-637.
https://doi.org/10.1016/j.enconman.2005.05.015
[19] Khalil, S.A. and Aly, H.A.S. (2018) Comparative and Evaluate of Empirical Models for Estimation Global Solar Radiation in Al-Baha, KSA. Journal of Earth Science and Climatic Change, 9, 492. https://doi.org/10.4172/2157-7617.1000492
DOI: 10.4236/ajcc.2019.81008 154 American Journal of Climate Change [21] Yazid, M. and Humphries, U. (2015) Regional Observed Trends in Daily Rainfall Indices of Extremes over the Indochina Peninsula from 1960 to 2007. Climate, 3, 168-192.https://doi.org/10.3390/cli3010168
[22] Soro, G.E., Noufé, D., Goula Bi, T.A. and Shorohou, B. (2016) Trend Analysis for Extreme Rainfall at Sub-Daily and Daily Timescales in Côte d’Ivoire. Climate, 4, 37.
https://doi.org/10.3390/cli4030037
[23] Hountondji, Y.-C., De Longueville, F. and Ozer, P. (2011) Trends in Extreme Rain-fall Events in Benin (West Africa), 1960-2000. Proceedings of the 1st International Conference on Energy, Environment and Climate Changes, Ho Chi Minh City, 26-27 August 2011. http://hdl.handle.net/2268/96112
[24] Zhang, X., Hogg, W.D. and Mekis, E. (2001) Spatial and Temporal Characteristics of Heavy Precipitation Events over Canada. American Meteorological Society, 14, 1923-1936.https://doi.org/10.1175/1520-0442(2001)014<1923:SATCOH>2.0.CO;2 [25] Tabari, H., Somee, B.S. and Zadeh, M.R. (2011) Testing for Long-Term Trends in
Climatic Variables in Iran. Atmospheric Research, 100, 132-140. https://doi.org/10.1016/j.atmosres.2011.01.005
[26] Tabari, H. and Hosseinzadeh, P. (2011) Recent Trends of Mean Maximum and Minimum Air Temperatures in the Western Half of Iran. Meteorology and Atmos-pheric Physics, 111, 121-131.https://doi.org/10.1007/s00703-011-0125-0
[27] Some’e, B.S., Ezani, A. and Tabari, H. (2013) Spatiotemporal Trends of Aridity In-dex in Arid and Semi-Arid Regions of Iran. Theoretical and Applied Climatology, 111, 149-160. https://doi.org/10.1007/s00704-012-0650-x
[28] Valli, M., Sree, K.S. and Krishna, I.V.M. (2013) Analysis of Precipitation, Concen-tration Index and Rainfall Prediction in Various Agro-Climatic Zones of Andhra Pradesh, India. International Research Journal of Environmental Sciences, 2, 53-61. [29] Shi, W., Yu, X., Liao, W., Wang, Y. and Jia, B. (2013) Spatial and Temporal Varia-bility of Daily Precipitation Concentration in the Lancang River Basin, China. Journal of Hydrology, 495, 197-207.
[30] Hailu Birara, R., Pandey, P. and Mishra, S.K. (2018) Trend and Variability Analysis of Rainfall and Temperature. Journal of Water and Climate Change, 9, 555-569. https://iwaponline.com/jwcc/article-pdf/9/3/555/484803/jwc0090555.pdf [31] Sylla, M.B., Giorgi, F. and Coppola, E. (2013) Uncertainties in Daily Rainfall over
Africa: Assessment of Observation Products and Evaluation of a Regional Climate Model Simulation. International Journal of Climatology, 33, 1805-1817.
https://doi.org/10.1002/joc.3551
[32] Kouakou, K.E., Kouadio, Z.A., Kouassi, F.W., Goula Bi, T.A. and Savane, I. (2014) Modelisation de la temperature et de la pluviometrie dans un contexte de changement climatique: Cas de l’Afrique de l’Ouest. Afrique Sciences, 10, 145-160. [33] Diallo, I., Giorgi, F., Deme, A., Tall, M., Mariotti, L., et al. (2016) Projected Changes
of Summer Monsoon Extremes and Hydroclimatic Regimes over West Africa for the Twenty-First Century. Climate Dynamics, 49, 3931-3954.
https://doi.org/10.1007/s00382-016-3052-4
[34] Tall, M., Sylla, M.B., Diallo, I., Pal, J.S. and Faye, A. (2016) Projected Impact of Cli-mate Change in the Hydroclimatology. Theoretical and Applied Climatology, 129, 655-665.https://doi.org/10.1007/s00704-016-1805-y
DOI: 10.4236/ajcc.2019.81008 155 American Journal of Climate Change
https://doi.org/10.1007/s00382-015-2664-4
[36] Powell, E.J. and Keim, B.D. (2015) Trends in Daily Temperature and Precipitation Extremes for the Southeastern United States: 1948-2012. Journal of Climate, 28, 1592-1612.https://doi.org/10.1175/JCLI-D-14-00410.1
[37] Suppiah, R. and Hennessy, K.J. (1990) Trend in Total Rainfall, Heavy Rain Events and Number of Dry Days in Australia. International Journal of Climatology, 10, 1141-1164.
[38] Zhai, P.M., Zhang, X.B., Wan, H. and Pan, X.H. (2005) Trends in Total Precipita-tion and Frequency of Daily PrecipitaPrecipita-tion Extremes over China. Journal of Climate, 18, 1096-1108.https://doi.org/10.1175/JCLI-3318.1
[39] Rajeevan, M., Bhate, J. and Jaswal, A.K. (2008) Analysis of Variability and Trends of Extreme Rainfall Events over India Using 104 Years of Gridded Daily Rainfall Data. Geophysical Research Letters, 35.