SOIL LOSS SENSITIVITY IN THE BELSIRI RIVER BASIN USING UNIVERSAL
*
Nilotpal Kalita
Department of Geography, Pandu College
ARTICLE INFO ABSTRACT
This study is an attempt to estimate soil loss sensitivity based on universal soil loss equation (USLE) and GIS in the valley part of the Belsiri River basin falling in the state of Assam for the year 2008 and 2015. It is estimated that total soil loss fro
2008 and 2015 respectively. The average rate of soil loss from the catchment of the study area is estimated to be 0.05 ton/ha/yr and 0.06 ton/ha/yr for the years 2008 and 2015 respectively. If this rate of soil loss continued then there is most likelihood of occurring fluvial hazards like drainage congestion, flood, etc. in some areas of both side of the river particularly in downstream part of the basin. This study also reveals that although high and extr
area compared to other soil loss sensitivity zones yet erosion hazard in these two zones is highly significant because of their location in the thickly populated and intensively cultivated areas which are also
been adversely exerting great pressure on the rural economy and thus required to be noted as the priority areas in soil and water conservation planning and erosi
Copyright © 2016, Nilotpal Kalita and Rana Sarmah. This
unrestricted use, distribution, and reproduction in any medium, provided the original work is properly cited.
INTRODUCTION
Soil erosion is the result of complex parameters such as slope, rock type, relief, rainfall, as well as land use and land cover. It is a phenomenon which consists of detachments of individual soil particles from the soil mass and their transportation by erosive agents like running water and wind. And soil loss is the net mass of sediment removed from the particular portion of the slope. Soil loss is a severe environmental problem when it happens due to strong force of water action. Therefore, to check soil loss it is necessary to delineate the areas which are vulnerable to soil erosion. Soil erosion has both on
site impacts. On-site impacts are particularly important on agricultural lands where the redistribution of soil within a field, the erosion of topsoil from a field, the breakdown of soil structure and the decline in organic matter a
result in reduction of cultivatable soil depth and a decline in soil fertility (Morgan, 2005). According to Wang
on-site impact includes a decrease of effective root depth, nutrient and water imbalance in the root zone and
decrease in soil quality that leads to reduction in agricultural production.
*Corresponding author: Nilotpal Kalita,
Department of Geography, Pandu College, India.
ISSN: 0975-833X
Article History:
Received 21st December, 2015 Received in revised form 15th January, 2016
Accepted 08th February, 2016
Published online 31st March,2016
Key words:
Soil loss sensitivity,
Universal soil loss equation, GIS.
Citation: Nilotpal Kalita and Rana Sarmah, 2016.
InternationalJournal of Current Research, 8, (03), 28831
RESEARCH ARTICLE
SOIL LOSS SENSITIVITY IN THE BELSIRI RIVER BASIN USING UNIVERSAL
SOIL LOSS EQUATION IN GIS
Nilotpal Kalita and Rana Sarmah
Department of Geography, Pandu College, India
ABSTRACT
This study is an attempt to estimate soil loss sensitivity based on universal soil loss equation (USLE) and GIS in the valley part of the Belsiri River basin falling in the state of Assam for the year 2008 and 2015. It is estimated that total soil loss from the basin is 1885 tons
2008 and 2015 respectively. The average rate of soil loss from the catchment of the study area is estimated to be 0.05 ton/ha/yr and 0.06 ton/ha/yr for the years 2008 and 2015 respectively. If this rate f soil loss continued then there is most likelihood of occurring fluvial hazards like drainage congestion, flood, etc. in some areas of both side of the river particularly in downstream part of the basin. This study also reveals that although high and extreme soil loss sensitivity zones occupied less area compared to other soil loss sensitivity zones yet erosion hazard in these two zones is highly significant because of their location in the thickly populated and intensively cultivated areas which are also the economically rich areas of the study area. This high and extreme soil loss sensitivity has been adversely exerting great pressure on the rural economy and thus required to be noted as the priority areas in soil and water conservation planning and erosion control.
This is an open access article distributed under the Creative Commons Att use, distribution, and reproduction in any medium, provided the original work is properly cited.
Soil erosion is the result of complex parameters such as slope, well as land use and land cover. It is a phenomenon which consists of detachments of individual soil particles from the soil mass and their transportation by erosive agents like running water and wind. And soil loss is the the particular portion of Soil loss is a severe environmental problem when it happens due to strong force of water action. Therefore, to check soil loss it is necessary to delineate the areas which are as both on-site and off-site impacts are particularly important on agricultural lands where the redistribution of soil within a field, the erosion of topsoil from a field, the breakdown of soil structure and the decline in organic matter and nutrient levels result in reduction of cultivatable soil depth and a decline in According to Wang et al. (2003), site impact includes a decrease of effective root depth, nutrient and water imbalance in the root zone and subsequent decrease in soil quality that leads to reduction in agricultural
Brown (1984) estimated that about 23 billion tons from crops in the world is being lost every year. According to UNEP (1982), about 20 million hectare areas in the world become uneconomical for cropping each year due to soil erosion each year and erosion induce degradation (Jaiswal
There are several models and
erosion and soil loss. The notable among them are USLE, MUSLE, RUSLE, RUSLE2, WEPP, EU
3D etc. The Universal Soil Loss Equation (USLE) is extensively used for estimating the rate of soil erosion (Ghosh,
et al., 2013). Basically, USLE predicts the long
annual rate of erosion on a field slope based on rainfall pattern, soil type, topography, crop system, and management practices (soil erosion factors) (Ghosh, et al
Wang et al. (2003), Chen et al. (2010)
remote sensing techniques can provide considerably reasonable accuracy than traditional methods of soil loss study. It is also worth mentioning that than geo
role when there involves the larger area and the concern of time and cost. Judson (1965) was one of the first geologists to assess the world soil erosion (Singh
the amount of river-borne soil carried into the oceans had increased from 9.9 billion tonnes a year before the introduction of agriculture, grazing and related activities, to the present rate of 26.5 billion tonnes a year
International Journal of Current Research
Vol. 8, Issue, 03, pp.28831-28838, March, 2016
INTERNATIONAL
2016. “Soil loss sensitivity in the Belsiri River basin using Universal Soil Loss Equation in GIS 28831-28838.
SOIL LOSS SENSITIVITY IN THE BELSIRI RIVER BASIN USING UNIVERSAL
This study is an attempt to estimate soil loss sensitivity based on universal soil loss equation (USLE) and GIS in the valley part of the Belsiri River basin falling in the state of Assam for the year 2008 m the basin is 1885 tons and 1956 tons in the years 2008 and 2015 respectively. The average rate of soil loss from the catchment of the study area is estimated to be 0.05 ton/ha/yr and 0.06 ton/ha/yr for the years 2008 and 2015 respectively. If this rate f soil loss continued then there is most likelihood of occurring fluvial hazards like drainage congestion, flood, etc. in some areas of both side of the river particularly in downstream part of the eme soil loss sensitivity zones occupied less area compared to other soil loss sensitivity zones yet erosion hazard in these two zones is highly significant because of their location in the thickly populated and intensively cultivated areas which the economically rich areas of the study area. This high and extreme soil loss sensitivity has been adversely exerting great pressure on the rural economy and thus required to be noted as the
on control.
is an open access article distributed under the Creative Commons Attribution License, which permits
Brown (1984) estimated that about 23 billion tons from crops ld is being lost every year. According to UNEP (1982), about 20 million hectare areas in the world become uneconomical for cropping each year due to soil erosion each year and erosion induce degradation (Jaiswal et al., 2014). There are several models and equations for assessment of soil The notable among them are USLE, MUSLE, RUSLE, RUSLE2, WEPP, EU-ROSEM, EROSION 3D etc. The Universal Soil Loss Equation (USLE) is extensively used for estimating the rate of soil erosion (Ghosh, 2013). Basically, USLE predicts the long-term average annual rate of erosion on a field slope based on rainfall pattern, soil type, topography, crop system, and management practices
et al., 2013). Several authors like
. (2010) have stated that GIS and remote sensing techniques can provide considerably reasonable accuracy than traditional methods of soil loss study. It is also worth mentioning that than geo-informatics can play a major there involves the larger area and the concern of time was one of the first geologists to assess the world soil erosion (Singh et al., 2006). He estimated that borne soil carried into the oceans had om 9.9 billion tonnes a year before the introduction of agriculture, grazing and related activities, to the present rate of 26.5 billion tonnes a year (Singh et al., 2006). In an
INTERNATIONAL JOURNAL OF CURRENT RESEARCH
overview of global erosion and sedimentation, Pimental et al.
(1995) stated that more than 50% of the world’s pastureland and about 80% of agricultural land suffer from significant erosion (Singh et al., 2006). It has been estimated that about 113.3 m ha of land is subjected to soil erosion due to water and about 5334 m tonnes of soil is being detached annually due to various reasons in India (Narayan et al., 1983). Large number of works in the field of application of USLE/RUSLE modelling are made by Sen et al. (2001), Wang et al. (2003), Dabral et al. (2008), Karaburun, (2010), Prasannakumar et al. (2011), Ghosh
et al. (2013), Farhan et al. (2013), Jaiswal et al. (2014), are
worth mentioning. Realising the nature of the soil erosion vis-à-vis soil loss problem based on powerful climatic action and a diverse physiographic characteristic an attempt is made in this study to access the soil loss sensitivity at spatial and temporal dimensions and address the problem for management.
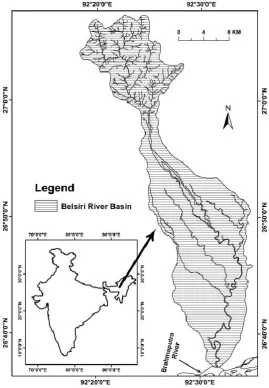
Study Area
Soil loss sensitivity is studied in the valley part of the Belsiri River in Assam extending from 26°56/N lat. to 26o37/ N lat. and 92°24'0 E long. to 92o35/ E long (Fig.1). It is located in the Tezpur Sub-division of the Sonitpur District in Assam and covers anarea of 342km2. It is along with entire North East India falls in the high and active seismic region of the world (Zone-V).
The study area dips from north to south at fairly high rate in the piedmont zone, and exhibits very gentle in the younger alluvial plains and floodplains. The height varies from 240 m along the valley-hills frontier to 60 m at the confluence with the Brahmaputra River. The climate of the region is not much different than that of the rest of the Brahmaputra valley. Hence, the study area experiences tropical monsoon climate with cool-dry winter and warm-wet summer. The average annual rainfall of the region is 200 cm. About 70% of rainfall occurs in the months of June, July and August leaving only 30% rainfall for the rest of the months. June, July, August and September are the wettest months while January to March is the driest months. The average temperature of the study area varies from20oC to 35oC in summer and 22oC in winter.
DATABASE, METHODOLOGY AND RESULT
Universal Soil Loss Equation (USLE) (Wischmeier and Smith, 1978)is used in the GIS environment to estimate the soil loss sensitivity. The general USLE is as follows:
A = R*K*LS*C*P
[image:2.595.164.434.376.765.2]where, A is average annual soil loss (t ha−1y−1); R is the Rainfall and Runoff erosivity index (in MJ mm ha-1hr-1); K is the soil Erodability factor (ton/MJ/mm); LS is the Slope and Length of Slope Factor;
C is the Crop-Cover Management Factor; P is the supporting Conservation Practice Factor. For the calculation of these factors the data are collected from various sources such as Water Resource Department and Agricultural Department of Government of Assam. Survey of India (SOI) topographical sheets of 1:50,000 scale, IRS LISS III satellite imagery of 2008 and Landsat OLI (Operational Land Imager) imagery of 2015 are used to generate terrain data. The order of works for generation of soil loss sensitivity maps is presented in Fig.2.
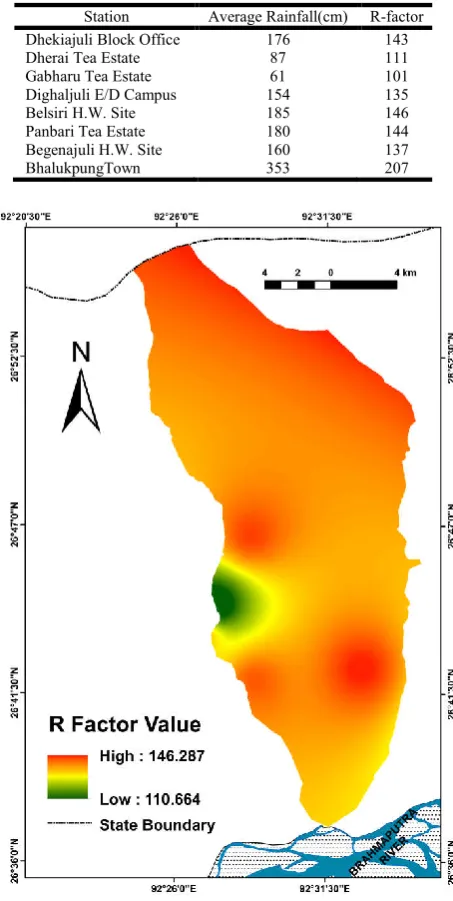
Rainfall and Runoff Erosivity Factor (R)
The rainfall-runoff erosivity factor (R) quantifies the effect of raindrop impact and reflects the amount and rate of runoff likely to be associated with rain. It is a numerical description of the ability of rainfall to erode soil (Wischmeier and Smith, 1978). The R values can also be obtained by ‘is oerodent’ maps, tables as well as historic data of the area concerned (Renard et al., 1997). But due to non-availability of daily rainfall data for all stations in the study area the equation suggested by Pandey et al. (2009) is used in estimating the R factor in the Indian context.
R= 79+0.363*P
Here, R is the annual R factor; P is the average annual rainfall in mm.
This study could get rainfall data on eight rain gauge stations available in and around the study area for calculations of R factor values. Out of these eight stations four stations fall within the study area and rest are outside of the study area. The average rainfall erositivity is calculated from rainfall data of 2008–2014.The R factor map is prepared in ArcGIS environment using inverse distance weighting (IDW) method of spatial interpolation. The main reason for selection of IDW is that the rainfall erositivity is remaining significant at exact location and distort away from the point.
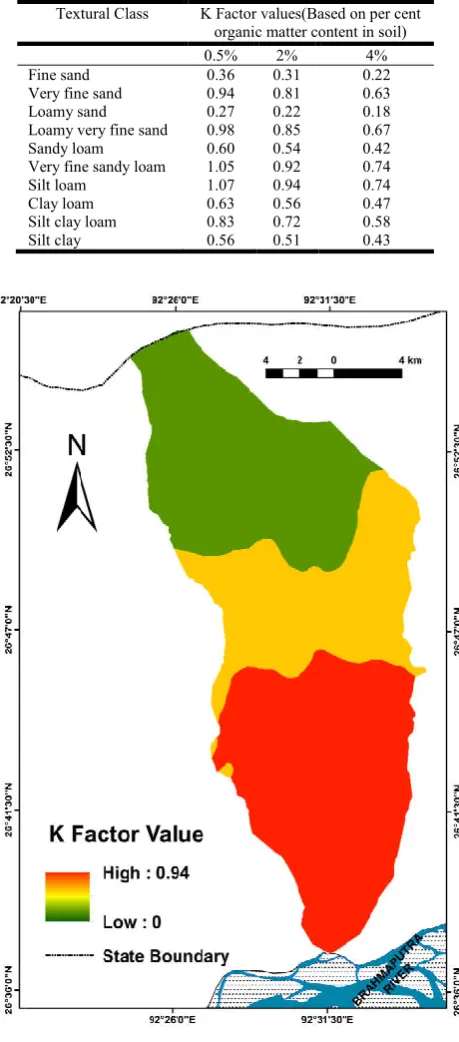
Soil erodibility factor (K)
The soil erodibility (K) values are computed from the soil map data prepared by the Department of Agriculture, Government
[image:3.595.321.548.141.592.2]of Assam. Since, K factor value is mainly related to soil texture, thus in computing soil erodibility factor soil properties are collected from the technical bulletin on soil series of Assam as well as soil samples collected through field investigation.
Table 1. Average annual rainfall (mm) and calculated R value for
the stations considered for the study
Station Average Rainfall(cm) R-factor Dhekiajuli Block Office 176 143 Dherai Tea Estate 87 111 Gabharu Tea Estate 61 101 Dighaljuli E/D Campus 154 135 Belsiri H.W. Site 185 146 Panbari Tea Estate 180 144 Begenajuli H.W. Site 160 137 BhalukpungTown 353 207
Fig. 3. Rainfall-runoff erosivity factor layer (R)
Based on the textural classes of soil and soil erodability nomograph of USLE (Foster et al., 1981) the K factor values are calculated and in creating the K factor layer map the analog data of different soil categories is converted to Arc info shape file and attribute data of soil erodibility are assigned and converted this layer into raster format. The soil erodibility factor layer map is presented in Fig.4.
LS Factor
[image:3.595.46.290.163.338.2]Out of all factors instinctive in USLE the calculation of LS factor is quite difficult in a relatively large area.
Fig. 4. Soil erodibility factor (K)
Table 3. Calculated K values on the basis of textural classes
Soil code Soil Textural Class Calculated k values AS 13 (TypicFluvaquents) Sandy Loam 0.54 AS14 (TypicFluvaquents) Sandy Loam 0.55 AS20 (DystricEutrochepts) Clay loam 0.56 AS 23 (TypicHaplaquepts) Silt Loam 0.94 AS 18 (TypicPaleudalf) Clay Loam 0.56 AS 31 (TypicHaplaquepts) Silt Loam 0.94
In the present study the LS factor is computed with the help of Digital Elevation Model (DEM) generated in ArcInfo. The DEM of the study area is 30 meter resolution and slope layer was derived from the same.
The LS calculation from the original USLE is shown below
=
22.1 (65.41 sin + 4.56 sin + 0.065)
Here, is the fieldslope length, is the angle of the slope, and M is a factor ranging from 0.2 to 0.5
For the accuracy, the LS factor is obtained by calculating both L and S separately. Slope length factor (L) was calculated on the basis of the following formula (Mc Cool et al. 1987):
= 22.1
Here, L = slope length factor; λ = field slope length m = dimensionless exponent that depends on slope steepness, being 0.5 for slopes exceeding 5%, 0.4 for 4% slopes and 0.3 for slopes less than 3% (Ghosh et al., 2013). The percent slope was determined for slope longer than 4 m on the basis of the following formulae (Mc Cool et al., 1987)
= 10.8 sin + 0.03, slopegradient ≤ 9%
= 16.8 sin − 0.50, slope gradient > 9%
Here,
is the slope steepness factor, and is the slope angle.
The LS factor of the study area is ranges between 0.03– 36.1609. The lowest ranges of LS value are dominant from the north to south along with the river network. The higher values of 12.5 are scattered from east to west of the study area. While, the very high value of 12.5 is seems to be scattered throughout the basin where the slope is high. The LS Factor layer map and Topographic Factor layer map are presented in Fig.5 and Fig.6.
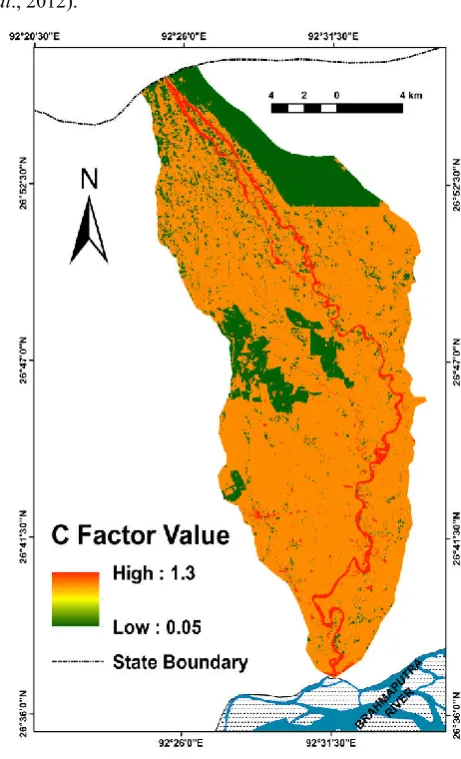
Crop Cover management Factor (C)
The C factor values are considered to be the most important from the point of view of soil erosion which represents land use and land cover practices. It represents the effect of soil-disturbing activities, plants, crop sequence and productivity level, soil cover and subsurface bio-mass on soil erosion (Prasannakumar et al., 2012) It is one of the most important factors of USLE which represents land cover and land use practices. The C factor reflects the effect of cropping and management practice on soil erosion rates, and is the factor used most often to compare the relative impacts of vegetation cover and management options on conservation tactics (Renard
et al., 1997). This C factor has a close connection to land use
and land cover types and also anthropogenic interventions on the soil erosion processes (Jaiswal et al., 2014).
Table 2. Values of erodability factor based on soil types and
per centorganic matter content in soil (Foster et al., 1981)
[image:4.595.41.283.667.739.2]Currently, due to the variety of land cover patterns with spatial and temporal variations, satellite remote sensing data sets were used for the assessment of C-factor (Karydas et al., 2009; Tian
et al., 2009). Thus, in this study the C factor values are
computed with the help of satellite remote sensing data of IRS LISS III imagery of 2008 and Lands at OLI imagery of 2015. The NDVI along with the following formula is applied to produce the C factor value image for the study area.
= [− ( / − )]
Here, and are unitless parameters that determine the shape of the curve relating to NDVI and the C factor (Prasannakumar
[image:5.595.62.371.56.739.2]et al., 2012).
Fig. 7. Crop-cover management factor, 2008
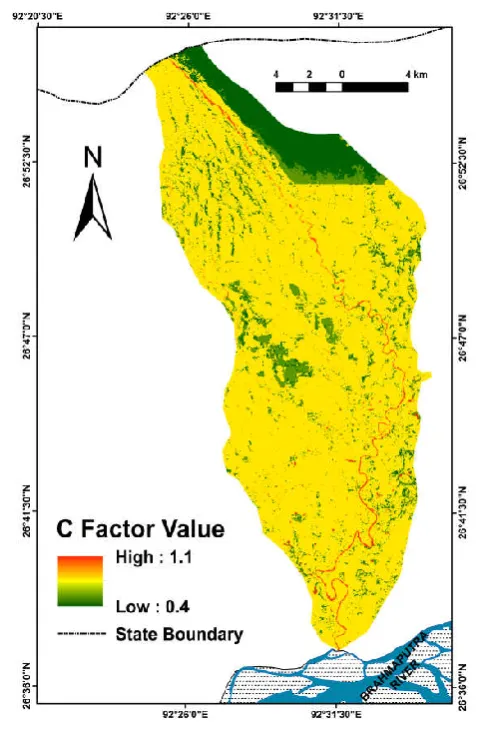
Van Der Kniff (2000), found that the scalling approach gives better result than assuming a linear relationship and values 2 and 1 were selected for the parametrs of and (Prasanna kumar et al., 2011). The C factor values for all categories of crop-cover management in the year 2008 ranges between 1.3– 0.05. The forest area has the C factor values ranging between 0.1-0.05, agricultural land is 0.8, sandy area is 1 and water bodies represent 1.3. On the other hand, for the year 2015 the C factor values of the corresponding land use classes are classified as forest 0.5–0.4, agricultural land 0.7, sandy areas 0.86, water bodies 1.1, and the overall C factor for the area ranges between 1.1–0.4.
Fig. 5. LS factor classes
[image:5.595.318.549.209.589.2][image:6.595.263.540.45.748.2]
Fig. 8. Crop-cover management factor 2015
Table 4. Magnitude of soil loss sensitivity in the study area for the year 2008
Soil Loss (ton/ha/yr)
Soil erosion sensitivity zone
Area (Km2)
Percentage of total area 0.0004 Minimal 203 60
0.0015 Low 117 34
0.0037 Moderate 16 5
0.012 High 3 0.78
[image:6.595.48.296.52.418.2]0.06 Extreme 0.05 0.02
Table 5. Magnitude of soil loss sensitivity in the study area for the year 2015
Soil Loss(ton/ha/yr)
Soil erosion sensitivity zone
Area (Km2)
Percentage of total area 0.0004 Minimal 192 57
0.002 Low 0.60 0.17
0.005 Moderate 134 40
0.02 High 11 3
0.06 Extreme 0.02 0.005
Conservation/support practice factor (P)
The support practice factor (P) is the soil loss ratio with a specific support practice to the corresponding soil loss with up and down tillage (Renard et al. 1997). The support practice factor P represents the effects of those practices such as contouring, strip cropping, terracing, etc that prevent soil erosion by reducing the rate of water runoff.
Fig. 9. Soil loss sensitivity, 2008
[image:6.595.41.284.480.551.2] [image:6.595.41.282.592.665.2]The P value range from 0 to 1; where 0 represents very good manmade erosion resistance facility and 1 represents no manmade erosion resistance facility. Values for P are generally difficult to determine and are the least reliable of all the factors (Renard et al., 1994). In the present study area no supporting practice is witnessed thus the value of P taken as 1.
Integrated assessment of soil loss sensitivity
The annual soil erosion map was prepared for the valley part of the Belsiri basin, which is characterized by a plain topography and thus the erosion rates are mostly depended on the nature of the fluvial erosion. The average soil erosion rate of the river basin for the year 2008 is estimated at 0.05 ton/ha/yr, and for the year 2015 at 0.06 ton/ha/yr. The agricultural areas are found to be more prone to water erosion compared to the forest areas. The rainfall was more or less similar for the years under consideration and thus the rate of soil loss is found to be mainly dependent on LS factor of the study area. Magnitude of soil loss sensitivity in the study area for the years 2008 and 2015 is presented in table-4 and table-5 respectively. Maps showing integrated assessment of soil loss sensitivity for the years 2008 and 2015 are presented in Fig.9 and Fig.10 respectively.
DISCUSSION
Soil loss sensitivity in the valley part of the Belsiri basin is found to be quite similar in magnitude in the years 2008 and 2015. Soil loss sensitivity maps presented in Fig.9 and Fig.10 evident significant spatial changes among the soil loss sensitivity classes in the years under study. This means the influence of various factors on soil loss clearly indicate that each one physically govern factors has a positive co-relationship with it (Sarmah, 2015). It is seen in both the maps that there is a thick canopy cover at the upper right part of the study area due to existence of a reserve forest. But, areas under low to extreme soil sensitivity zones, particularly the moderate and the high zones, are considerably high in the year 2015 compared to 2008. This situation is happened because of deforestation through illegal felling of trees in the reserve forest. The middle and downstream part of the basin mostly falling in the eastern side, in most of the cases at the proximity of the river shows moderate, high and extreme soil loss sensitivity zones (Fig.9 and Fig.10). Similar observation is also made by Sarmah (2015) in the Mora Dhansiri River basin and Jaiswal (2014) in the Panchnoi River basin which are closed to the present study area. The areas which are mainly put to settlements and raising crops mostly falls in the high to extreme soil loss sensitivity zones in both the years under study. Since there is no water conservation practice in the study area and the ground is almost gentle rainfall plays vital role in soil loss sensitivity (Sarmah, 2015). Minimal to low soil loss sensitivity is evident in the piedmont zone part covering almost upstream half of the basin (Fig.9 and Fig.10) This is mainly because of course soil texture which allows runoff to percolate fast reducing soil loss. It is estimated that total soil loss from the study area is 1885 ton, and 1956 ton during the years 2008 and 2015 respectively. The average rate of soil loss from the catchment of the study area is estimated to be 0.05 ton/ha/yr and 0.06ton/ha/yr in the years 2008 and 2015 respectively (Table-4 and table-5). The integrated assessment of soil loss from the basin evidences highest surface area i.e. 203 km2 and
192 km2 under minimal sensitivity class in the years 2008 and 2015 respectively (table-4 and table-5). However, there is 5% decrease in surface area coverage in the minimal soil loss sensitivity class during 2008-15. But in all other soil sensitivity classes the area under them increased during 2008-15 (Table-4 and Table-5).
Conclusion
In the study it is observed that barren land and degraded forests are most favourable condition for erosion. To achieve sustainability in agricultural as well as human livelihood and environment quality soil erosion from LULCs should be minimize to a great extent. This study estimated that total soil loss from the study area is 1885 ton, and 1956 ton during the years 2008 and 2015 respectively. The average rate of soil loss
from the catchment of the study area is estimated to be 0.05 ton/ha/yr and 0.06 ton/ha/yr in the years 2008 and 2015
respectively. Continuation of this rate of soil loss may lead to occurrence of fluvial hazards like flood, bank erosion, etc in some downstream areas. This study also reveals that although high and extreme soil loss sensitivity areas occupied less area compared to other zones yet they are mainly distributed in the thickly populated and intensively cultivated areas which are also the economically active and rich areas of the study area. This has been exerting great pressure on the rural economy and thus required to be noted as the priority areas in soil and water conservation planning and erosion control (Sarmah, 2015).
REFERENCES
Brown, L.R.1984. Conserving Soils, In: State of the World, (ed. by L.R. Brown), Norton, New York, pp. 53-75.
Chen, T., Niu, R., Li, P., Zhang, L. and Du, B. 2010. Regional Soil Erosion Risk Mapping Using RUSLE, GIS, and Remote Sensing: A Case Study in Miyun Watershed,
Environmental Earth Sciences, Vol. 63, No. 3, 2010, pp.
533-541.
Dabral, P.P., Baithuri, N. and Pandey, A. 2008. Soil Erosion Assessment in a Hilly Catchment of North Eastern India Using USLE, GIS and Remote Sensing, Water Resources
Management, Vol. 22, No. 12, pp. 1783- 1798
Farhan, Y., Zregat, D. and Farhan, I. 2013. Spatial estimation of Soil Erosion Risk Using RUSLE Approach, RS, and GIS Techniques: A Case Study of Kufranja Watershed, Northern Jordan. Journal of Water Resource and
Protection, 5(12) pp. 1247-1261
Foster, G.R., McCool, D.K., Renard, K.G., and Moldenhauer, W.C. 1981. Conversion of the Universal Soil Loss Equation to SI metric units. Journal of Soil and Water Conservation,
36(6), pp. 355-359.
Ghosh, K., De, S.K., Bandyopadhyay, S., Saha, S. 2013. Assessment of Soil Loss of the Dhalai River Basin, Tripura, India Using USLE, International Journal of Geosciences, 2013, 4, 11-23.
Jain, M.K., Mishra, S.K. and Shah, R.B. 2010. Estimation of sediment yield and areas vulnerable to erosion and deposition in an Himalayan watershed using GIS, Current Science, Vol. 98, No.2,25 January 2010, pp. 213-221. Jaiswal, M., Thakuria, G., Borah, A.C. and Saikia, R. 2014.
river basin, Northeast India, using revised universal soil loss equation (rusle), The Clarion Volume 3 Number 1 (2014) PP. 51-60
Judson, S. 1965. Physical Geology, Prentice Hall, NJ, USA, 3rdedn, pp. 143–144.
Karaburun, A. 2010. Estimation of C factor for soil erosion modeling using NDVI in Buyukcekmece watershed’, Ozean
Journal of Applied sciences, 3(1) pp. 77-85.
Karydas, C.G., Sekuloska, T. and Silleos, G.N. 2009. Quantification and site-specification of the support practice factor when mapping soil erosion risk associated with olive plantations in the Mediterranean island of Crete.
Environmental Monitoring and Assessment, 149, pp.19-28.
Lal, R. 1996. Deforestationand Land Use Effects on Soil Degradation and Rehabilitation in Western Nigeria. III. Run- off, Soil Erosion and Nutrient Loss, Land
Degradation & Development, Vol. 7, No. 2, 1996, pp.
99-119.
Mbugua, W. 2009. Using GIS techniques to determine RUSLE’s ‘R’ and ‘LS’ factors for Kapingazi River Catchment,’ Master’s thesis. Kenya: Jomo Kenyatta University of Agriculture and Technology.
McCool, D.K., Foster, G. R., Mutchler, C. K. and Meyer, L. D. 1987.Revised Slope Steepness Factor for the Universal Soil Loss Equation, Transactions of the ASAE, Vol. 30, No. 5, pp. 1387-1396.
Morgan, R.P.C. 2005. Soil erosion and conservation, Blackwell publishing, Malden, USA.
Narayan, D. V. V. and Babu, R. 1983.Estimation of soil erosion in India. J. Irrig. Drain Eng., 109, pp. 419–431. Pandey, A., Mathur, A., Mishra, S. K. and Mal, B. C. 2009.
Soil Erosion Modelling of a Himalayan Watershed Using RS and GIS, Environmental Earth Sciences, Vol. 59, No. 2, pp. 399-410.
Pimental, D. C., Harvey, C., Resosudarmo, P., Sinclair, K., Kurz, D., McNair, M., Crist, S., Sphpritz, L., Fitton, L., Saffouri, R. and Blair, R. 1995.Environmental and economic cost of soilerosion and conservation benefits.Science, 267, pp. 1117–1123.
Prasannakumar, V., Shiny, R., Geetha, N. and Vijith, H. 2011. Spatialprediction of soil erosion risk by remote sensing, GIS and RUSLEapproach: a case study of Siruvani river watershed in Attapady valley, Kerala, India. Environmental
Earth Sciences, 64, pp. 965-972.
Prasannakumar, V., Vijith, H., Abinod, S. and Geetha, N. 2012. Estimation of soil erosion risk within a small mountainous sub-watershed in Kerala, India, using Revised Universal Soil Loss Equation (RUSLE) and geo-information technology, Geoscience Fontiers, 3(2) ,pp. 209-215
Prasannakumar, V., Vijith, H., Geetha, N. and Shiny, R. 2011. ‘Regional scaleerosion assessment of a sub-tropical highland segment in the Western Ghats of Kerala, South India. Water Resources Management, 25, pp. 3715-3727. Renard, K.G., Foster, G.R., Weesies, G.A., McCool, D.K. and
Yoder D.C. 1997. ‘Predicting Soil Erosion by Water: A
Guide to Conservation Planning with the Revised Universal Soil Loss Equation (RUSLE)’, Agriculture Handbook, vol. 703. US Department of Agriculture, Washington, DC, pp. 1 - 251.
Renard, K.G., Laflen, J.M., Foster, G.R. and McCool, D.K. 1994. ‘The revised universal soil loss equation’. In: Lal, R.(Ed.), Soil Erosion Research Methods. 2nd ed. Soil and Water Conservation Society, St. Lucie Press, pp. 105–124. Rose, C. W. and Dalal, R. C. 1988. Erosion and Runoff of
Nitrogen, In: J. R. Wilson, Ed., Advances in Nitrogen Cy-
cling in Agricultural Ecosystems, CAB International,
Wallingford, pp. 212-235.
Sarma, J. 1993. A book on the rivers of Assam, Assam Sahitya Sabha, Edition 1, pp. 228-234
Sarmah, R. 2015. Soil loss assessment using revised universal soil loss equation and GIS in an agricultural watershed in Assam, Journal of Indian Geomorphology, vol.3, In Press
Sen, T. K., Murali, S., Dubey, P. N. and Velayutham, M. 2001. Soil erodibility of Jorhat and Sibsagardistricts of Assam,
Agropedology II: pp. 45-52.
Singh, R. and Phadke, V.S. 2006. Assessing soil loss by water erosion in Jamni River Basin, Bundelkhand region, India, adopting universal soilloss equation using GIS, Current
Science, Vol. 90, No. 10, 25 May 2006, pp. 1431-1435.
Tian, Y.C., Zhou, Y.M., Wu, B.F. and Zhou, W.F. 2009. Risk Assessment of Water Soil Erosion in Upper Basin of Miyun Reservoir, vol. 57. Environmental Geology, Beijing, China, pp. 937-942.
UNEP, 1982. (United Nations Environment Programme) World’s soil policy, Nairobi, Kenya: United Nations Environment Programme.
Van De, N., Douglas, I., McMorrow, J., Lindley, S., Binh, D.K.N.T., Van, T.T. and Tho, N. 2008. Erosion and nutrient loss on sloping land under intense cultivation in southern Vietnam, Geographical Research, 46 (1), pp.4 -16.
Van der Knijff, J. M., Jones, R. J. A and Montanarella, L. 2000. Soil Erosion Risk Assessment in Europe, Office for Official Publications of the European Communities, Luxembourg, 2000, pp. 34
Van der Knijff, M., Jones, R. J. A. and Montanarella, L. 1999. Soil Erosion Risk in Italy, Office for Official Publications of the European Communities, Luxembourg, pp.54
Walling, D. E. 1988. Erosion and sediment yield research – some recent perspectives. J. Hydrol., 100, pp. 113–141. Wang, G., Gertner, G., Fang, S. and Anderson, A. B. 2003.
Map- ping Multiple Variables for Predicting Soil Loss by Geo- statistical Methods with TM Images and a Slope Map,
Photogrammetric Engineering & Remote Sensing, Vol. 69,
pp. 889-898.
Wischmeier, W.H. and Smith, D.D. 1978.Predicting Rainfall Erosion Losses - A Guide to Conservation Planning. A griculture Handbook No. 537. US Department of Agriculture Science and Education Administration, Washington, DC, USA, pp. 163.