ISSN Online: 2160-0481 ISSN Print: 2160-0473
DOI: 10.4236/jtts.2018.84015 Oct. 18, 2018 273 Journal of Transportation Technologies
An Alternative Regression-Based Approach to
Estimate the Crash Modification Factors of
Multiple Treatments Using Before-and-After
Data
Uditha Galgamuwa
*, Sunanda Dissanayake
Department of Civil Engineering, Kansas State University,Manhattan, KS, USA
Abstract
Before-and-after methods have been effectively used in the road safety studies to estimate Crash Modification Factors (CMFs) of individual treatments as well as the multiple treatments on roadways. Since the common practice is to apply multiple treatments on road segments, it is important to have a method to estimate CMFs of individual treatment so that the effect of each treatment towards improving the road safety can be identified. Even though there are methods introduced by researchers to combine multiple CMFs or to isolate the safety effectiveness of individual treatment from CMFs developed for multiple treatments, those methods have to be tested before using them. This study considered two multiple treatments namely 1) Safety edge with lane widening 2) Adding 2 ft paved shoulders with shoulder rumble strips and/or asphalt resurfacing. The objectives of this research are to propose a regres-sion-based method to estimate individual CMFs estimate CMFs using be-fore-and-after Empirical Bayes method and compare the results. The results showed that having large sample size gives accurate predictions with smaller standard error and p-values of the considered treatments. Also, results ob-tained from regression method are similar to the EB method even though the values are not exactly the same. Finally, it was seen that the safety edge treat-ment reduces crashes by 15% - 25% and adding 2 ft shoulders with rumble strips reduces crashes by 25% - 49%.
Keywords
Crash Modification Factors for Multiple Treatments, Negative Binomial Models, Safety Edge Treatments, Paved Shoulders, Empirical Bayes Method
How to cite this paper: Galgamuwa, U. and Dissanayake, S. (2018) An Alternative Regression-Based Approach to Estimate the Crash Modification Factors of Multiple Treatments Using Before-and-After Data. Journal of Transportation Technologies, 8, 273-290.
https://doi.org/10.4236/jtts.2018.84015
Received: August 29, 2018 Accepted: October 15, 2018 Published: October 18, 2018
Copyright © 2018 by authors and Scientific Research Publishing Inc. This work is licensed under the Creative Commons Attribution International License (CC BY 4.0).
DOI: 10.4236/jtts.2018.84015 274 Journal of Transportation Technologies
1. Introduction
Motor traffic injuries are one of the predominant causes of fatalities in the world as well as in the United States [1][2]. More than 32,000 fatalities per year have
been reported in the United States from 2009 to 2014 [3]. Furthermore, it was
identified that the lane-departure crashes account for approximately 54% of the total motor vehicle fatalities in the United States. Similar to the national level, Kansas has experienced more than 350 motor vehicle fatalities per year from
2009 to 2014 and nearly 60% of those are due to lane-departure crashes [4].
Therefore, many different treatments have been implemented on Kansas road segments such as lane widening, adding paved shoulders, rumble strips, safety edge treatments, chevrons, and cable median barriers to reduce lane-departure crashes as well as all crashes. This research estimates safety effectiveness of two treatments; safety edge treatments and adding 2 ft paved shoulders on Kansas rural two-lane road segments where the date of implementation of those treat-ments are known. However, those treattreat-ments were implemented with some oth-er treatments. Thoth-erefore, the efforts have been made to isolate the safety effec-tiveness of individual treatments.
Crash Modification Factors (CMFs) were used to estimate the safety effec-tiveness of the considered treatments. Before-and-after studies such as Empirical Bayes (EB) method have been proven to be effective in estimating CMFs of the treatments where the date of implementation is known, yet those methods would estimate the combined CMFs if the considered road segments had mul-tiple treatments. Even though, the relationships between individual treatments and the combined treatments have been investigated it is difficult to find the ex-act relationship between those treatments for a given region due to differences in various factors affecting crashes. Therefore, an alternative regression-based me-thod was introduced in this study. Generalized Linear Regression modeling with Negative Binomial error structure was used to fit the regression models using before and after data. Furthermore, before-and-after EB method was used to es-timate CMFs for multiple treatments. Commonly used methods of estimating combined CMFs due to multiple treatments using individual CMFs were used to isolate the safety effectiveness of safety edge treatments and adding 2 ft paved shoulders. Finally, results from both models were compared and the advantages and limitations are discussed in the results and conclusions.
2. Literature Review
Different methods have been used by researchers to develop CMFs, and many of
those methods are summarized in the Highway Safety Manual [5]. These
implemen-DOI: 10.4236/jtts.2018.84015 275 Journal of Transportation Technologies
tation of the treatment is not required so that the method can be used to
esti-mate CMFs in situations where the date of implementation is not known [5].
Out of the many methods of estimating CMFs using before-and-after data, EB method is proven to provide accurate results by accounting for the regres-sion-to-the-mean effect [6] [7][8][9]. However, if the road segment had mul-tiple treatments at the same time, EB method usually estimates the combined CMF due to multiple treatments.
2.1. Predicting CMFs for Multiple Treatments
Many methods have been introduced in the past to combine individual crash modification factors to predict combined safety effectiveness due to multiple treatments. Same methods can be used to estimate CMFs of one treatment if the CMFs of the combined treatments and the other individual treatments are known. Following are few of the commonly used approaches that have been uti-lized to combine individual CMFs to estimate the safety effectiveness due to multiple treatments [5][10][11][12].
– Organize CMFs based on crash types and their applications into groups.
– Previous experience and expert judgment.
– Apply a weightage factor to a multiplication of CMFs.
– Assume independence between the treatments and take the product of all the
CMFs.
– Apply only the most effective CMF.
However, any of these methods haven’t been proven to be effective in all the regions. Therefore each method should be tested before applying the methods in another region other than the regions that they have been proven to be effective.
2.2. Past Studies on Considered Treatments
Since this study tries to estimate combined CMFs due to safety edge treatments with lane widening and adding 2 ft paved shoulders with asphalt resurfacing and/or shoulder rumble strips and the individual CMF due to safety edge, lane widening, adding 2 ft paved shoulder, asphalt resurfacing and adding shoulder rumble strips, previous literature on those treatments were considered so that the results can be compared with other studies.
2.2.1. Safety Edge Treatment
Safety edge enables drivers to safely re-enter into the travel lane who drifted off the highway [13]. It has been proven to reduce all crashes, run-off-road crashes,
and pavement drop of crashes in many states including Iowa [14]. A study
con-ducted in Iowa using before-and-after EB method showed that implementing safety edge treatment reduced all non-intersection crashes by 13% and fatal and injury crashes by 16%. Also, it was found that due to safety edge treatments total run-off-road (ROR) crashes were reduced by 12% and the injury ROR crashes
decreased by 8% [15]. However, a study conducted in Georgia, Indiana, and
ef-DOI: 10.4236/jtts.2018.84015 276 Journal of Transportation Technologies
fects due to implementing safety edge treatments on two-lane road segments. Results obtained from EB method for Georgia and Indiana showed that having safety edge treatments reduced total crashes and fatal and injury crashes up to 11% and 44%, total ROR crashes and fatal and injury ROR crashes up to 14% and 46% and drop off related all crashes and fatal and injury crashes up to 10% and 38%. Cross-sectional study showed that having safety edge treatments on two-lane roads in Georgia, Indiana, and New York reduced total crashes and fatal and injury crashes up to 48% and 70%, total ROR crashes and fatal and in-jury ROR crashes up to 57% and 81% and drop off related all crashes and fatal and injury crashes up to 70% and 86%. However, it was seen that in the cross-sectional method the standard error of the safety edge treatments had larger values than in EB method [16].
2.2.2. Increasing Lane Width
Having larger lane widths in the past studies have shown both crash reduction and crash increase effect. A study conducted in Indiana showed that increasing lane width associated with fewer crashes on rural two-lane roads [17]. However, literature also revealed that having larger lane widths have a positive association with crashes. In a study conducted in Florida, 10 ft lane width instead of 12 ft lanes reduced 42% of all crashes on rural multilane roads and 27% on rural two-lane roads. Also, the same study showed that having 11 ft lane widths in-stead of 12 ft lane reduced 24% of crashes on rural multilane roads and 15% crashes on rural two-lane roads in Florida [18].
2.2.3. Adding Paved Shoulders
Literature indicated that adding paved shoulders have both crash reduction and increasing effect on two-lane and four-lane road segments. A study conducted in Kansas using cross-sectional method showed that having 2 ft paved shoulders reduce lane-departure crashes by 12% - 18% and 11% - 34% on the rural undi-vided the tangent and curved road segments respectively. Also, the study showed that having 2 ft paved shoulders reduce fatal and injury lane-departure crashes by 6% - 16% and 7% - 21% on a tangent and curved road segments in Kansas
[19]. Even though there is much literature indicated that the paved shoulders
reduce crashes, there are few which conclude that the paved shoulders are posi-tively associated with crashes. A study conducted in Illinois estimated the safety effectiveness of adding and widening paved shoulders on rural multilane and two-lane road segments. The results showed that widening paved shoulders from 4 and 6 ft to 8 ft increased shoulder related fatal crashes by 4% - 7% and reduced injury crashes by 3% - 7%. Also, the study showed that adding 6 ft or 8 ft paved shoulders have increased shoulder related fatal crashes by 8% - 10% and injury crashes by 5% - 8% [20].
2.2.4. Asphalt Resurfacing
DOI: 10.4236/jtts.2018.84015 277 Journal of Transportation Technologies
showed both negative and positive impacts on the crashes. A study conducted in Florida showed that resurfacing multi-lane roadways increased total crashes by
1% while reducing severe crashes by 5% and rear-end crashes by 1% [21].
Another study conducted in York, Canada showed that refinish pavement with resurfacing treatment reduced all crashes by 14% - 26%, where AADT is less than 7000 vehicles per day (vpd) but has an increasing effect of 6% on the roads with AADT greater than 7000 vpd [22].
2.2.5. Shoulder Rumble Strips
Shoulder rumble strips are placed to alert the drivers who are likely to leave the travel lanes. Currently, the shoulder rumble strips are used in most of the rural highways as a countermeasure to reduce drift-off-roadway crashes [23]. A study conducted in Florida for rural multi-lane highways showed that having shoulder rumble strips reduced all crashes by 24% - 35%, fatal and injury crashes by 36% - 40%, single-vehicle ROR (SVROR) by 30% - 35% and fatal and injury
SVROR by 31% - 48% [11]. A study conducted in Kansas showed that the
shoulder rumble strips reduced lane-departure crashes by 6% - 15% on rural two-lane undivided road segments, but have a mixed effect of −25% - 5% in curved road segments. However, the results of the same study showed that shoulder rumble strips have crash reduction effect of 5% - 10% and 6% - 19% on fatal and injury lane-departure crashes on the rural two-lane tangent and curved road segments [19].
3. Data and Methodology
This section sumerises how the data were prepared for the proposed regression based method and the EB method. Furthermore, this section sumerises metho-dology of estimating CMFs based on both methods.
3.1. Data
Crash related information including the location of the crash, crash year, and the severity was obtained from Kansas Crash Analysis and Reporting System (KCARS) database and the geometric and traffic related characteristics of before and after periods of the treatments on each road segment were extracted from Control Section Analysis System (CANSYS), which is the Kansas state highway system database. Three years before and three years after data were extracted for the considered treatments excluding the year of the treatment. Three roads were identified as having safety edge treatment with lane widening with the total length of 72 miles. Twelve roads were identified to have adding 2 ft paved shoulder treatment with asphalt resurfacing and/or shoulder rumble strips with the total length of 461 miles.
DOI: 10.4236/jtts.2018.84015 278 Journal of Transportation Technologies
period, 17 lane-departure crashes and 3 fatal and injury lane-departure crashes in after period. Road segments which had adding 2 ft paved shoulders with as-phalt resurfacing and/or shoulder rumble strips experienced 674 crashes and 150 fatal and injury crashes in before period, 655 crashes and 146 fatal and injury crashes in after period. Furthermore, those segment experienced 186 lane-departure crashes and 72 fatal and injury lane-departure crashes in before period, 187 lane-departure crashes and 75 fatal and injury lane-departure crash-es in after period.
3.2. Regression Method Using Before-and-After Data
3.2.1. Data Preperation
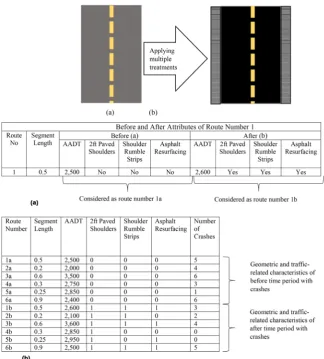
Figure 1 illlustrates the data preperation for the proposed method using hypo-thetical example which assumed that the considered road segment had road re-surfacing and 2 ft paved shoulders with shoulder rumble strips.
As shown in Figure 1, before the treatments have been applied the road
seg-ments did not have 2 ft paved shoulders, shoulder rumble strips or asphalt re-surfacing. Therefore, those variable in the before period is zero as shown in Fig-ure 1(b), route number 1a. However, the considered road segment had all the treatmnets at the same time. Therefore, the corresponding values for those treatment variables are one, as shown in Figure 1(b), route number 1b. Segment length remains the same since the same road segment was considered, however,
AADT and number of lane-departure crashes were varied as shown in Figure
1(b), route number 1a, and 1b. Since the before and after characteristics of the same road segment was considered the effect of not considering the driver beha-viour and environmental-related characteristics in the SPF in EB method can be minimized.
3.2.2. Model Development
A generalized linear regression model using Negative Binomial error structure was employed to develop models to estimate individual effect of each treatment. Equation 1 shows the general form of the negative binomial regression model which is modified for the crash frequency modeling [24][25].
lny X= β ε+ i (1)
where,
y = n × 1 observations of crashes;
β = p× 1 vector of estimated regression parameters corresponding to
geome-tric design and traffic volume related independent variables;
X = n × pknown independent model matrix of geometric design and traffic
volume related variables;
i
ε = n × 1 random vector variables (error).
The mean–variance relationship of negative binomial distribution can be ex-pressed as shown in Equation (2).
( )
( )
( )
2DOI: 10.4236/jtts.2018.84015 279 Journal of Transportation Technologies
Figure 1. Hypothetical example of data preparation for proposed regression based
me-thod.
where,
( )
Var y = variance of observed crashes;
E(y) = μ = expected crash frequency;
k = overdispersion parameter.
The maximum likelihood method estimates the coefficients in the linear re-gression model and the maximum likelihood function L y x
(
, , ,β σ2)
is shownin Equation (3)[26].
(
)
(
)
(
)
2 2
2 2 1
2
1 1
, , , exp
2 2
n
n i
L y x y µ
σ β σ
πσ =
= − −
∑
(3)DOI: 10.4236/jtts.2018.84015 280 Journal of Transportation Technologies
rumble strips. Segment length, access control, average lane width, terrain type, posted speed limit, the percentage of heavy vehicles, AADT, the presence of 2 ft paved shoulders only, presence of 2 ft paved shoulders with shoulder rumble strips and asphalt resurfacing were considered as the explanatory variables. When developing both models influence points were identified using DFBETAS, which indicates how much influence does one observation has in the determina-tion of particular regression coefficient [27].
3.3. Before-and-After EB Method
The same dataset used to develop regression models was used to estimate CMFs using EB method. Since all the road segments with considered treatments are on rural two-lane undivided road segments, safety performance function given in HSM was used to predict average crash frequencies determined for base condi-tions on the respective road segment in before and after period as shown in Eq-uation (4). Since it was decided to develop CMFs for all crash types and lane-departure crashes, the proportion of lane-departure crashes to the all crashes were calculated using reference sites. Also, proportions of fatal crashes to all crashes were calculated so that these models can be used to predict lane-departure crashes as well as fatal and injury crashes. When selecting ref-erence sites, variables such as access control, lane width, shoulder type, shoulder width, rumble strips, posted speed limit, AADT and percentage of heavy vehicles were used. Equation (5) was used to predict average crash frequency for a spe-cific year after calibrating SPF for the local conditions using the calculated cali-bration factors and Equation 6 was used to estimate the expected number of crashes during before period [5][8].
( )6 ( 0.312)
365 10 e
spf rs i i
N = AADT L× × × − × − (4)
where,
spf rs
N = Predicted average crash frequency for base conditions using a
statis-tical regression model;
AADT = Annual average daily traffic (vehicles/day) on road segments i;
Li = Length of roadway segment i (miles).
(
)
predicted spfx CMF1x CMF2x CMFyz x
N =N × × × × ×C (5)
where,
predicted
N = Predicted average crash frequency for a specific year for site type x;
spf x
N = Predicted average crash frequency determined for base conditions of
the SPF developed for site type x;
2
CMFx = Crash modification factors specific to SPF for site type x; and
x
C = Calibration factor to adjust SPF for local conditions for site type x.
(
)
expected, ,T B i predicted, ,T B 1 i observed, ,T B
N =w N + −w N (6)
where,
expected, ,T B
N = Expected crash frequency without safety edge/adding 2 ft paved
DOI: 10.4236/jtts.2018.84015 281 Journal of Transportation Technologies predicted, ,T B
N = Predicted crash frequency estimated using Equation (5);
observed, ,T B
N = Observed crash frequency in the before period;
i
w = Weight factor based on overdispersion parameter and the predicted
crash frequencies in before period.
Finally, CMFs were calculated using the expected number of crashes in after period and the observed crash frequencies.
3.4. Estimating CMFs for Individual Treatments
Three of the commonly used methods were identified to estimate combined ef-fect of treatments using their individual CMFs as shown in Equation (7), (8) and (9) [5][11][12].
Method 1: Assume Independence of Treatment
CT 1 2
CMF =CMF CMF× × × CMFn (7)
where,
CMFCT = CMFof combined treatments;
CMF1 = CMF of 1st treatment; CMF2 =CMF of 2nd treatment; CMFn = CMF of nth treatment.
Method 2: Systematic Reduction of Safety Effect of Less Effective Reduction
CT 1 2,Reduced
CMF =CMF CMF× (8)
where,
CMFCT= CMF of combined treatments;
CMF1 = CMF of 1st treatment.
2,Reduced 1 CMF2 2
CMF M
2 C F
= − + ; CMF2 is the less effective treatment.
Method 3: Multiply by Weighted Factor
[
]
(
(
1 2)
)
MF Turner Metho 1 2 1 CMF CMF
3 d
CT
C = − − ×
− (9)
where;
CMFCT = CMF of combined treatments;
CMF1 =CMF of 1st treatment; CMF2 = CMF of 2nd treatment.
DOI: 10.4236/jtts.2018.84015 282 Journal of Transportation Technologies
CMFs for other treatments such as increasing lane width, adding 2 ft paved shoulders with shoulder rumble strips and asphalt resurfacing could not be found for Kansas two-lane rural road segments. Therefore, CMFs estimated from the regression method was used when calculating individual CMFs using previously mentioned methods.
4. Results and Discussion
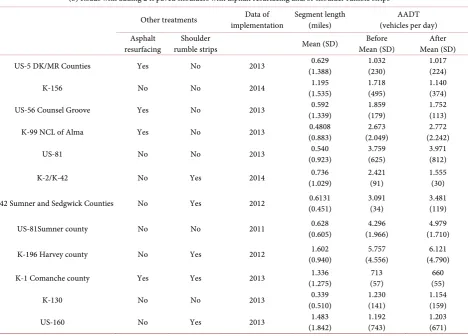
In order to understand the main characteristics of the selected road segments, descriptive statistics of road segments were calculated and shown in Table 1. It is seen that the roads which had safety edge treatments with lane widening are low volume roads. The roads which had 2 ft paved shoulders with asphalt resur-facing and/or shoulder rumble strips have high traffic volumes than the roads with safety edge treatments. Segment length distribution has a wide range of the roads which had 2 ft paved shoulders with asphalt resurfacing and/or shoulder rumble strips than in the roads with safety edge treatments.
4.1. Regression Method to Estimate Individual CMFS
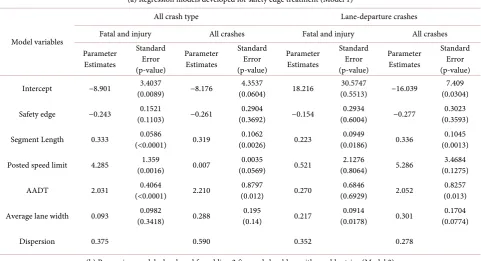
Separate models were developed using SAS 9.4 for each combined treatment as mentioned in the methodology [28]. Results of the two models are shown in Ta-ble 2 with their standard errors and p-values.
When developing models, the variance inflation factor (VIF) was checked in both models, and it was seen that the selected variables into the models have VIF less than 5. Therefore, it was concluded that there aren’t any multicollinearity effects between explanatory variables.
Based on the results presented in Table 2, it can be seen that the dispersion parameters of the Model 1 are less than 1 and in Model 2, they are greater than 1. Literature shows that the obtained values are reasonable for such models [25]
[29]. However, all crashes and all lane-departure crashes may overestimate the
safety effectiveness of the treatments. Also, the results showed that the p-values of the variables of interests in Model 1 are larger than in the Model 2. The reason of having larger p-values in Model 1 has a relatively smaller sample size than the Model 2. Even in the same model, it was seen that the p-values are larger in the models which were developed using fatal and injury crashes than the models developed using all crashes. Also, the results showed higher p-values for segment length variable and AADT variable which indicated that the variation of that va-riables in the considered time period cannot explain having variation in crash frequencies since most noticeable change on the road segments for the variation of crash frequency is due to having treatments on the respective road segments.
For an example, consider Figure 1(b). However, it was seen that if the sample
size is large the models give smaller p-values for both all crashes and fatal and injury crash models as in Model 2.
DOI: 10.4236/jtts.2018.84015 283 Journal of Transportation Technologies
Table 1. Descriptive statistics of before and after characteristics of the road segments with treatments.
(a) Roads with safety edge treatments with lane widening
Road Name Other treatments implementation Data of
Segment length
(miles) (vehicles per day) AADT Lane widening
12 ft to 13 ft Lane widening 12 ft to 14 ft Mean (SD) Before Mean (SD) After Mean (SD) K-23 from Lane County No Yes 2010 (1.745) 1.02 (501) 826 (253) 884
K-23 to US 83/K 383 junction No Yes 2012 (2.32) 1.58 (253) 640 (281) 633
K 25 from Russell Spring Yes No 2012 (3.19) 1.67 (18) 200 (15) 234
(b) Roads with adding 2 ft paved shoulders with asphalt resurfacing and/or shoulder rumble strips
Other treatments implementation Data of Segment length (miles) (vehicles per day) AADT Asphalt
resurfacing rumble strips Shoulder Mean (SD) Mean (SD) Before Mean (SD) After US-5 DK/MR Counties Yes No 2013 (1.388) 0.629 1.032 (230) 1.017 (224)
K-156 No No 2014 (1.535) 1.195 1.718 (495) 1.140 (374)
US-56 Counsel Groove Yes No 2013 (1.339) 0.592 1.859 (179) 1.752 (113)
K-99 NCL of Alma Yes No 2013 (0.883) 0.4808 (2.049) 2.673 (2.242) 2.772
US-81 No No 2013 (0.923) 0.540 3.759 (625) 3.971 (812)
K-2/K-42 No Yes 2014 (1.029) 0.736 2.421 (91) 1.555 (30)
K-42 Sumner and Sedgwick Counties No Yes 2012 (0.451) 0.6131 3.091 (34) 3.481 (119)
US-81Sumner county No No 2011 (0.605) 0.628 (1.966) 4.296 (1.710) 4.979
K-196 Harvey county No Yes 2012 (0.940) 1.602 (4.556) 5.757 (4.790) 6.121
K-1 Comanche county Yes Yes 2013 (1.275) 1.336 (57) 713 (55) 660
K-130 No No 2013 (0.510) 0.339 1.230 (141) 1.154 (159)
US-160 No Yes 2013 (1.842) 1.483 1.192 (743) 1.203 (671)
Note: SD-Standard deviation.
individual CMFs [30] [31] [32] [33] [34]. Table 3 shows the estimated CMFs due to safety edge treatment with 1 ft lane widening and 2 ft lane widening. Also,
Table 3 shows the CMFs due to asphalt resurfacing, adding 2 ft paved shoulders and 2 ft paved shoulders with rumble strips.
4.2. CMFs Estimated Using Before-and-After EB Method
[image:11.595.68.537.228.564.2]DOI: 10.4236/jtts.2018.84015 284 Journal of Transportation Technologies
Table 2. Developed regression models to identify the crash reduction effect of individual treatments.
(a) Regression models developed for safety edge treatment (Model 1)
Model variables
All crash type Lane-departure crashes Fatal and injury All crashes Fatal and injury All crashes
Parameter Estimates
Standard Error (p-value)
Parameter Estimates
Standard Error (p-value)
Parameter Estimates
Standard Error (p-value)
Parameter Estimates
Standard Error (p-value) Intercept −8.901 (0.0089) 3.4037 −8.176 (0.0604) 4.3537 18.216 (0.5513) 30.5747 −16.039 (0.0304) 7.409
Safety edge −0.243 (0.1103) 0.1521 −0.261 (0.3692) 0.2904 −0.154 (0.6004) 0.2934 −0.277 (0.3593) 0.3023
Segment Length 0.333 (<0.0001) 0.0586 0.319 (0.0026) 0.1062 0.223 (0.0186) 0.0949 0.336 (0.0013) 0.1045
Posted speed limit 4.285 (0.0016) 1.359 0.007 (0.0569) 0.0035 0.521 (0.8064) 2.1276 5.286 (0.1275) 3.4684
AADT 2.031 (<0.0001) 0.4064 2.210 (0.012) 0.8797 0.270 (0.6929) 0.6846 2.052 (0.013) 0.8257
Average lane width 0.093 (0.3418) 0.0982 0.288 (0.14) 0.195 0.217 (0.0178) 0.0914 0.301 (0.0774) 0.1704
Dispersion 0.375 0.590 0.352 0.278
(b) Regression models developed for adding 2 ft paved shoulders with rumble strips (Model 2) All crash type Lane-departure crashes All crashes Fatal and injury All crashes
Parameter Parameter Estimates Standard Error (p-value)
Parameter Estimates
Standard Error (p-value)
Parameter Estimates
Standard Error (p-value)
Parameter Estimates
Standard Error (p-value) Intercept 0.251 (0.4240) 0.3134 −0.196 (0.6232) 0.3980 0.238 (0.4573) 0.3207 -3.337 (0.1362) 2.2393
Segment length 0.667 (<0.0001) 0.0712 0.529 (<0.0001) 0.0742 −0.002 (0.3412) 0.0018 0.008 (0.3017) 0.0074
AADT 0.158 (0.0003) 0.0441 0.183 (0.0002) 0.0492 −0.073 (0.1399) 0.0497 0.071 (0.3011) 0.0682
Asphalt Resurfacing −0.920 (<0.0001) 0.1661 −0.947 (<0.0001) 0.2356 0.237 (0.1209) 0.1526 0.308 (0.1334) 0.2049
Only 2 ft shoulders 0.256 (0.0326) 0.1199 0.102 (0.4709) 0.1413 −0.320 (0.0214) 0.1388 −0.313 (0.0922) 0.186
2 ft shoulders with
rumble strips −0.294 (0.0311) 0.1365 −0.661 (0.0007) 0.1951 −0.267 (0.0758) 0.1501 −0.623 (0.0105) 0.2435
Dispersion 2.347 2.087 2.336 1.921
Calibration factors were calculated using the reference sites. Calibration factors for before and after periods were found to be 1.37 and 1.29. Also, the proportion of lane-departure crashes to all crash types was 0.50 and the fatal and injury crash proportions in before and after time periods were 0.24 and 0.22. The
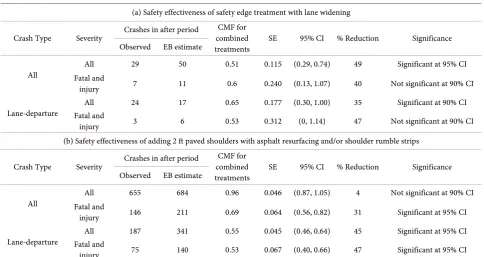
esti-mated CMFs for considered multiple treatments are shown in Table 4.
DOI: 10.4236/jtts.2018.84015 285 Journal of Transportation Technologies
Table 3. Estimated individual CMFs using regression parameters.
(a) Model 1
Treatments All crash type Lane-departure crashes All Fatal and injury All Fatal and injury
Safety edge 0.784 0.770 0.858 0.758
1 ft lane widening 1.098 1.333 1.242 1.351 2 ft lane widening 1.205 1.778 1.542 1.825
(b) Model 2
Treatments All crash type Lane-departure crashes All Fatal and Injury All Fatal and Injury Asphalt resurfacing 0.399 0.388 1.267 1.360 Adding 2 ft paved shoulders with shoulder
rumble strips 0.745 0.516 0.766 0.536 Adding 2 ft paved shoulders 1.292 1.107 0.727 0.731
Table 4. Estimated Safety effectiveness of multiple treatments using before-and-after EB method.
(a) Safety effectiveness of safety edge treatment with lane widening
Crash Type Severity Crashes in after period combined CMF for
treatments SE 95% CI % Reduction Significance Observed EB estimate
All Fatal and All 29 50 0.51 0.115 (0.29, 0.74) 49 Significant at 95% CI injury 7 11 0.6 0.240 (0.13, 1.07) 40 Not significant at 90% CI
Lane-departure Fatal and All 24 17 0.65 0.177 (0.30, 1.00) 35 Significant at 90% CI injury 3 6 0.53 0.312 (0, 1.14) 47 Not significant at 90% CI (b) Safety effectiveness of adding 2 ft paved shoulders with asphalt resurfacing and/or shoulder rumble strips
Crash Type Severity Crashes in after period combined CMF for
treatments SE 95% CI % Reduction Significance Observed EB estimate
All Fatal and All 655 684 0.96 0.046 (0.87, 1.05) 4 Not significant at 90% CI injury 146 211 0.69 0.064 (0.56, 0.82) 31 Significant at 95% CI
Lane-departure Fatal and All 187 341 0.55 0.045 (0.46, 0.64) 45 Significant at 95% CI injury 75 140 0.53 0.067 (0.40, 0.66) 47 Significant at 95% CI
However, the estimated CMFs for adding 2 ft paved shoulders with asphalt re-surfacing and/or shoulder rumble strips are significant at 95% confidence inter-val except for all crashes. Since Table 4 shows the estimated CMFs for the com-bined treatments. Finally, the individual CMFs were calculated using Equation (7), (8), and (9).
4.3. Estimated Individual CMFs
[image:13.595.56.541.331.588.2]treat-DOI: 10.4236/jtts.2018.84015 286 Journal of Transportation Technologies
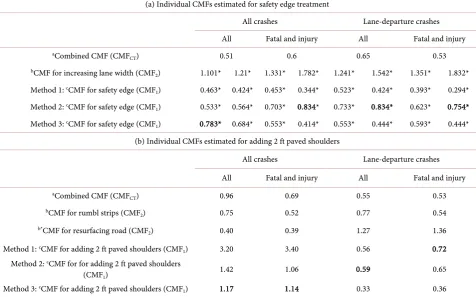
ment and adding 2 ft paved shoulders, individual CMFs were calculated for those two treatments. However, the CMFs for lane widening and asphalt resur-facing on two-lane undivided road segments were not available for Kansas. Therefore, it was decided to use CMFs estimated from regression method for considered road segments. Even though the CMFs for shoulder rumble strips on rural two-lane road segments are available for Kansas those provide an average crash reduction due to shoulder rumble strips on similar road segments. The safety effectiveness of the shoulder rumble strips on considered road segments can be within the 95% confidence interval of the respective CMF. Therefore, it was decided to use the estimated CMFs developed using regression parameters which are presented in Table 3. Table 5 shows the calculated individual CMFs
for safety edge treatment and adding 2ft paved shoulders on considered road
segments.
It is seen that the individual CMFs estimated for all crashes from regression method shown in Table 3(a) is similar to CMFs estimated for safety edge treat-ments on the road segtreat-ments with 1 ft lane widening using method 3 shown in
Table 5(a). For the fatal and injury all crash types and lane-departure crashes, CMFs estimated from regression method in Table 3(a) is similar to the
individ-ual CMFs calculated using method 2 shown in Table 5(a) for the safety edge
treatments on the road segments with 2ft lane widening.
Considering the result in Table 5(b), it can be seen that the method 3 gave
similar results for the CMFs calculated for all crashes and injury using regression
method in Table 3(a). Method 2 and 3 gave the similar results for the CMF
es-timated for all lane-departure crashes and fatal and injury all crash types. How-ever, it should be noted that this research was done to estimate CMFs due to in-dividual treatment, not to find the relationship between inin-dividual treatments to the combined treatments. Therefore, having similar but not the exact CMFs are understandable since the emphasis was not given to identify the exact relation-ship of individual CMFs to the combined CMFs.
Furthermore, the results showed that adding only the 2 ft shoulders have sig-nificantly increased all crashes and fatal and injury crashes throughout these years. However, the results showed that adding 2 ft paved shoulders reduces lane-departure crashes on particular road segments. Furthermore, results showed that asphalt resurfacing reduce all crashes but increase lane-departure crashes. Finally, it is seen that adding 2ft paved shoulders with rumble strips have a significant safety effectiveness than adding 2ft paved shoulders without rumble strips.
5. Conclusions
DOI: 10.4236/jtts.2018.84015 287 Journal of Transportation Technologies
Table 5. Estimated CMFs for individual treatments.
(a) Individual CMFs estimated for safety edge treatment
All crashes Lane-departure crashes All Fatal and injury All Fatal and injury
aCombined CMF (CMF
CT) 0.51 0.6 0.65 0.53
bCMF for increasing lane width (CMF
2) 1.101* 1.21* 1.331* 1.782* 1.241* 1.542* 1.351* 1.832*
Method 1: cCMF for safety edge (CMF
1) 0.463* 0.424* 0.453* 0.344* 0.523* 0.424* 0.393* 0.294*
Method 2: cCMF for safety edge (CMF
1) 0.533* 0.564* 0.703* 0.834* 0.733* 0.834* 0.623* 0.754*
Method 3: cCMF for safety edge (CMF
1) 0.783* 0.684* 0.553* 0.414* 0.553* 0.444* 0.593* 0.444*
(b) Individual CMFs estimated for adding 2 ft paved shoulders
All crashes Lane-departure crashes All Fatal and injury All Fatal and injury
aCombined CMF (CMF
CT) 0.96 0.69 0.55 0.53
bCMF for rumbl strips (CMF
2) 0.75 0.52 0.77 0.54
b*CMF for resurfacing road (CMF
2) 0.40 0.39 1.27 1.36
Method 1: cCMF for adding 2 ft paved shoulders (CMF
1) 3.20 3.40 0.56 0.72
Method 2: cCMF for for adding 2 ft paved shoulders
(CMF1) 1.42 1.06 0.59 0.65
Method 3: cCMF for adding 2 ft paved shoulders (CMF
1) 1.17 1.14 0.33 0.36
Note: aCMFs were estimated using before-and-after EB method. bCMFs were estimated using regression parameters for increasing lane width in Table 2. cCMFs were estimated using the methods shown in Equation (7), (8) and (9). 1*CMFs for 1ft lane widening, 2*CMFs for 2ft lane widening. 3*CMFs for
safety edge treatment on the road segments which had 1ft lane widening. 4*CMFs for safety edge treatment on the road segments which had 2 ft lane
wi-dening.
some of the widely used methods are provided in Equation (7), (8) and (9). It is unclear which method is to be used for given geographic region. Therefore, this study employed an alternative method based on regression models to estimate individual CMFs where multiple treatments have been implemented at the same time. This method has many advantages and some limitations which should be addressed in the future research.
DOI: 10.4236/jtts.2018.84015 288 Journal of Transportation Technologies
will estimate the safety effectiveness of other treatments specific to the consi-dered road segments. Since many explanatory variables are consiconsi-dered when developing the regression models, they will also act as the SPFs in EB method and will provide accurate crash predictions. Since the models are developed us-ing same road segments by assignus-ing before and after characteristics, the effect of the confounding variables which are not included into crash frequency mod-els such as drivers’ culture, demographic distribution of the drivers and land use pattern, can be minimized.
Even though there are many advantages of using this regression approach to estimate individual CMFs, there are some limitations which needed to be ad-dressed in future research. Since this approach requires regression modeling, it is necessary to have enough sample size. If the sample size is small, the developed regression model will have larger p-values for the important explanatory va-riables such as the treatment as in the Model 1. If the sample size is relatively large, p-values will be smaller; hence the important variables become significant at higher confidence intervals as in the Model 2. Furthermore, if the considered road segments have crash distribution with a narrow range, the developed mod-els using such samples tend to give larger p-values as in the fatal and injury crash models. However, in both Model 1 and 2, the standard error of the treatment which is the CMF is larger than in the respective EB method. Therefore, it is ne-cessary to find out the optimum sample size for such models which give signifi-cant p-values with lower standard errors. Finally, this method is not useful if the treatments were not implemented at the same time.
Acknowledgements
The authors would like to thank Mr. Steven Buckley and Ms. Elsit Mandal from KDOT for providing information on the countermeasures and the traffic and geometric data of Kansas roadways. Furthermore, thanks go to Mr.Greg Schie-ber, Mr.Troy Howard, Mr. Wayne Gudmonson, Ms. Donna Schmit, Mr. Hugh Bogle and Mr. Jeff Stewart, area engineers from KDOT for providing the infor-mation on safety edge treatments and adding 2 ft paved shoulders.
Conflicts of Interest
The authors declare no conflicts of interest regarding the publication of this pa-per.
References
[1] World Health Organization (2013) Violence, Injury Prevention, and World Health Organization. Global Status Report on Road Safety 2013: Supporting a Decade of Action.
[2] Insurance Institute for Highway Safety Highway Loss Data Institute (2016) Fatality Facts.
DOI: 10.4236/jtts.2018.84015 289 Journal of Transportation Technologies [3] NHTSA (2016) Fatality Analysis Reporting System.
http://www-fars.nhtsa.dot.gov/Main/index.aspx
[4] Kansas Department of Transportation (2015) Kansas Strategic Highway Safety Plan. http://www.ksdot.org/Assets/wwwksdotorg/bureaus/burTrafficSaf/reports/reportsp df/SHSP2015.pdf
[5] Highway Safety Manual (2010)American Association of State Highway and Trans-portation Officials (AASHTO), Washington DC.
[6] Zeng, H., Schrock, S.D. and Mulinazzi, T. (2013) Evaluation of Safety Effectiveness of Composite Shoulders, Wide Unpaved Shoulders, and Wide Paved Shoulders in Kansas. K-TRAN: KU-11-1, Kansas Department of Transportation.
[7] Lan, B., Persaud, B., Lyon, C. and Bhim, R. (2009) Validation of a Full Bayes Me-thodology for Observational Before-after Road Safety Studies and Application to Evaluation of Rural Signal Conversions. Accident Analysis & Prevention, 41, 574-580.https://doi.org/10.1016/j.aap.2009.02.010
[8] Hauer, E. (1997) Observational Before-After Studies in Road Safety—Estimating the Effect of Highway and Traffic Engineering Measures on Road Safety. Elsevier Science Incorporated, Tarrytown, NY.
[9] Persaud, B. and Lyon, C. (2007) Empirical Bayes Before-After Safety Studies: Les-sons Learned from Two Decades of Experience and Future Directions. Accident Analysis & Prevention, 39, 546-555.https://doi.org/10.1016/j.aap.2006.09.009 [10] Gross, F. and Hamidi, A. (2011) Investigation of Existing and Alternative Methods
for Combining Multiple CMFs, Highway Safety Improvement Program Technical Support. T-06-013, 1-45.
[11] Park, J., Abdel-Aty, M. and Lee, C. (2014) Exploration and Comparison of Crash Modification Factors for Multiple Treatments on Rural Multilane Roadways. Acci-dent Analysis & Prevention, 70, 167-177.https://doi.org/10.1016/j.aap.2014.03.016 [12] Turner, B. (2011) Estimating the Safety Benefits When Using Multiple Road
Engi-neering Treatments. Road Safety Risk Reporter, 11.
[13] Hallmark, S.L., Veneziano. D., McDonald, T., Graham, J., Bauer, K.M., Patel, R. and Council, F.M. (2006) Safety Impacts of Pavement Edge Drop-Offs. Center for Transportation Research and Education, Iowa State University,Ames.
[14] Hallmark, S., McDonald, T., Sperry, B. and Vencil, E. (2011) Evaluation of Safety Edge Benefits in Iowa. Trans Project 09-358, Center for Transportation Research and Education, Iowa State University, Ames.
[15] Hallmark, S.L., Goswamy, A. and Pawlovich, M.D. (2016) Safety Edge Crash Mod-ification Factors. Institute for Transportation, Iowa State University, Ames. [16] Graham, J., Richard, K., O’Laughlin, M. and Harwood, D. (2011) Safety Evaluation
of the Safety Edge Treatment. FHWA-HRT-11-024, Federal Highway Administra-tion, McLean.
[17] Labi, S. (2011) Efficacies of Roadway Safety Improvements across Functional Sub-classes of Rural Two-Lane Highways. Journal of Safety Research, 42, 231-239.
https://doi.org/10.1016/j.jsr.2011.01.008
[18] Abdel-Aty, M., Lee, C., Park, J., Wang, J., Abuzwidah, M. and Al-Arifi, S. (2014) Validation and Application of Highway Safety Manual (Part D) in Florida. BDK78-977-14, Florida Department of Transportation, Tallahassee.
DOI: 10.4236/jtts.2018.84015 290 Journal of Transportation Technologies [20] Bamzai, R., Lee, Y. and Li, Z. (2011) Safety Impacts of Highway Shoulder Attributes
in Illinois. FHWA-ICT-11-078, Illinois Department of Transportation, Urbana. [21] Abdel-Aty, M., Devarasetty, P.C. and Pande, A. (2009) Safety Evaluation of
Multi-lane Arterials in Florida. Accident Analysis & Prevention, 41, 777-788.
https://doi.org/10.1016/j.aap.2009.03.015
[22] Erwin, T.C. (2007) Safety Effects of Preventative Maintenance: Microsurfacing—A Case Study.
[23] Russell, E.R., Rys, M.J. and Brin, T.S. (2003) US Experience with Centerline Rumble Strips on Two-Lane Roads: Pattern Research and North American Usage. ARRB Transport Research.
[24] Poch, M. and Mannering, F. (1996) Negative Binomial Analysis of Intersec-tion-Accident Frequencies. Journal of Transportation Engineering, 122, 105-113.
https://doi.org/10.1061/(ASCE)0733-947X(1996)122:2(105)
[25] Gross, F. and Donnell, E.T. (2011) Case-Control and Cross-Sectional Methods for Estimating Crash Modification Factors: Comparisons from Roadway Lighting and Lane and Shoulder Width Safety Effect Studies. Journal of Safety Research, 42, 117-129.https://doi.org/10.1016/j.jsr.2011.03.003
[26] Montgomery, D.C., Peck, E.A. and Vining, G.G. (2015) Introduction to Linear Re-gression Analysis. John Wiley & Sons, Hoboken.
[27] Belsley, D.A., Kuh, E. and Welsch, R.E. (2005) Regression Diagnostics: Identifying Influential Data and Sources of Collinearity. John Wiley & Sons, Hoboken.
[28] SAS Institute (2015) Base SAS 9.4 Procedures Guide. SAS Institute, Cary.
[29] Chen, Y. and Persaud, B. (2014) Methodology to Develop Crash Modification Functions for Road Safety Treatments with Fully Specified and Hierarchical Models.
Accident Analysis & Prevention, 70, 131-139.
https://doi.org/10.1016/j.aap.2014.03.012
[30] Galgamuwa, U. and Dissanayake, S. (2018) Safety Effectiveness of Chevrons and Post-Mounted Delineators in Reducing Lane-Departure Crashes. International Conference on Transportation and Development, Pittsburgh, 15-18 July 2018. [31] Gross, F., Persaud, B. and Lyon, C. (2010) A Guide to Developing Quality Crash
Modification Factors. FHWA-SA-10-032, Federal Highway Administration. [32] Galgamuwa, U. (2018) Estimating Crash Modification Factors for Lane-Departure
Countermeasures in Kansas. Ph.D., Kansas State University, Manhattan.
[33] Devasurendra, K., Perera, L. and Bandara, S. (2017) An Insight to Motorized Two and Three Wheel Crashes in Developing Countries: A Case Study in Sri Lanka.
Journal of Transportation Safety & Security, 2017, 204-215.
https://doi.org/10.1080/19439962.2016.1236052
[34] Dissanayake, S. and Perera, L. (2011) A Survey Based Study of Factors Related to Older Driver Highway Safety. Journal of Transportation Safety & Security, 3, 77-94.