ISSN Online: 2156-8367 ISSN Print: 2156-8359
DOI: 10.4236/ijg.2019.101002 Jan. 24, 2019 12 International Journal of Geosciences
Comparing Eight Computing Algorithms and
Four Consensus Methods to Analyze
Relationship between Land Use Pattern and
Driving Forces
Xinliang Liu
1, Yi Wang
1*, Yong Li
1*, Feng Liu
1, Jianlin Shen
1,
Liang Ou
2, Juan Wang
1, Runlin Xiao
1, Jinshui Wu
11Key Laboratory of Agro-Ecological Processes in Subtropical Region and Changsha Research Station for Agricultural &
Environmental Monitoring, Institute of Subtropical Agriculture, Chinese Academy of Sciences, Changsha, China
2Zhangjiajie City Environmental Monitoring Center Station, Zhangjiajie, China
Abstract
Although many computing algorithms have been developed to analyze the relationship between land use pattern and driving forces (RLPDF), little has been done to assess and reduce the uncertainty of predictions. In this study, we investigated RLPDF based on 1990, 2005 and 2012 datasets at two spatial scales using eight state-of-the-art single computing algorithms and four con-sensus methods in Jinjing rive catchment in Hunan Province, China. At the entire catchment scale, the mean AUC values were between 0.715 (ANN) and 0.948 (RF) for the single-algorithms, and from 0.764 to 0.962 for the consen-sus methods. At the subcatchment scale, the mean AUC values between 0.624 (CTA) and 0.972 (RF) for the single-algorithms, and from 0.758 to 0.979 for the consensus methods. At the subcatchment scale, the mean AUC values were between 0.624 (CTA) and 0.972 (RF) for the single-algorithms, and from 0.758 to 0.979 for the consensus methods. The result suggested that among the eight single computing algorithms, RF performed the best overall for woodland and paddy field; consensus method showed higher predictive performance for woodland and paddy field models than the single computing algorithms. We compared the simulation results of the best- and worst-performing algorithms for the entire catchment in 2012, and found that approximately 72.5% of woodland and 72.4% of paddy field had proba-bilities of occurrence of less than 0.1, and 3.6% of woodland and 14.5% of paddy field had probabilities of occurrence of more than 0.5. In other words, the simulation errors associated with using different computing algorithms can be up to 14.5% if a probability level of 0.5 is set as the threshold. The re-How to cite this paper: Liu, X.L., Wang,
Y., Li, Y., Liu, F., Shen, J.L., Ou, L., Wang, J., Xiao, R.L. and Wu, J.S. (2019) Compar-ing Eight ComputCompar-ing Algorithms and Four Consensus Methods to Analyze Relation-ship between Land Use Pattern and Driving Forces. International Journal of Geos-ciences, 10, 12-28.
https://doi.org/10.4236/ijg.2019.101002
Received: December 22, 2018 Accepted: January 21, 2019 Published: January 24, 2019
Copyright © 2019 by author(s) and Scientific Research Publishing Inc. This work is licensed under the Creative Commons Attribution International License (CC BY 4.0).
DOI: 10.4236/ijg.2019.101002 13 International Journal of Geosciences sults of this study showed that the choice of modeling approaches can greatly affect the accuracy of RLPDF prediction. The computing algorithms for spe-cific RLPDF tasks in spespe-cific regions have to be localized and optimized.
Keywords
Land Use Pattern, Spatial Scales, Consensus Methods, Computing Algorithms
1. Introduction
Land use change is a complex process. The use of land use change models to analyze the causes and consequences of land use dynamics has been a popular topic in recent years [1] [2]. However, quantifying the relationship between land use pattern and driving forces (RLPDF) is difficult when land use change models are applied [3] [4]. RLPDF in some land use change models, e.g., Dyna_CLUE, is used to calculate the probability of land use suitability between 0 and 1. The cal-culation accuracy of the probability of land use suitability directly affects the predicting accuracy of land use change models [1]. Therefore, the robust and accurate quantification of RLPDF has been a hot subject for numerous investiga-tions of land use change modeling. Spatial modeling techniques are increasingly used in land use change modeling. However, the implemented techniques differ in their modeling preference, and some consensus methods are needed to reduce the uncertainty of predictions. In this study, apart from accessing the perfor-mances of eight state-of-the-art single computing algorithms, we tested the pre-dictive accuracies of four consensus methods.
DOI: 10.4236/ijg.2019.101002 14 International Journal of Geosciences are limited due to an assumption of a linear response to environmental predic-tors. Artificial neural networks (ANN) provide an increasingly advocated alter-native because they accommodate consideration of nonlinear influences on land use distribution. However, it is difficult to comprehend the meanings of the pa-rameters used in ANN because of the black-box nature of neural networks [4]. These results provide an interesting but still limited exploration of which me-thod performs best for each of several different goals or study areas. One of the problems with these analyses is that the results are dependent on the multiva-riate analysis computing algorithms used. One difficulty with the use of the computing algorithms is that the number of techniques available is large and is increasing steadily, making it difficult for novices to select appropriate compu-ting algorithms for their needs [11] [12]. Recent analyses have also demonstrated that the discrepancies that arise from using different techniques can be huge, which makes the choice of an appropriate computing algorithm more difficult [7].
The various modeling techniques available utilize a variety of algorithms to calculate the probability that a land use type can occur in a given area. The vast and growing literature on distribution modeling suggests that some techniques are typically more effective than others, but there is no one superior algorithm that performs best for all land use types, all data sets, or all research objectives [13]. A number studies have addressed the errors and uncertainties embedded in the above models [14]. The sources of uncertainties are diverse from small sam-ple size, missing determinates, the nonlinear relationships to uncertainties in model building procedures. There are two main approaches to reduce the mod-el-based uncertainty in land use pattern distribution simulations: 1) comparing extensive models, and concerning which of the models will generally provide the best predictive performance; 2) using consensus methods, which based on com-binative algorithms of the predictions provided by different single computing algorithms [15]. The consensus approach is based on the idea that different pre-dictions are copies of possible states of the real distributions, and they form an ensemble, which combines several unbiased model results (probabilities) will result in a more accurate prediction [16]. There are different ways to build con-sensus prediction, and it has rarely if ever been tested which of the concon-sensus methods are able to consistently generate more accurate land use pattern distri-butions than some novel single-model methods available for land use modeling.
DOI: 10.4236/ijg.2019.101002 15 International Journal of Geosciences of selecting a model that performs well. The relative importance of driving forces in determining land use type distributions also varies with the spatial scale [2].
For the above reasons, we chose a small hilly catchment (the Jinjing river cat-chment) and applied eight computing algorithms [i.e., GLM, GAM, CTA, ANN, flexible discriminant analysis (FDA), multivariate adaptive regression splines (MARS), generalized boosting models (GBM), and RF] and four consensus me-thods [two meme-thods (Median and Mean) are based on output of all eight sin-gle-models, whereas Weighted Average (WA) chose four single-models with higher AUC values and PCA (median) methods is based on the median of half of the single-model chosen by a principle component analysis] to investigate the relationship between land use pattern and driving forces (e.g., elevation, slope, aspect, distance to residential areas, distance to roads, distance to rivers, and distance to lakes or ponds) at two spatial scales: the entire catchment and sub-catchment. The main objectives of this study were: (i) to analyze the statistical differences in predictive ability of the eight single computing algorithms and identify the best-performed computing algorithms for the RLPDF study, and (ii) investigate which of the consensus methods could improve the accuracy of pre-dictions from single computing algorithms.
2. Materials and Methods
2.1. Study Area
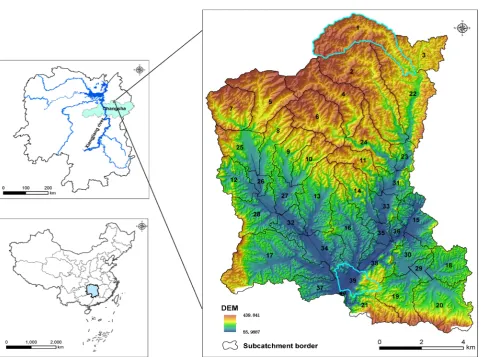
The Jinjing river catchment, located in the town of Jinjing, near Changsha in Hunan Province, China (Figure 1), has a population of 41,618 people and an area of 135 km2. It is one of the headwater catchments of the Jinjing river catch-ment system, which is one of the major tributaries of the Xiangjiang river wa-tershed system.
The region has a subtropical monsoon climate with a mean annual air tem-perature of 17.5˚C and a mean annual precipitation of 1330 mm (1968-2015). On average, 70% of the annual precipitation falls during the warm season in April, May, and June. The elevation is between 56 and 440 m above sea level. The main soil types in the study area are red soil, purplish soil, fluvo-aquic soil and paddy soil; and the dominant soils are red soil (Ferrosols, Chinese Soil Tax-onomy) and paddy soil (Anthrosols, Chinese Soil TaxTax-onomy). The natural vege-tation includes Masson pine, Chinese fir, oil-tea camellia and other evergreen trees and shrubs.
2.2. Data Preparation
DOI: 10.4236/ijg.2019.101002 16 International Journal of Geosciences
Figure 1. Geographical location of the Jinjing river catchment, 50 km north of Changsha (the capital city of Hunan province), China. Subcatchments 1 and 39 are highlighted.
Figure 2. Land use data for 1990, 2005 and 2012.
[image:5.595.59.541.459.622.2]DOI: 10.4236/ijg.2019.101002 17 International Journal of Geosciences land use type map was converted to a grid format from the available vector map at a spatial resolution of 50 m, i.e., the same as the resolution of the DEM data.
To analyze the RLPDF at the subcatchment scale, two subcatchments were chosen from among 40 subcatchments for their specific distributions of wood-land and paddy fields. Subcatchment 1 is dominated by woodwood-land (87.41%) and thus has an undulating terrain. Subcatchment 39 has a gentle undulating terrain and is dominated by paddy field (43.23%).
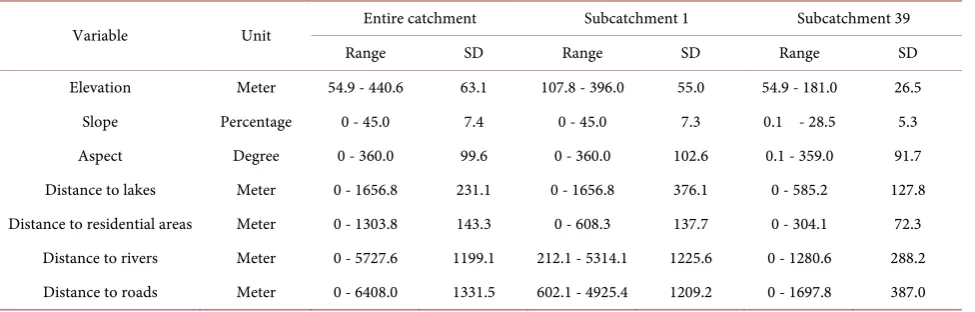
[image:6.595.208.540.432.534.2]Generally, land use changes driving forces can be grouped into two categories [20]: biophysical factors, socio-economic drivers. Although biophysical factors, such as elevation and slope, mostly do not directly drive land use change, they can influence land use allocation decisions to lead to the land use changes [2]. Some socio-economic drivers, e.g., GDP and population, are hard to present spatial variability in a catchment, such as the Jinjing river catchment in which the lowest level of governmental administrations (or township) for national sta-tistical purposes is located. In view of above reasons, seven representative driv-ing forces (elevation, slope, aspect, distance to residential areas, distance to lakes or ponds, distance to rivers, and distance to roads) were chosen in this study to explore the relationship between land use pattern and driving forces. Table 2 summarizes the seven driving forces. We calculated the importance of the driv-ing forces usdriv-ing the best-performdriv-ing algorithms selected from above mentioned eight computing algorithms for woodland and paddy field for the two spatial scales.
Table 1. Land use types area temporal change (km2).
Land use types 1990 2005 2012
Tea fields 4.08 3.28 4.57
Residential area 2.75 3.11 3.26
Paddy fields 36.48 35.82 33.61
Woodland 85.18 87.98 88.59
Lakes 4.74 3.17 3.32
Table 2. Descriptive statistics of driving forces in the RLPDF analysis.
Variable Unit Entire catchment Subcatchment 1 Subcatchment 39
Range SD Range SD Range SD
Elevation Meter 54.9 - 440.6 63.1 107.8 - 396.0 55.0 54.9 - 181.0 26.5
Slope Percentage 0 - 45.0 7.4 0 - 45.0 7.3 0.1 - 28.5 5.3
Aspect Degree 0 - 360.0 99.6 0 - 360.0 102.6 0.1 - 359.0 91.7
Distance to lakes Meter 0 - 1656.8 231.1 0 - 1656.8 376.1 0 - 585.2 127.8 Distance to residential areas Meter 0 - 1303.8 143.3 0 - 608.3 137.7 0 - 304.1 72.3
[image:6.595.57.545.564.720.2]DOI: 10.4236/ijg.2019.101002 18 International Journal of Geosciences
2.3. Single Computing Algorithms and Consensus Methods for the
RLPDF Analysis
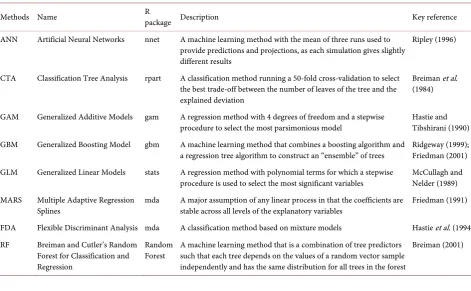
In this study, to take the variation in algorithm performance into account, a multi-model approach was taken, using the BIOMOD package implemented in R software [7]. The eight computing algorithms considered: GLM, GAM, CTA, ANN, FDA, MARS, GBM and RF are listed in Table 3. Each of the eight compu-ting algorithms was run independently. We used a dummy variable (a binary va-riable) that takes a value of 0 or 1 to indicate the absence or presence of a land use type as the dependent variable, and took seven driving forces as the inde-pendent variables for each computing algorithms.
Eight single computing algorithms were first built separately for each of land use type. The combing of the outputs of the single computing algorithms then provided the ensemble of predictions, which contains eight forecasted probabil-ity values distributions for land use pattern. Median consensus method is the median value of the outputs of all the eight single-models. The WA consensus method ranks the single computing algorithms according to their predictive performance, and assign a weighted value (0 ~ 1) to the probability values. The PCA (median) method calculates the median value of part single computing al-gorithms selected by a PCA from all models for each land use type. The PCA is run with projected probabilities of all single computing algorithms and provides a rate for each single computing algorithm to reflect its ability to explain the va-riance of the general trend of the eight single computing algorithms [15].
[image:7.595.58.530.445.736.2]We implemented a cross-validation procedure to evaluate the computing
Table 3. Description of eight algorithms for researching RLPDF.
Methods Name R package Description Key reference
ANN Artificial Neural Networks nnet A machine learning method with the mean of three runs used to provide predictions and projections, as each simulation gives slightly different results
Ripley (1996)
CTA Classification Tree Analysis rpart A classification method running a 50-fold cross-validation to select the best trade-off between the number of leaves of the tree and the explained deviation
Breiman et al. (1984)
GAM Generalized Additive Models gam A regression method with 4 degrees of freedom and a stepwise
procedure to select the most parsimonious model Hastie and Tibshirani (1990) GBM Generalized Boosting Model gbm A machine learning method that combines a boosting algorithm and
a regression tree algorithm to construct an “ensemble” of trees Ridgeway (1999); Friedman (2001) GLM Generalized Linear Models stats A regression method with polynomial terms for which a stepwise
procedure is used to select the most significant variables McCullagh and Nelder (1989) MARS Multiple Adaptive Regression
Splines mda A major assumption of any linear process in that the coefficients are stable across all levels of the explanatory variables Friedman (1991) FDA Flexible Discriminant Analysis mda A classification method based on mixture models Hastie et al. (1994) RF Breiman and Cutler’s Random
Forest for Classification and Regression
Random
Forest A machine learning method that is a combination of tree predictors such that each tree depends on the values of a random vector sample independently and has the same distribution for all trees in the forest
DOI: 10.4236/ijg.2019.101002 19 International Journal of Geosciences algorithms. Because there was no independent data set containing the same type of data that could be used for evaluation purposes, the computing algorithms were calibrated using a random subset of 80% of the available data and evaluated using the remaining 20%. The area under the curve (AUC) of the receiver oper-ating characteristic (ROC) has been used to assess the predictive performance of the distribution models [21]. An evaluation system based on the calculated AUC values was developed: 0.5 - 0.7 = low accuracy, 0.7 - 0.9 = potentially useful, and >0.9 = high accuracy [22].
2.4. Predicting Results Analysis of Computing Algorithms for the
RLPDF Analysis
Probability thresholds for transforming the continuous computing algorithms results into binary values were set for each computing algorithms. We over-lapped the probability thresholds with the histogram of predicted probability values (HPPV) of land use pattern to illustrate the significant differences among the outcomes of the eight computing algorithms at the two different spatial scales considered.
To show the spatial contrast of the predicted probability (0 - 1) of the best- and the worst-performing algorithms, for the entire catchment, for example, we used the best spatial simulation value (0 - 1) estimated by the best-performing algorithm minus the worst spatial simulation value (0 - 1) estimated by the worst-performing algorithm to compute the spatial prediction differences. Con-sidering the repetition of such calculations for the three discrete years, we only chose the 2012 data to investigate the impact of different computing algorithms for the RLPDF analysis.
3. Results
3.1. Performance of Computing Algorithms
at Different Spatial Scales
DOI: 10.4236/ijg.2019.101002 20 International Journal of Geosciences
Figure 3. ROC index-based evaluation of simulation results by using eight algorithms and four consensus methods.
computing algorithms to analyze RLPDF.
3.2. Spatial Predicted Error Analysis
of Selecting Computing Algorithms
DOI: 10.4236/ijg.2019.101002 22 International Journal of Geosciences
Figure 5. Comparison of the predicted probability (0 - 1) of the best- and worst-performing algorithms for woodland and paddy field at the entire catchment scale for 2012. Woodland (WA): woodland simulation by Weighted average; Woodland (CTA): woodland simulation by classification tree analysis; Woodland (WA-CTA): Woodland (WA) minus Woodland (CTA); Paddy field (WA): Paddy field simulation by Weighted average; Paddy field (ANN): paddy field simulation by artificial neural networks; and Paddy field (WA-ANN): Paddy field (WA) minus Paddy field (ANN).
predicted probabilities (0-1) produced by the best- and worst-performing algo-rithms were similar to that in 2012.
DOI: 10.4236/ijg.2019.101002 23 International Journal of Geosciences
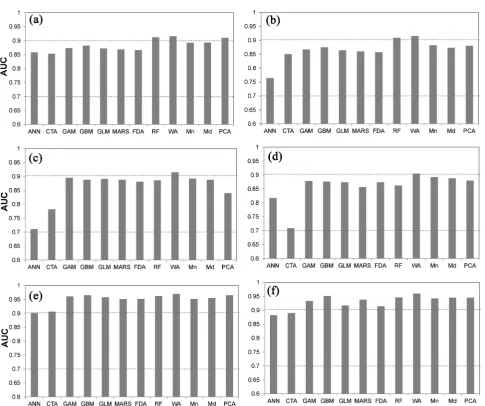
Figure 6. Importance values for seven driving forces (e.g., elevation, aspect, slope, distance to lakes, distance to residential areas, distance to rivers and distance to roads) in the RLPDF analysis. (a) woodland for the entire catchment; (b) paddy field for the en-tire catchment; (c) woodland for Subcatchment 1; (d) paddy field for Subcatchment 1; (e) woodland for Subcatchment 39; and (f) paddy field for Subcatchment 39.
river catchment possessing small plains mixed with hills.
4. Discussion
4.1. Effects of Computing Algorithm Selection for RLPDF
DOI: 10.4236/ijg.2019.101002 24 International Journal of Geosciences The ROC curve is a graphical method for representing the relationship be-tween the false positive fraction and the sensitivity for a range of thresholds [21]. Our results indicate that all of the eight models considered performed well at predicting land use distributions, with AUC values ranging from 0.654 to 0.963 at the two different spatial scales considered. Of the eight computing models considered, the non-parametric approaches (i.e., RF, GBM, MARS, CART, and ANN), and particularly RF and GBM, produced better results for very complex systems than parametric algorithms such as GLM [23]. Based on our observa-tions in this study, the performance of ANN was judged to be unreliable for full-scale data sets. One possible reason for the poor performance of ANN is that the spatial correlation between land use pattern and driving forces may be over-fitted [25]. Many researchers have proven that ANN is incapable of ana-lyzing RLPDF [9]. In this study, we did not doubt the predicting ability of ANN for the RLPDF analysis. However, comparing with RF and GBM and considering the complexity of parameter setting, ANN may be not suitable for the RLPDF analysis, especially for some places with high spatial heterogeneity. In our study, the most efficient consensus method was the WA consensus method, which sig-nificantly improved the predictive accuracy of these eight single computing al-gorithms. The good performance of WA consensus method was primarily due to the low-pass filtering ability of the average function. This result was similar to other researches referring to predictive species distribution modeling [7].
re-DOI: 10.4236/ijg.2019.101002 25 International Journal of Geosciences sulting from the choice of the computing algorithms embedded in these land use models and the uncertainty of the internal parameters of land use models. Si-mulation errors can be completely avoided by repeatedly and carefully choosing and optimizing algorithms before we use them to quantify the stability of land use spatial distributions. One may argue that the characteristics and limitations of algorithms may be the key reason for their poor or good performance. Most of those algorithms were not developed for land use assessment purposes, and they have rarely been used in the RLPDF analysis [2]. When they are used in the RLPDF analysis, some improvements need to be made to them [7].
4.2. Selection of Driving Forces with Spatial Scales
The driving forces’ importance analysis are important parts in studying RLPDF and using land use models, especially in some places with characteristics includ-ing intensity spatial heterogeneity, great spatial scale change sensitivity and complicated land use change process. The importance of driving forces varied with different land use types at multiple spatial scales in the Jinjing river catch-ment. However, the most important factor was DEM in the entire catchment and Subcatchments 1 & 39. This was mainly due to the characteristics of little plains interbedded with hilly in the Jinjing river catchment [29]. The less impor-tant factors were different for woodland and paddy field in Subcatchment 1. One possible reason for this difference concerned the natural environment: Subcat-chment 1 contained more than 70% of the total area as woodland and also had paddy field embedded in hills (Figure 1). This kind of distribution of embedded paddy field increased its resource dependence for water, and thus, Distance to lake was found the most important factor for paddy field in this subcatchment. In this study, we used the best performance algorithm to quantify importance of driving forces for land use change at the entire catchment and subcatchment. If we use other poor performance algorithms, the importance values of driving forces were obviously different in comparison with that quantified by the best performance algorithm (results not shown). This phenomenon also demonstrate the importance of selecting computing algorithms for analyzing RLPDF.
4.3. Other Algorithms for Future RLPDF Analysis
Our results indicate that different land use types require different computing al-gorithms, depending on the spatial scale. Such differences may be obstacles to the development of a single all-purpose land use model for land use planning. Thus, it is desirable that land use decision-making be based on a set of alterna-tive source maps and a set of predictions obtained using multiple models.
al-DOI: 10.4236/ijg.2019.101002 26 International Journal of Geosciences gorithms with the theories of cellular automata (CA) and multi-agents to build a land use structure optimization model at the catchment scale.
5. Conclusion
Eight computing algorithms and four consensus methods were used to investi-gate RLPDF at two spatial scales (e.g., an entire catchment and a subcatchment) in the town of Jinjing, northeast of Changsha in Hunan Province in China. WA consensus method performed the best overall for woodland and paddy field in the catchment. However, ANN performed inconsistent, especially for subcatch-ment 1 with high spatial heterogeneity. Taking 2012 data as example and com-paring with the predicted probability between best and worst performed compu-ting algorithms, approximately 72.5% of woodland and 72.4% of paddy field had probabilities of occurrence of less than 0.1, and 3.6% of woodland and 14.5% of paddy field had probabilities of occurrence of more than 0.5. The consensus methods based on average function algorithms may increase significantly the accuracy of land use distribution predictions, and thus they show considerable promise for different land use change modeling and planning.
Acknowledgements
This research was financially supported by the National Natural Science Foun-dation of China (41301202).
Conflicts of Interest
The authors declare no conflicts of interest regarding the publication of this paper.
References
[1] Verburg, P.H., Soepboer, W., Limpiada, R., Espaldon, V., Mastura, S. and Veld-kamp, A. (2002) Modeling the Spatial Dynamics of Regional Land Use: The CLUE-S Model. Environmental Management, 30, 391-405.
https://doi.org/10.1007/s00267-002-2630-x
[2] Verburg, P.H., Schot, P.P., Dijst, M.J. and Veldkamp, A. (2004) Land Use Change Modeling: Current Practice and Research Priorities. GeoJournal, 61, 309-324. https://doi.org/10.1007/s10708-004-4946-y
[3] Li, X. (2011) Emergence of Bottom-Up Models as a tool for Landscape Simulation and Planning. Landscape and Urban Planning, 100, 393-395.
https://doi.org/10.1016/j.landurbplan.2010.11.016
[4] Li, X. and Yeh, A.G.O. (2004) Data Mining of Cellular Automata’s Transition Rules. International Journal of Geographical Information Science, 18, 723-744.
[5] Wu, F. and Webster, C.J. (1998) Simulation of Land Development through the In-tegration of Cellular Automata and Multi-Criteria Evaluation. Environmental Management B: Planning and Design, 25, 103-126. https://doi.org/10.1068/b250103 [6] Manel, S., Dias, J.M. and Ormerod, S.J. (1999) Comparing Discriminant Analysis,
DOI: 10.4236/ijg.2019.101002 27 International Journal of Geosciences [7] Thuiller, W., Lafourcade, B., Engler, R. and Araujio, M.B. (2009) BIOMOD—A Platform for Ensemble Forecasting of Species Distributions. Ecography, 32, 369-373. https://doi.org/10.1111/j.1600-0587.2008.05742.x
[8] White, R. and Engelen, G. (1993) Cellular Automata and Fractal Urban Form: A Cellular Modeling Approach to the Evolution of Urban Land Use Patterns. Envi-ronmental Management A, 25, 1175-1199. https://doi.org/10.1068/a251175
[9] Li, X. and Yeh, A.G.O. (2002) Neural-Network-Based Cellular Automata for Simu-lating Multiple Land Use Changes Using GIS. International Journal of Geographical Information Science, 16, 323-343. https://doi.org/10.1080/13658810210137004 [10] Wu, F. (2002) Calibration of Stochastic Cellular Automata: The Application to
Ru-ral-Urban Land Conversions. International Journal of Geographical Information Science, 16, 795-818. https://doi.org/10.1080/13658810210157769
[11] Elith, J., Graham, C.H., Anderson, R.P., Dudik, M., Ferrier, S., Guisan, A., Hijmans, R.J., Huettmann, F., Leathwick, J.R., Lehmann, A., Li, J., Lohmann, L.G., Loiselle, B.A., Manion, G., Moritz, C., Nakamura, M., Nakazawa, Y., Overton, J.Mc.C., Pe-terson, A.T., Phillips, S.J., Richardson, K.S., Scachetti-Pereira, R., Schapire, R.E., Soberón, J., Williams, S., Wisz, M.S. and Zimmermann, N.E. (2006) Novel Methods Improve Prediction of Species’ Distributions from Occurrence Data. Ecography, 29, 129-151. https://doi.org/10.1111/j.2006.0906-7590.04596.x
[12] Heikkinen, R.K., Luoto, M., Ajaujo, M.B., Virkkala, R., Thuillar, W. and Sykes, M.T. (2006) Methods and Uncertainties in Bioclimatic Envelope Modeling under Climate Change. Progress in Physical Geography, 30, 751-777.
https://doi.org/10.1177/0309133306071957
[13] Guisan, A., Overton, J.M.C., Aspinall, R., Hastie, T., Lehmann, A., Ferrier, S. and Austin, M. (2006) Making Better Biogeographical Predictions of Species’ Distribu-tions. Journal of Applied Ecology, 43, 386-392.
https://doi.org/10.1111/j.1365-2664.2006.01164.x
[14] Araújo, M.B. and New, M. (2007) Ensemble Forecasting of Species Distributions. TRENDS in Ecology and Evolution, 22, 42-47.
https://doi.org/10.1016/j.tree.2006.09.010
[15] Marmion, M., Parviainen, M., Luoto, M., Heikkinen, R.K. and Thuiller, W. (2009) Evaluation of Consensus Methods in Predictive Species Distribution Modeling. Di-versity and Distributions, 15, 59-69.
https://doi.org/10.1111/j.1472-4642.2008.00491.x
[16] Araújo, M.B., Whittaker, R.J., Ladle, R.J. and Erhard, M. (2005) Reducing Uncer-tainty in Projections of Extinction Risk from Climate Change. Global Ecology and Biogeography, 14, 529-538.https://doi.org/10.1111/j.1466-822X.2005.00182.x [17] Thuiller, W., Araújo, M. and Lavorel, S. (2003) Generalized Models vs.
Classifica-tion Tree Analysis: Predicting Spatial DistribuClassifica-tions of Plant Species at Different Scales. Journal of Vegetation Science, 14, 669-680.
https://doi.org/10.1111/j.1654-1103.2003.tb02199.x
[18] Steiner, F., Blair, J., Mcsherry, L., Guhathakurta, S., Marruffo, J. and Holm, M. (2000) A Watershed at a Watershed: The Potential for Environmentally Sensitive Area Protection in the Upper San Pedro Drainage Basin (Mexico and USA). Land-scape and Urban Planning, 49, 129-148.
https://doi.org/10.1016/S0169-2046(00)00062-1
DOI: 10.4236/ijg.2019.101002 28 International Journal of Geosciences https://doi.org/10.1007/s00267-002-2785-5
[20] Turner, II B.L., Skole, D.L., Sanderson, S., Fischer, G., Fresco, L.O. and Leemans, R. (1995) Land-Use and Land-Cover Change: Science/Research Plan. IGBP Report No. 35, HDP Report No. 7, Stockholm and Geneva.
[21] Zou, K.H., O’Malley, A.J. and Mauri, L. (2007) Receiver-Operating Characteristic Analysis for Evaluating Diagnostic Tests and Predictive Models. Circulation, 115, 654-657.https://doi.org/10.1161/CIRCULATIONAHA.105.594929
[22] Swets, J.A. (1988) Measuring the Accuracy of Diagnostic Systems. Science, 240, 1285-1293.https://doi.org/10.1126/science.3287615
[23] Moisen, G.G. and Frescino, T.S. (2002) Comparing Five Modeling Techniques for Predicting Forest Characteristics. Ecological Modelling, 157, 209-225.
https://doi.org/10.1016/S0304-3800(02)00197-7
[24] Cressie, N., Calder, C.A., Clark, J.S., Hoef, J.M.V. and Wikle, C.K. (2009) Account-ing for Uncertainty in Ecological Analysis: The Strengths and Limitations of Hie-rarchical Statistical Modeling. Ecological Applications, 19, 553-570.
https://doi.org/10.1890/07-0744.1
[25] De Veaux, R.D., Psichogios, D.C. and Ungar, L.H. (1993) A Comparison of Two Nonparametric Estimation Schemes: MARS and Neural Networks. Computers and Chemical Engineering, 17, 819-837.https://doi.org/10.1016/0098-1354(93)80066-V [26] Liu, C.R., Berry, P.M., Dawson, T.P. and Pearson, R.G. (2005) Selecting Thresholds
of Occurrence in the Prediction of Species Distributions. Ecography, 28, 385-393.
https://doi.org/10.1111/j.0906-7590.2005.03957.x
[27] Li, X.H., Tian, H.D., Wang, Y., Li, R.Q., Song, Z.M., Zhang, F.C., Xu, M. and Li, D.M. (2012) Vulnerability of 208 Endemic or Endangered Species in China to the Effects of Climate Change. Regional Environmental Change, 13, 843-852.
https://doi.org/10.1007/s10113-012-0344-z
[28] Deng, X.Z., Su, H.B. and Zhan, J.Y. (2008) Integration of Multiple Data Sources to Simulate the Dynamics of Land Systems. Sensors, 8, 620-634.
https://doi.org/10.3390/s8020620
[29] Liu, X.L., Li, Y., Shen, J.L., Fu, X.Q., Xiao, R.L. and Wu, J.S. (2014) Landscape Pat-tern Changes at a Catchment Scale: A Case Study in the Upper Jinjing River Cat-chment in Subtropical Central China from 1933 to 2005. Landscape and Ecological Engineering, 10, 263-276.https://doi.org/10.1007/s11355-013-0221-z
[30] Hadayeghi, A., Shalaby, A. and Persaud, B. (2009) Development of Planning Level Transportation Safety Tools Using Geographically Weighted Poisson Regression. Accident Analysis and Prevention, 42, 676-688.
https://doi.org/10.1016/j.aap.2009.10.016
[31] Bolker, B.M., Brooks, M.E., Clark, C.J., Geange, S.W., Poulsen, J.R., Stevens, H.H. and White, J.S. (2009) Generalized Linear Mixed Models: A Practical Guide for Ecology and Evolution. Trends in Ecology and Evolution, 24, 127-135.