The Effect of Deafferentation on Cerebral Blood
Flow Response to Acetazolamide
Hiroshi Yamauchi, Hidehiko Okazawa, Kanji Sugimoto, Yoshihiko Kishibe, and Masaaki Takahashi
BACKGROUND AND PURPOSE:Decreased cerebral blood flow (CBF) response after acet-azolamide administration may indicate increased cerebral blood volume (CBV) owing to reduced perfusion pressure from major cerebral artery steno-occlusive disease. However, decreased cerebral metabolic rate of oxygen (CMRO2) caused by neuronal damage or
deaffer-entation may also decrease the CBF response to acetazolamide, which adds complexity to the assessment of autoregulatory vasodilatation. The purpose of this study was to investigate the relationship between CBF response to acetazolamide and CBV or CMRO2in a pure form of
deafferentation, crossed cerebellar diaschisis (CCD).
METHODS: We used positron emission tomography to study 17 patients with unilateral supratentorial infarct and contralateral cerebellar hypoperfusion. The CBF response to acet-azolamide was assessed by measuring baseline CBF and CBF 10 minutes after an intravenous injection of acetazolamide. Multivariate analysis was used to test the independent predictive value of the CBV and CMRO2at baseline with respect to the change of CBF during
acetazol-amide administration.
RESULTS:Multivariate analysis revealed that in CCD CBV was significantly and indepen-dently associated with the percent change of CBF during acetazolamide administration (P < .0001), whereas CMRO2was not.
CONCLUSION: In deafferentation, changes in CBV may account for variations in CBF response to acetazolamide and decreased CMRO2may not affect CBF response to
acetazol-amide expressed as the percent change.
Evaluation of the cerebral blood flow (CBF) response to acetazolamide is widely used to evaluate the vaso-dilatory capacity in patients with major cerebral arte-rial occlusive diseases (1, 2). The CBF response to acetazolamide as assessed by quantitative CBF eval-uation may be predictive of the risk of stroke, sug-gesting that evaluation of the CBF response to acet-azolamide may be important for the treatment of patients with steno-occlusive lesions of the major ce-rebral arteries (3–5). Reduction of cece-rebral perfusion pressure due to severe atherosclerotic disease of the cerebral arteries causes autoregulatory cerebral vaso-dilatation, which acts to keep CBF constant. At an early stage, the CBF response to acetazolamide may be reduced according to the degree of vasodilatation that is reflected by an increase of cerebral blood
volume (CBV). With further reduction in perfusion pressure, the autoregulatory capacity is exceeded, and CBF falls passively as a function of pressure. Then, the CBF response to vasodilatory stimuli may be absent, because vasodilatory capacity may be ex-hausted. Thus, a decrease of the CBF response to acetazolamide may reflect an increase of CBV caused by reduced perfusion pressure in patients with major cerebral artery steno-occlusive lesions (6, 7). How-ever, a decrease in cerebral metabolic rate of oxygen (CMRO2) caused by ischemia may also decrease the CBF response to acetazolamide by decreasing the production of carbon dioxide (CO2) (7, 8), which adds complexity to the quantitative assessment of cerebral autoregulatory vasodilation.
In patients with major cerebral arterial occlusive diseases, the decreased CMRO2 in the normal-ap-pearing cerebral cortex may be caused by primary minor ischemic change, including neuronal loss or secondary metabolic change through deafferentation (9, 10). Therefore, knowledge of the effect of primary minor ischemic change or deafferentation on the CBF response to acetazolamide may make it possible to interpret the results of the acetazolamide test Received April 2, 2003; accepted after revision July 3.
From the Research Institute, Shiga Medical Center, Moriyama, Japan.
Address correspondence and reprint requests to Dr. Hiroshi Yamauchi, Research Institute, Shiga Medical Center, 5-4-30 Moriyama, Moriyama City, Shiga 524-8524, Japan.
©American Society of Neuroradiology
properly. Although it is difficult to study the region with primary minor ischemic change selectively, crossed cerebellar diaschisis (CCD) can be studied as one example of a pure form of deafferentation (11). Some supratentorial brain lesions cause a decrease in CBF and metabolism in the contralateral cerebellum without morphologic change. The main mechanism responsible for this phenomenon appears to be deaf-ferentation through the cortico-ponto-cerebellar tract (10–12). Decreased CMRO2resulting from deaffer-entation may cause vasoconstriction, which may result in decreased CBV (12). It is not yet known how these changes in CBV and CMRO2 affect the CBF re-sponse to acetazolamide in deafferentation. The pur-pose of this study was to investigate the relationship between CBF response to acetazolamide and CBV or CMRO2in CCD.
Methods
Patients
Seventeen patients (12 male, five female; age, 61⫾12 years [mean⫾SD]) with unilateral supratentorial infarcts were en-rolled in this study. Five patients had cortical infarcts in the middle cerebral artery (MCA) territory, and 12 had purely subcortical infarcts in the MCA territory. All patients fulfilled the following criteria: 1) significant CBF asymmetry in the cerebellum as compared with normal subjects; 2) absence of clinical symptoms of ischemia in the vertebrobasilar artery territory; 3) absence of gross morphologic alterations in the cerebellum and brain stem at MR imaging; and 4) normal conventional angiographic findings in the vertebrobasilar sys-tem. The interval between ischemic event and positron emis-sion tomography (PET) examination was 7⫾16 months.
PET Measurements
All the subjects underwent PET with a whole-body scanner (Advance; General Electric Medical Systems, Milwaukee, WI), which permits simultaneous acquisition of 35 image sections with intersection spacing of 4.25 mm (13, 14). Written informed consent was obtained from each subject under the guidance of the Ethics Committee of the Shiga Medical Center. Perfor-mance tests showed the intrinsic resolution of the scanner to be 4.6–5.7 mm in the transaxial direction and 4.0–5.3 mm in the axial direction. As part of the scanning procedure, but before the tracer administration,68Ge/68Ga transmission scanning was
performed for 10 minutes for attenuation correction. For recon-struction of the PET data, images were blurred to 6.0 mm full-width half-maximum in the transaxial direction by using a Han-ning filter. Functional images were reconstructed as 128⫻128 pixels, with each pixel representing an area of 2.0 mm⫻2.0 mm. The subjects were placed in the scanner with their heads immobilized with a head-holder and positioned with light beams to obtain transaxial sections parallel to the orbitomeatal line. A small cannula was placed in the left brachial artery for blood sampling. First, a baseline H215O study was performed
(14, 15). After intravenous bolus injection of 555 MBq of H215O into the right antecubital vein, a 3-minute dynamic PET
scan was started at the time of tracer administration with frame durations of 5 seconds⫻12, 10 seconds⫻6, and 20 seconds⫻ 3. Arterial blood was continuously drawn from a catheter in the radial artery by using a minipump (AC-2120; Atto Co., Tokyo, Japan), and the concentration of radioactivity was monitored with a coincidental flow-through radioactivity detector (Pico-Count;Bioscan Inc., Washington, DC) (16) and used as an input function for data analysis.
After the baseline H215O study, a series of15O-gas studies
were performed. C15O
2and 15O2 were inhaled continuously
through a mask (14). The scan time was 5 minutes, and arterial blood was sampled manually from the brachial artery three times during each scan. Each sample was collected for 10–20 seconds to average the fluctuation due to the respiratory cycle, and the radiotracer concentrations of whole blood and plasma were measured with a well counter. Inhalation of C15O with
3-minute scanning was used to measure the CBV. Arterial samples were obtained manually twice during the scanning, and the radiotracer concentration of whole blood was measured.
After the15O-gas study, 1 g of acetazolamide was
adminis-tered intravenously (15). Ten minutes after administration, a second H215O study was done: an intravenous bolus injection of
555 MBq of H215O and a 3-minute dynamic PET scan were
performed in the same way as in the baseline study.
No subject showed a significant change in PaCO2 during
PET scanning, and the changes in the physiologic data during acetazolamide administration were small in all patients.
In the 15O-gas study, we calculated CBF, CMRO 2, and
oxygen extraction fraction (OEF) on the basis of the steady-state method (17). CMRO2 and OEF were corrected by the
CBV (18). In the H215O study, CBF was calculated by using the
autoradiographic method with a partition coefficient of 0.9 (mL/g) (19, 20).
Data Analysis
We analyzed images in the tomographic plane correspond-ing to the level of the cerebellum. We used the scan section that most satisfactorily visualized the cerebellar hemisphere. First, in the baseline H215O-CBF image, we placed three circular
regions of interest 16 mm in diameter over the gray matter of the cerebellar hemisphere ipsilateral to the supratentorial le-sion. These regions of interest were then copied on the con-tralateral side with respect to the anteroposterior axis, which was determined in relation to the interhemispheric line in the upper section of the CBF image. We took care not to include the sinus in the regions of interest, by comparing the CBF image with the CBV image (12).
From the absolute values of the PET variables, we calcu-lated the percent difference between the contralateral (CL) and ipsilateral (IL) cerebellar cortex (asymmetry index) asAI (%)⫽(CL⫺IL)/IL⫻100. We assumed that the resulting values reflected the percent changes caused by CCD. We also studied seven younger healthy subjects (mean age 46⫾6 years) by using the15O-gas steady state method, and calculated the AI
between the right (R) and left (L) cerebellar cortex asAI⫺L (%)⫽(R⫺L)/L⫻100 andAI⫺R(%)⫽(L⫺R)/R⫻100. AI⫺LandAI⫺Rfor CBF in the healthy subjects (mean⫾ SD) were ⫺0.01 ⫾ 2.07% and 0.14 ⫾ 2.06%, respectively. Patients with significant cerebellar CBF asymmetry (ie, with an individual value of AI below⫺6.30% for a left supratentorial stroke or below⫺6.04% for a right supratentorial stroke, the respective means⫺3 SD in normal subjects) were selected as the study subjects.
In each hemisphere, we calculated the absolute and percent differences between the values obtained after acetazolamide administration and the values at baseline (⌬and⌬%) as⌬ ⫽ CBF value (acetazolamide)⫺CBF value (baseline) and⌬%⫽ ⌬/(CBF value [baseline]) ⫻ 100 (%). We assumed that the resulting values reflected the absolute and percent changes caused by acetazolamide administration.
Statistical Analysis
We compared the results, except for CBF, in each cerebellar cortex by using the Wilcoxon signed-rank test. Differences were considered significant atP⬍.05.
Spearman rank correlation was used to analyze the relation-ship of CBV or CMRO2to the change of CBF during
regarded as indicating statistical significance. We also used multiple linear regression analysis to test the independent pre-dictive value of CBV or CMRO2with respect to the change of
CBF during acetazolamide administration (⌬and ⌬%). We applied this analysis by using the hemispheric values of the change of CBF (⌬ or ⌬%) in each hemisphere (34 hemi-spheres) as the dependent variable and the baseline value of CBV or CMRO2as the independent variable. We adopted the
two hemispheric values for each patient because of the sus-pected hemispheric difference of baseline hemodynamics and metabolism in each patient, although the data are not indepen-dent of each other.
Results
In the group as a whole, in the cerebellar cortex contralateral to the supratentorial infarction, signifi-cant decreases of CMRO2and CBV and an increase of OEF were found, as compared with the respective values in the ipsilateral cerebellar cortex. The abso-lute change of CBF during acetazolamide administra-tion in the contralateral cerebellar cortex was signif-icantly less than that in the ipsilateral cortex, whereas the percent change of CBF showed no significant difference between the two cortices (Table 1).
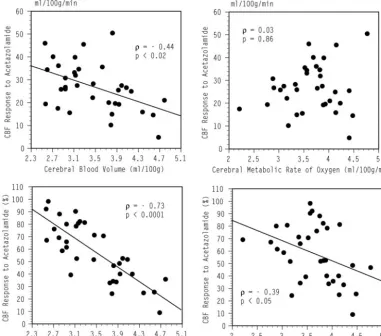
In univariate analysis, the absolute change of CBF during acetazolamide administration was significantly and negatively correlated with CBV, whereas the per-cent change of CBF was significantly and negatively correlated with both CBV and CMRO2 (Fig 1). At baseline, CBV was significantly and positively corre-lated with CMRO2 (Spearman correlation coeffi-cient,⫽ 0.66;P⬍ .001).
The positive relationships between CMRO2 and the absolute change of CBF during acetazolamide administration became significant after controlling for the effect of CBV by using multiple linear regres-sion analysis (model 2 in Table 2). This model, which included the values of CBV and CMRO2, accounted for a significant proportion of the variance of the absolute change of CBF (P⬍.0001;R2⫽0.53). CBV accounted for 20.5% of the variance of the change of CBF, whereas CMRO2 accounted for 32.5% of the variance.
The negative relationship between CMRO2and the percent change of CBF during acetazolamide admin-istration, which was significant in univariate analysis, became insignificant after controlling for the effect of CBV by using multiple linear regression analysis (Ta-ble 3, model 2). The CBV was a significant indepen-dent predictor of the percent change of CBF and accounted for 62.3% of the variance.
Discussion
[image:3.603.55.281.89.190.2]This study showed that, in deafferentation, varia-tions in the CBF response to acetazolamide are ac-counted for by changes in CBV and a decrease in CMRO2does not affect the CBF response to acet-azolamide expressed as the percent change. We found that both the absolute and percent changes of CBF during acetazolamide administration were sig-nificantly and negatively correlated with the baseline CBV value in CCD. In multivariate analysis, although both CBV and CMRO2were independent predictors of the absolute change of CBF, only CBV was an independent predictor of the percent change. For the absolute CBF response, CBV accounted for 20.5% of the variance and CMRO2 accounted for 32.5%. As expected from the mechanism of the vasodilatory effect of acetazolamide, CMRO2 was positively cor-related with the CBF change. On the other hand, only CBV accounted for a significant proportion of the variance of the percent change of CBF (62.3%). The CBF response to acetazolamide expressed as the per-cent change can thus be used to estimate CBV in CCD because of the minor contribution of CMRO2. Several studies using various methods to measure CBF investigated the acetazolamide reactivity in CCD and showed inconsistent results (21–25). Two recent studies in which CBF response to acetazol-amide was assessed by quantitative CBF by using PET showed no significant difference between the cerebel-lar hemispheres in the CBF response to acetazol-amide expressed as the percent change (24, 25), in agreement with the findings of the present study. Because CBV was reduced in CCD, CBF response to acetazolamide should be increased if acetazolamide reactivity indicates vasodilatory capacity. In CCD, however, CMRO2 is also reduced, and reduced CMRO2may cause a reduction of the CBF response to acetazolamide. The vasodilatory effect of acetazol-amide probably occurs through inhibition of carbonic anhydrase in circulating red blood cells, which inter-feres with CO2clearance from the brain because of conversion of the CO2to circulating bicarbonate (1, 8). Consequently, increased levels of CO2 around cerebral vessels cause cerebral vasodilatation. Thus, the vasodilatory effect of acetazolamide may depend on the level of the production of CO2, which may be associated with baseline CMRO2. In the patients studied here, CBV was positively correlated with CMRO2. Therefore, the positive effect of the de-creased CBV on the CBF response to acetazolamide may have been counterbalanced by the negative effect of the decrease of CMRO2, resulting in the lack of TABLE 1: Baseline values of PET variables and CBF response to
acetazolamide in the cerebellar hemispheres contralateral and ipsilateral to the supratentorial infarction
Variable
Hemisphere
Contralateral Ipsilateral CBF (mL/100g/min) 43.0⫾7.5 55.0⫾8.8 CMRO2(mL/100g/min) 3.29⫾0.48* 4.01⫾0.34
OEF (%) 45.4⫾5.5* 43.3⫾5.0 CBV (mL/100g) 3.20⫾0.60* 3.72⫾0.56 CBF change (mL/100g/min) 24.9⫾10.6† 28.7⫾10.2 CBF change (%) 60.6⫾23.6 54.4⫾22.6
Note.—Values are the mean⫾SD. CBF signifies cerebral blood flow; CMRO2, cerebral metabolic rate of oxygen; OEF, oxygen
extrac-tion fracextrac-tion; CBV, cerebral blood volume; CBF change, the change of CBF during acetazolamide administration.
*P⬍.005 versus corresponding value in the contralateral cortex (Wilcoxon signed-rank test).
hemispheric difference in the CBF response ex-pressed as the percent change. For the CBF response expressed as the absolute change, the negative effect of the decrease of CMRO2was large, which caused a hemispheric difference in the CBF response.
Previous studies using PET showed a negative cor-relation between the change of CBF during acetazol-amide administration and the baseline value of CBV in patients with major cerebral arterial occlusive dis-ease, which supports the notion that evaluation of the CBF response to acetazolamide may be useful for estimating the degree of cerebral autoregulatory va-sodilatation in response to reduced perfusion
pres-sure (6, 7). This correlation, however, was shown to be weakened by the confounding effect of a decrease in CMRO2 on the CBF response to acetazolamide (7). In patients with major cerebral arterial occlusive disease and cerebral infarcts, neuronal damage or deafferentation may cause decreased CMRO2in the normal-appearing cerebral cortex (10). In the present study, the CBF response to acetazolamide expressed as the percent change was shown to be correlated only with the CBV in CCD, which suggests that any de-creases in the CMRO2resulting from deafferentation may not affect the CBF response to acetazolamide. In patients with major cerebral arterial occlusive
[image:4.603.101.482.63.399.2]dis-FIG 1. Scatterplots relating the absolute (upper row) or percent (lower row) change in CBF during acetazolamide administration to the values of CBV (left panels) or CMRO2(right panels) at baseline in the cerebellar hemispheres on both sides.
TABLE 2: Multiple linear regression analysis of the absolute change of CBF during acetazolamide administration as the dependent variable
Variable Coefficient
Standard
Error t Pvalue Model 1:
CBV (mL/100g) ⫺7.9 2.5 ⫺3.0 ⬍.005 Model 2:
CBV (mL/100g) ⫺15.6 2.5 ⫺6.1 ⬍.0001 CMRO2(mL/100g/min) 14.0 2.9 4.8 ⬍.0001
Note.—CBV signifies cerebral blood volume; CMRO2, cerebral
metabolic rate of oxygen.
TABLE 3: Multiple linear regression analysis of the percent change of CBF during acetazolamide administration as the dependent variable
Variable Coefficient
Standard
Error t Pvalue Model 1:
CBV (mL/100g) ⫺28.9 3.8 ⫺7.4 ⬍.0001 Model 2:
CBV (mL/100g) ⫺33.0 4.9 ⫺6.7 ⬍.0001 CMRO2(mL/100g/min) 7.5 5.6 1.3 .20
Note.—CBV signifies cerebral blood volume; CMRO2, cerebral
[image:4.603.54.282.470.552.2] [image:4.603.304.534.471.553.2]eases, if CMRO2reduction correlates with CBF re-sponse to acetazolamide, it is not deafferentation, but neuronal damage, that is confounding the CBF re-sponse, on the assumption that similar relationships exist in the cerebral cortical areas. Therefore, the evaluation of the neuronal integrity may be needed to interpret the results of the acetazolamide test prop-erly. This can be done by visualizing the distribution of central-type benzodiazepine receptors (9, 26). If neuronal integrity is preserved in the cerebral cortex ipsilateral to the major cerebral arterial lesion, the CBF response to acetazolamide could be used as an index of preexisting vasodilatation. In our study, no patients showed atrophy of the cerebellar cortex con-tralateral to the supratentorial infarction. Neuronal damage due to transneuronal degeneration would cause a severe decrease of CMRO2that might con-tribute to reduced CBF response to acetazolamide.
Conclusion
In deafferentation, variations in the CBF response to acetazolamide may be accounted for by changes in CBV, and a reduction in CMRO2may not affect the CBF response expressed as the percent change. Eval-uation of the CBF response to acetazolamide may be useful for estimating CBV in regions with secondary metabolic depression caused by deafferentation.
References
1. Vorstrup S.Tomographic cerebral blood flow measurements in patients with ischemic cerebrovascular disease and evaluation of the vasodilatory capacity by the acetazolamide test.Acta Neurol Scand Suppl1988;114:1–48
2. Yonas H, Pindzola RR.Physiological determination of cerebrovas-cular reserves and its use in clinical management. Cerebrovasc Brain Metab Rev1994;6:325–340
3. Yonas H, Smith HA, Durham SR, et al. Increased stroke risk predicted by compromised cerebral blood flow reactivity.J Neuro-surg1993;79:483–489
4. Kuroda S, Houkin K, Kamiyama H, et al.Long-term prognosis of medically treated patients with internal carotid or middle cerebral artery occlusion: can acetazolamide test predict it?Stroke2001;32: 2110–2116
5. Ogasawara K, Ogawa A, Terasaki K, et al.Use of cerebrovascular reactivity in patients with symptomatic major cerebral artery oc-clusion to predict 5-year outcome: comparison of xenon-133 and iodine-123-IMP single-photon emission computed tomography. J Cereb Blood Flow Metab2002;22:1142–1148
6. Nariai T, Suzuki R, Hirakawa K, et al.Vascular reserve in chronic cerebral ischemia measured by the acetazolamide challenge test: comparison with positron-emission tomography.AJNR Am J Neu-roradiol1995;16:563–570
7. Yamauchi H, Okazawa H, Kishibe Y, et al.Reduced blood flow response to acetazolamide reflects pre-existing vasodilation and decreased oxygen metabolism in major cerebral arterial occlusive
disease.Eur J Nucl Med2002;29:1349–1356
8. Gotoh F, Meyer JS, Tomita M.Carbonic anhydrase inhibition and cerebral venous blood gases and ions in man.Arch Intern Med
1966;117:39–46
9. Garcia JH, Lassen NA, Weiller C, et al.Ischemic stroke and incomplete infarction.Stroke1996;27:761–765
10. Feeney DM, Baron JC.Diaschisis.Stroke1986;17:817–830 11. Baron JC, Bousser MG, Comar D, Castaigne P.Crossed cerebellar
diaschisis in human supratentorial brain infarction. Trans Am Neurol Assoc1980;105:459–461
12. Yamauchi H, Fukuyama H, Kimura J.Hemodynamic and meta-bolic changes in crossed cerebellar hypoperfusion.Stroke1992;23: 855–860
13. DeGardo T, Turkington T, Williams J, et al.Performance charac-teristics of a whole-body PET scanner.J Nucl Med1994;35:1398– 1406
14. Okazawa H, Yamauchi H, Sugimoto K, et al.Quantitative compar-ison of the bolus and steady-state methods for measurement of cerebral perfusion and oxygen metabolism: positron emission to-mography study using15O gas and water.J Cereb Blood Flow Metab
2001;21:793–803
15. Okazawa H, Yamauchi H, Sugimoto K, et al.Effects of acetazol-amide on cerebral blood flow, blood volume, and oxygen metabo-lism: a positron emission tomography study with healthy volun-teers.J Cereb Blood Flow Metab2001;21:1472–1479
16. Votaw JR, Shulman SD.Performance evaluation of the pico-count flow-through detector for use in cerebral blood flow PET studies. J Nucl Med1998;39:509–515
17. Frackowiak RSJ, Lenzi GL, Jones T, Heather JD.Quantitative measurement of regional cerebral blood flow and oxygen metabo-lism in man using15O and positron emission tomography: theory,
procedure, and normal values.J Comput Assist Tomogr1980;4:727– 736
18. Lammertsma AA, Jones T.Correction for the presence of intra-vascular oxygen-15 in the steady-state technique for measuring regional oxygen extraction ratio in the brain. 1. Description of the method.J Cereb Blood Flow Metab1983;3:416–424
19. Herscovitch P, Markham J, Raichle ME.Brain blood flow mea-sured with intravenous H2(15)O. I. Theory and error analysis. J Nucl Med1983;24:782–789
20. Raichle ME, Martin WRW, Herscovitch P, et al.Brain blood flow measured with intravenous H2(15)O. II. Implementation and val-idation.J Nucl Med1983;24:790–798
21. Bogsrud TV, Rootwelt K, Russell D, Nyberg-Hansen R. Acetazol-amide effect on cerebellar blood flow in crossed cerebral-cerebellar diaschisis.Stroke1990;21:52–55
22. Matsuda H, Tsuji S, Sumiya H, et al. Acetazolamide effect on vascular response in areas with diaschisis as measured by Tc-99m HMPAO brain SPECT.Clin Nucl Med1992;17:581–586
23. Sakashita Y, Matsuda H, Kakuda K, Takamori M.Hypoperfusion and vasoreactivity in the thalamus and cerebellum after stroke. Stroke1993;24:84–87
24. Kuwabara Y, Ichiya Y, Sasaki M, et al.Cerebellar vascular re-sponse to acetazolamide in crossed cerebellar diaschisis: a com-parison of 99mTc- HMPAO single-photon emission tomography
with 15O-H2O positron emission tomography. Eur J Nucl Med
1996;23:683–689
25. Ito H, Kanno I, Shimosegawa E, et al. Hemodynamic changes during neuronal deactivation in human brain: a positron emission tomography study of crossed cerebellar diaschisis.Ann Nucl Med
2002;16:249–254