ORIGINAL RESEARCH
FUNCTIONAL
Disrupted Brain Connectivity Patterns in Patients with
Type 2 Diabetes
XY. Cui, XS.-F. Li, XH. Gu, XY.-Z. Hu, XX. Liang, XC.-Q. Lu, XY. Cai, XC.-X. Wang, XY. Yang, and XG.-J. Teng
ABSTRACT
BACKGROUND AND PURPOSE: Type 2 diabetes is associated with an increased risk of dementia. This study investigated the global connectivity patterns in the brains of patients with type 2 diabetes by using a functional MR imaging technique.
MATERIALS AND METHODS: Forty patients and 43 age-, sex-, and education-matched healthy controls underwent resting-state func-tional imaging in a 3T MR imaging unit. Degree centrality, a commonly used measurement of global connectivity, was computed for a full-brain exploration of the regions influenced by type 2 diabetes. We then examined the functional connectivity of each region by using the seed-based approach. Finally, voxelwise correlation analyses were performed to explore the relationship among the connectivity changes, cognitive performance, and diabetes-related variables.
RESULTS:Patients exhibited decreased degree centrality in the left lingual gyrus and increased centrality in the right insula and dorsal anterior cingulate cortex (correctedP⬍.05). The occipital network anchored in the lingual gyrus showed extensively reduced connec-tivity, while the network connectivity of the insula and cingulate cortex (mostly included in the salience network) was significantly elevated (correctedP⬍.05). Correlational analyses revealed that in the diabetic group, impaired visual memory and executive function perfor-mance were correlated with occipital hypoconnectivity, while higher fasting plasma glucose levels and better executive functioning were related to anterior cingulate cortex hyperconnectivity (all correctedPvalues⬍.05). Similar effects were not detected in the controls.
CONCLUSIONS: This preliminary study shows that network connectivity is altered in patients with type 2 diabetes, which may provide critical insight into the neural substrate of diabetes-related cognitive decline.
ABBREVIATIONS:CFT⫽Complex Figure Test; dACC⫽dorsal anterior cingulate cortex; DC⫽degree centrality; FC⫽functional connectivity; FPG⫽fasting plasma glucose; HbA1c⫽glycosylated hemoglobin; HC⫽healthy control; T2DM⫽type 2 diabetes mellitus; TMT⫽Trail-Making Test
I
t has been suggested that type 2 diabetes mellitus (T2DM) is associated with cognitive dysfunction and a higher risk of de-mentia, especially in elderly subjects.1,2However, the neural sub-strate of T2DM-related cognitive impairment remains elusive. Because brain pathologies may precede clinically measurable cog-nitive deficits,3identifying vulnerable brain regions might be ad-vantageous for tracking the early effects of T2DM on cognitive functioning.The human brain consists of spatially distributed but func-tionally interacting regions that form an efficient functional con-nectome to support normal cognitive functioning.4Recent stud-ies on patients with Alzheimer disease suggest that altered functional connectivity (FC) between regions may represent early deleterious outcomes that occur before structural changes and clinical manifestations.5However, only a limited number of stud-ies have explored FC changes in relation to T2DM so far: One study reported a decreased FC of the hippocampus, while another study observed alterations in thalamocortical connections.6,7 Other studies on this topic focused on the changes either within the default mode network8-10or in the attentional network.11 Notably, these studies relied on seed-based approaches or an in-Received September 24, 2015; accepted after revision May 11, 2016.
From the Department of Radiology (Y.Cui, C.-Q.L., Y.Cai, C-X.W., G.-J.T.), Jiangsu Key Laboratory of Molecular and Functional Imaging, Zhongda Hospital, Medical School of Southeast University, Nanjing, China; and Neuroimaging Research Branch (Y.Cui, S.-F.L., H.G., Y.-Z.H, X.L., Y.Y.), National Institute on Drug Abuse, National Institutes of Health, Baltimore, Maryland.
This work was supported by grants from the Major State Basic Research Develop-ment Program of China (973 Program) (Nos. 2013CB733800, 2013CB733803), the Key Project of Jiangsu Province Natural Science Foundation of China (BK20130057), and the National Natural Science Foundation of China General Projects (Nos. 81230034, 81271739). S.-F.L., H.G., Y.-Z.H., X.L., and Y.Y. were supported by the Intramural Re-search Program of the National Institute on Drug Abuse, the National Institutes of Health.
Please address correspondence to Gao-Jun Teng, MD, 87 Dingjiaqiao Rd, Nanjing 210009, Jiangsu, China; e-mail: [email protected]
Indicates open access to non-subscribers at www.ajnr.org
Indicates article with supplemental on-line table.
Indicates article with supplemental on-line photos.
dependent component analysis, focusing their examinations within specific brain networks. Based on pathologic evidence, neural degeneration in the brains of those with diabetes is dif-fusely distributed.12Therefore, a voxelwise whole-brain FC anal-ysis may yield a more comprehensive understanding of the func-tional alterations related to the disease.
Degree centrality (DC) is a commonly used graph theory– based measurement of global connectivity. It computes the cor-relation of each voxel with all other voxels in the entire brain, resulting in a connectivity map that represents the sum (attenua-tion) of connections at each voxel.13Recent studies from our group have demonstrated that DC is highly associated with re-gional cerebral blood flow and metabolism, which establish the physiologic basis of this topologic measurement.14So far, DC analyses have been applied to various mental disorders, such as Alzheimer disease, schizophrenia, and autism.15-17In this study, we used DC measurements to perform a full-brain exploration of brain regions with altered connectivity density. The FC pattern of each region was subsequently examined by using a seed-based approach. Finally, correlations among the connectivity in each brain circuit, cognitive performance, and T2DM-relevant vari-ables were explored to better understand the link between net-work dysfunction and cognitive deficits.
MATERIALS AND METHODS
Participants
The current study was approved by the ethics committee of the institutional review board of Zhongda Hospital, Southeast Uni-versity. Written informed consent was obtained from all subjects before their participation. Patients with T2DM and age-, sex-, and education-matched healthy controls (HCs) were recruited via ad-vertisement in the local community. All subjects were between 50 and 75 years of age, with a minimum education of 6 years. The exclusion criteria were as follows: a history of alcohol or
sub-stance abuse, Mini-Mental State Ex-amination score of⬍24,18a Hamilton Depression Rating Scale score ofⱖ7,19 a history of brain lesions such as tumor or stroke, an unrelated psychiatric or neurologic disorder, or MR imaging contraindications.
The diagnosis of T2DM was made on the basis of medical histories, medica-tion used, or fasting plasma glucose (FPG) levels (ⱖ7 mmol/L).20None of the patients reported any history of hypoglycemic episodes or had been diag-nosed with clinically detectable compli-cations such as retinopathy, nephro-pathy, and peripheral neuropathy. HCs underwent an oral glucose tolerance test (75 g of dextrose monohydrate in 250 mL of water). HCs with fasting blood glucose levels ofⱖ7.0 mmol/L or post-oral glucose tolerance test glucose levels ofⱖ7.8 mmol/L were excluded.
Information on medical histories and medication use was collected, and weight, height, and waist circumferences were carefully recorded for all subjects. Hypertension was defined as previously de-scribed.21Blood samples were collected after an 8-hour fast to assess FPG, glycosylated hemoglobin (HbA1c), fasting insulin, and cholesterol levels. The homeostasis model assessment of in-sulin resistance was used to assess the degree of inin-sulin resistance for all HCs and patients who were not treated with insulin.22
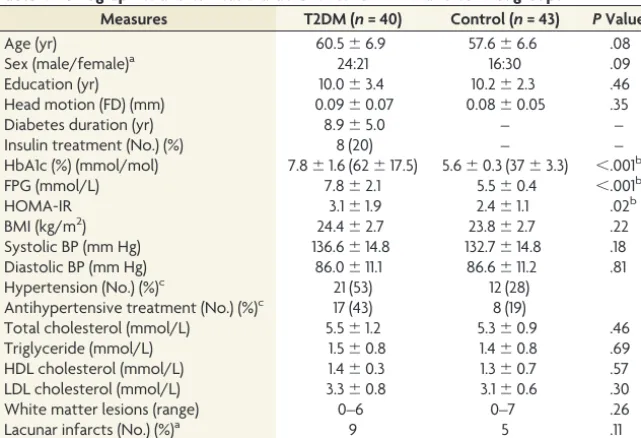
The final study sample included 40 patients with T2DM (mean age, 60.5⫾6.9 years; 21 women) and 43 HCs (57.6⫾6.6 years, 30 women) (Table 1), who were 50 –75 years of age. Among the pa-tients, disease duration ranged from 2 to 17 years (mean duration, 8.9⫾5.0 years). Eight patients with T2DM received insulin treat-ment, while the others were treated with either oral hypoglycemic agents (n⫽22) or dietary restrictions (n⫽10).
Neuropsychological Tests
All participants were subjected to a detailed battery of neuropsy-chological tests, which covered multiple cognitive domains. Episodic memory regarding verbal and visual information was assessed via the Auditory Verbal Learning Test and the Rey-Os-terrieth Complex Figure Test (CFT) delayed recall trial, respec-tively. Working memory was measured via the forward and back-ward trials of the Digit Span Test. Attention was evaluated via the Trail-Making Test part A, and executive functioning was assessed via Trail-Making Test part B (TMT-B). Spatial processing ability was assessed via the Clock Drawing Test and the CFT copy trial. Language processing ability was assessed via the Verbal Fluency Test. The total time required to complete all tests was approxi-mately 60 minutes.
MR Imaging Data Acquisition
The resting-state fMRI data were acquired in a 3T Magnetom Trio scanner (Siemens, Erlangen, Germany). Foam padding and ear-Table 1: Demographics and clinical characteristics for T2DM and control groupsa
Measures T2DM (n= 40) Control (n= 43) PValue
Age (yr) 60.5⫾6.9 57.6⫾6.6 .08
Sex (male/female)a 24:21 16:30 .09
Education (yr) 10.0⫾3.4 10.2⫾2.3 .46
Head motion (FD) (mm) 0.09⫾0.07 0.08⫾0.05 .35
Diabetes duration (yr) 8.9⫾5.0 – –
Insulin treatment (No.) (%) 8 (20) – –
HbA1c (%) (mmol/mol) 7.8⫾1.6 (62⫾17.5) 5.6⫾0.3 (37⫾3.3) ⬍.001b
FPG (mmol/L) 7.8⫾2.1 5.5⫾0.4 ⬍.001b
HOMA-IR 3.1⫾1.9 2.4⫾1.1 .02b
BMI (kg/m2) 24.4⫾2.7 23.8⫾2.7 .22
Systolic BP (mm Hg) 136.6⫾14.8 132.7⫾14.8 .18
Diastolic BP (mm Hg) 86.0⫾11.1 86.6⫾11.2 .81
Hypertension (No.) (%)c 21 (53) 12 (28)
Antihypertensive treatment (No.) (%)c 17 (43) 8 (19)
Total cholesterol (mmol/L) 5.5⫾1.2 5.3⫾0.9 .46
Triglyceride (mmol/L) 1.5⫾0.8 1.4⫾0.8 .69
HDL cholesterol (mmol/L) 1.4⫾0.3 1.3⫾0.7 .57
LDL cholesterol (mmol/L) 3.3⫾0.8 3.1⫾0.6 .30
White matter lesions (range) 0–6 0–7 .26
Lacunar infarcts (No.) (%)a 9 5 .11
Note:—FD indicates frame-wise displacement; HOMA-IR, homeostasis model assessment of insulin resistance; BP, blood pressure; BMI, body mass index; LDL, low-density lipoprotein; HDL, high-density lipoprotein.
a
Data are mean and number or range.
b
Pvalue⬍.05.
c
Statistical analyses were performed by2
[image:2.594.56.377.54.273.2]plugs were used to reduce head motion and scanner noise. Sub-jects were instructed to keep their eyes closed, remain awake, and avoid specific thoughts during the scanning, which was later con-firmed by using a questionnaire. A 6-minute whole-brain fMRI dataset based on blood oxygen level– dependent signals was ac-quired for each subject by using a gradient-echo EPI sequence (volume⫽240, sections⫽36, TR/TE⫽2000/25 ms, section thickness⫽4 mm, flip angle⫽90°, FOV⫽240 mm, acquisition matrix⫽64⫻64). High-resolution (1-mm3) T1-weighted im-ages were acquired by using a whole-brain 3D MPRAGE sequence (sections⫽176, TR/TE⫽1900/2.48 ms, section thickness⫽1.0 mm, flip angle⫽9°, FOV⫽250 mm, acquisition matrix⫽256⫻ 256). FLAIR images were also obtained (TR/TE⫽8500/94 ms, sections⫽20, section thickness⫽5 mm, each with a voxel size of 1.3⫻0.9⫻5 mm3).
To assess small-vessel disease, we evaluated the white matter lesions and lacunar infarcts on FLAIR images.23The brain was divided into 5 regions in each hemisphere, and the WM lesion score was determined separately for each region on a 4-point scale (from 0 to 3), resulting in final scores ranging from 0 to 30.23 Participants with a score of 3 in any region were considered to have severe small-vessel disease and were thus excluded. The final results indicated that none of the participants met the white mat-ter lesion exclusion crimat-teria.
Data Preprocessing
Functional MR imaging data were preprocessed by using Data Processing Assistant for Resting-State fMRI software (http:// www.restfmri.net/forum/DPARSF) and SPM8 (http://www.fil. ion.ucl.ac.uk/spm/). After discarding the first 10 functional vol-umes, section-timing correction and realignment were subse-quently performed (subjects with head motion of⬎2.0 mm of translation or⬎2.0° of rotation were excluded). Structural and functional images were then coregistered and normalized to the standard Montreal Neurological Institute space. Afterward, nui-sance covariates, including 6 motion parameters, white matter, and CSF signals, were regressed out, followed by detrending and bandpass filtering (0.01– 0.1 Hz) procedures. To minimize mo-tion-induced artificial correlations, we cleaned functional images by applying a scrubbing procedure that removed images (frames) with⬎0.5-mm frame-wise displacement, along with the 2 frames immediately before and after the removed images.24The number of scrubbed imaging volumes for each individual is summarized in On-line Fig 1. The mean frame-wise displacement of each sub-ject was included as a motion covariate in the statistical analyses.
DC Analyses
DC maps can be represented as either weighted or binarized graphs, with the former focusing on the sum of weights from edges connecting to a node and the latter, on the number of the connected edges.13Here, both graphs were computed to obtain more comprehensive information. The DC maps were generated by using Pearson correlations in Matlab (MathWorks, Natick, Massachusetts). Specifically, the time course of each voxel within a gray matter mask (obtained from the overlap of all subjects’ segmented GM) was extracted and correlated with that of every other voxel within the mask to generate a correlation matrix. After
thresholding each correlation atR⬎0.25, we computed DC as either the sum of connections (binarized) or the sum of the weights of connections (weighted) for each voxel. The resulting voxelwise DC map was subsequently converted into azscore map by subtracting the global mean DC and dividing by the SD of the whole-brain DC.13Finally, the DC maps were smoothed with a Gaussian kernel of 4 mm to obtain the individual DC maps for each subject.
Further analyses for DC maps were performed by using the Analysis of Functional Neuro Images software (AFNI; http:// afni.nimh.nih.gov/afni).25The smoothed individual DC maps of all subjects in each group were analyzed by using a 1-samplettest to identify the spatial distribution of the DC values in each group. The statistical threshold was set atP⬍.05, with a family-wise correction. Independent 2-samplettests were also performed on the basis of the individual DC maps to examine the differences in DC between groups. Age, sex, years of education, and head mo-tion (mean frame-wise displacement) were included as covariates. To further exclude the confounding effects of small-vessel disease, we also controlled for the WM lesion score and the existence of hypertension during the comparison. ThePuncorrectedvalue was set at .01, with a cluster size of 30 voxels (determined via Monte Carlo simulation) corresponding to aPcorrectedof .05.
Seed-Based FC Analyses
The identified brain regions with altered DC were chosen as the seeds to examine their FC changes. The time-series of each region was averaged and correlated with that of every other voxel within the GM mask. Correlation coefficients between the seed and every other voxel were then converted by using the Fisherr-to-z trans-form, yielding variates that were approximately normally distrib-uted. One-samplettests were performed on the individual z-transformed FC maps in each group to identify the spatial distribution of each brain circuit (P⬍.05 with family-wise error correction). Voxelwise group comparisons on each z-trans-formed FC map were then perz-trans-formed, which were confined to a mask obtained by combining the results of the within-group anal-yses in each group. Statistical significance was determined on the basis ofPuncorrected⬍.01 andPcorrected⬍.05. The same covariates used during the DC analyses were included.
Statistical Analyses
Clinical Data. Statistical analyses were performed by using SPSS software (Version 18.0; IBM, Armonk, New York). Normal dis-tributions were tested by using the Kolmogorov-Smirnov test. Group comparisons of clinical parameters were explored by using independent 2-samplettests for normally distributed variables; the nonparametric Mann-WhitneyUtest, for asymmetrically distributed variables; and2tests, for categoric variables. AP valueⱕ.05 was considered statistically significant.
regression model by using the 3dLME command in AFNI. The FC maps and clinical variables in both groups were entered into the models along with age, sex, education, head motion, and small-vessel disease parameters as covariates of no interest. To identify the regions where the FC was differentially correlated with clinical variables in patients versus HCs, we focused on the group⫻ vari-able statistical interaction maps (Pcorrected⬍.05,Pvoxelwise⬍.01). Brain regions with significant interaction effects were consid-ered important in contributing to T2DM-related cognitive impairment.
RESULTS
Demographic and Clinical Parameters
All clinical parameters are summarized inTable 1. The 2 groups were matched in terms of age, sex, education, and their frame-wise displacement measurement. As expected, patients exhibited
significantly higher FPG, HbA1c, and homeostasis model assess-ment of insulin resistance values than the HCs. No differences were observed in blood pressure, lipid levels, or degree of small-vessel disease. Patients performed significantly worse on CFT de-lay and TMT-B than HCs (Table 2), which mainly involve visual memory and executive functioning domains. Among the dia-betes-related variables, disease duration was significantly cor-related with the scores in 2 tasks after controlling for age (CFT copy,R⫽ ⫺0.45,P⬍.01; CFT delay,R⫽ ⫺0.40,P⫽.02), while the HbA1c level was associated with the CFT copy score (R⫽ ⫺0.35,P⫽.02).
DC Results
Due to the highly consistent results of the weighted and binarized measurements, the present findings are primarily based on the weighted maps.
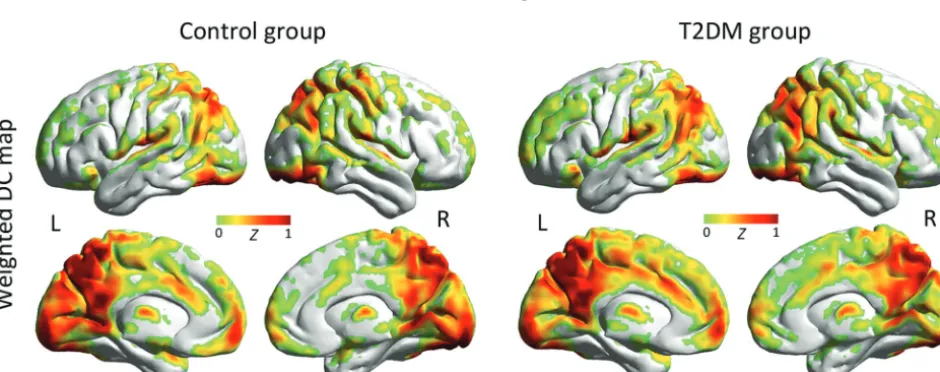
The spatial distribution of the weighted DC maps is shown in Fig 1. In both groups, the DC in the posterior cingulate cortex, cuneus, visual cortex, medial prefrontal cortex, and insula was significantly higher than the global mean value. The binarized map shows a similar pattern (On-line Fig 2).
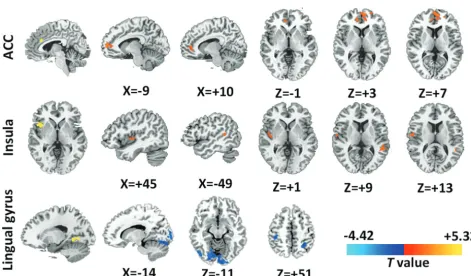
Patients with T2DM exhibited decreased DC in the left lingual gyrus and increased DC in the right anterior insula and dorsal anterior cingulate cortex (dACC) (Fig 2). The results shown in the binarized DC map are highly consistent with the results in the weighted map (On-line Fig 3). Detailed information for the iden-tified brain regions are summarized inTable 3and the On-line Table.
Seed-Based FC Analyses
The FC pattern of each region (ie, dACC, right anterior insula, and left lingual gyrus) is shown inFig 3. Specifically, the dACC was connected with the cingulate cortex, anterior insula, and sen-sorimotor cortex, while the right anterior insula was connected with the entire insula, dACC, and the adjacent frontal, temporal, and sensorimotor cortices. Meanwhile, the lingual gyrus was mainly connected with the visual cortex and the superior/middle temporal and sensorimotor cortices.
FIG 1.Spatial distribution of weighted DC maps in patients with T2DM and HCs (P⬍.05, family-wise error– corrected). In the weighted DC map, standardized DC in the posterior cingulate, visual cortex, medial prefrontal cortex, insula, and thalamus was significantly higher than the global mean values in both groups. Color scale denotes thezscore. R indicates right; L, left.
Table 2: Cognitive test results for the T2DM and control groupsa
Measures
T2DM (n= 40)
Control
(n= 43) PValue General cognitive status
MMSE 28.3⫾1.2 28.7⫾1.2 .26
Episodic memory
AVLT 5.9⫾1.3 6.3⫾1.8 .11
AVLT, delay 5.8⫾2.3 6.3⫾2.1 .31
CFT, delay 13.9⫾5.8 17.5⫾5.8 ⬍.01b
Working memory
DST (forward) 6.8⫾1.3 7.3⫾1.5 .11
DST (backward) 4.1⫾1.0 4.5⫾1.3 .16
Attention
TMT, part A 64.5⫾19.0 63.3⫾14.8 .76
Executive functioning
TMT, part B 182.2⫾62.8 152.0⫾50.6 .02b
Spatial processing
CFT, copy 34.3⫾1.8 34.8⫾1.5 .16
CDT 3.3⫾0.6 3.5⫾0.6 .07
Language processing
VFT 16.5⫾3.6 17.6⫾3.0 .52
Note:—MMSE indicates Mini-Mental State Examination; AVLT, Auditory Verbal Learning Test; DST, Digit Span Test; CDT, Clock Drawing Test; VFT, Verbal Fluency Test.
aData are represented as means. b
[image:4.594.58.528.512.698.2]In the subjects with diabetes, the dACC showed stronger con-nectivity with the bilateral ventral dorsal anterior cingulate cor-tex/medial prefrontal cortex (Fig 4, first row), while the right an-terior insula had increased interactions with the right posan-terior insula and left superior temporal gyrus (Fig 4, second row). In contrast, diffusely decreased connectivity was observed in the lin-gual gyrus–related visual network, especially in the higher order visual cortex and the sensory areas (Fig 4, third row).
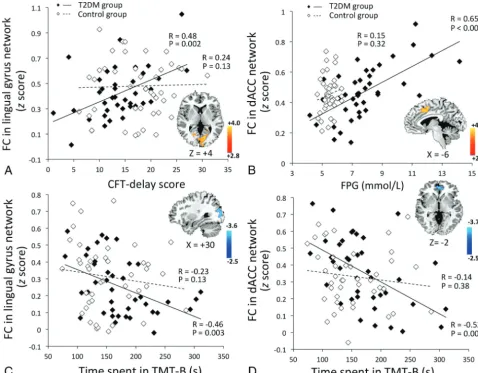
Voxelwise correlation analyses identified significant effects of the clinical variables on several brain regions in the T2DM group (Fig 5). The occipital connectivity was positively correlated with the CFT delay score (Fig 5A,R⫽0.48,P⫽.002; group⫻ perfor-mance interaction,P⫽.001) and negatively correlated with the time spent on the TMT-B (Fig 5C,R⫽ ⫺0.46,P⫽.003; group⫻ performance interaction,P⫽.87). The hyperconnectivity of the dACC was correlated with higher FPG levels (Fig 5B,R⫽0.65, P⬍.001; group⫻FPG interaction,P⫽.001) and better TMT-B performance (Fig 5D,R⫽ ⫺0.52,P⫽.001; group⫻performance interaction,P⫽.04). Due to the significant correlation between disease duration and neurocognitive performance, we further controlled for disease duration and reanalyzed the correlations. This reanalysis did not significantly affect our findings (data not shown). Similar effects were not detected in the HCs.
DISCUSSION
Using graph theory– based analyses, the present study provides the initial evidence of altered global connectivity in the brains of patients with T2DM. Patients showed decreased DC in the occip-ital region and increased DC in the higher order cognitive control regions. Seed-based analytic approaches revealed that the brain FIG 2. Group differences of weighted DC maps between patients
with T2DM and HCs (P⬍.05; AlphaSim-corrected; https://afni. nimh.nih.gov/pub/dist/doc/program_help/AlphaSim.html). In the weighted DC map, patients with T2DM showed significantly de-creased value (cool color) in the left lingual gyrus and inde-creased values (warm color) in the dACC and the right anterior insula. The color scale denotes thet-value.
FIG 3. Spatial pattern of the network anchored in the regions with altered DC (P⬍.05, family-wise error– corrected). The dACC and right anterior insula (AI) exhibit similar connectivity patterns, which are largely included in the salience network. Specifically, the dACC is connected to the cingulate cortex, anterior insula, and sensorimotor cortex (first row). The AI is functionally connected to the entire insula, dACC, and adjacent frontal, temporal, and sensorimotor areas (second row). The lingual gyrus is mainly connected to the visual cortex and superior middle temporal and sensorimotor cortices (third row). The color scale denotes thet-value.
Table 3: Brain regions with significant differences in weighted DC maps between patients with T2DM and HCsa
Brain Regions
MNI
Voxels Peakt-Value
X Y Z
RAI ⫹42 ⫹15 ⫹0 51 ⫹4.30
dACC ⫹6 ⫹30 ⫹24 31 ⫹4.03
L lingual gyrus ⫺15 ⫺51 ⫺3 37 ⫺3.51
Note:—MNI indicates Montreal Neurological Institute; RAI, right anterior insula; L, left.
aComparisons were performed atP⬍.05, corrected by AlphaSim multiple
circuits anchored in these regions were also affected, which was correlated with altered neurocognitive performance, suggesting that brain connectivity might be a potential imaging marker for T2DM-associated cognitive impairment.
Decreased DC and within-network connectivity were ob-served in the lingual gyrus. Consistent with these results, previous imaging studies on patients with T2DM have also reported occip-ital alterations. For example, the occipoccip-ital lobe has been shown to have not only impaired cerebrovascular reactivity but also de-creased overall volume.26,27Studies on a similar diabetic popula-tion also reported a decrease in neural intensity and coherence around the lingual gyrus.28,29The lingual gyrus and its associated occipital regions are linked to processing vision-related informa-tion and encoding visual memories.30Given the positive correla-tions of occipital connectivity with visual memory and executive performance demonstrated in the current results, we suggest that decreased occipital connectivity might play an important role in the reduced performance in vision-dependent tasks in patients with T2DM. However, due to the small sample size and the lack of visual measurements, it is difficult to determine whether the hy-poconnectivity is a neural alteration before or is a reflection of reduced visual input induced by potential diabetic retinopathy. Future studies are warranted to clarify the underlying neuropa-thology of these findings.
In the T2DM group, increased DC was observed in 2 critical brain hubs, the right anterior insula and dACC. Moreover, the connectivity of the networks anchored in these 2 regions was also
elevated. The right anterior insula and dACC have strong recip-rocal connectivity, forming the core of the salience network, which facilitates higher order cognitive control and behavioral adaption via the “bottom-up” signal detection and the “top-down” transmission of control signals.31 Although cognitive functions are often affected in patients with T2DM, the effect sizes are smaller in middle-aged adults compared with the effects in those older than 65 years.2 This finding is probably due to a greater brain reserve capacity in younger subjects, reflected by an increased neuronal interconnection.32Moreover, longer diabetes duration in elder patients is often associated with a higher preva-lence and severity of diabetic complications and comorbidities, which may further contribute to the worsening of cognitive func-tion. Therefore, the increased connectivity in hub regions proba-bly represents a compensatory mechanism in the younger diabetic population, in cases in which more neural resources were re-quired to successfully accomplish relevant tasks. Our results showing a significant correlation between dACC hyperconnectiv-ity and executive performance in the TMT-B task may also sup-port such an assumption. However, whether this compensatory role ceases to be effective in elderly populations needs to be exam-ined in future studies.
[image:6.594.53.524.63.339.2]ory– based approach adopted in the current study takes into ac-count the entire functional connectome instead of relying on a priori seeds or blind source separation.13The discrepancies in the methods used and the brain regions observed might be the cause of the differences in the findings between the current study and previous studies. In addition, our results suggest more prom-inent alterations in the occipital and salience network–related regions in relation to whole-brain functional interactions. Nevertheless, such results remain to be confirmed by future studies with a larger sample size.
As in many cross-sectional clinical studies, the current study has several limitations in addition to the relatively small sample size. First, the medications and the duration of diabetes of the included patients were quite variable, which could exert con-founding effects on the DC measurement. Treatment-naive pa-tients from a narrower disease-duration range should be recruited in future studies. Second, we did not adjust for visual acuity dur-ing the vision-dependent cognitive tasks. The inclusion of such measurements is crucial for understanding potential impairment
of occipital connectivity, and this should be considered in future studies. Third, a questionnaire was used to confirm the state of the subjects during MR imaging. More objective and rigorous meth-ods, such as visual fixation on a screen, should be performed to avoid such confounding effects. Finally, other FC measurements, such as dynamic and Granger causality connectivity, should be included to obtain more comprehensive information about the network changes in patients with T2DM.
CONCLUSIONS
[image:7.594.53.532.47.420.2]decline in T2DM and may provide valuable insight into the neu-ropathologic process of T2DM-related brain alterations.
ACKNOWLEDGMENTS
We thank Shaohua Wang and Dr Wenqing Xia, Department of Endocrinology, Affiliated Zhongda Hospital of Southeast Univer-sity, for their assistance with the data collection.
Disclosures: Yihong Yang—RELATED:Other: Intramural Research Program of the National Institute on Drug Abuse,Comments: Yihong Yang is an employee of the Intramural Research Program of the National Institute on Drug Abuse, the National Institutes of Health.
REFERENCES
1. Geijselaers SL, Sep SJ, Stehouwer CD, et al.Glucose regulation, cog-nition, and brain MRI in type 2 diabetes: a systematic review.Lancet Diabetes Endocrinol2015;3:75– 89CrossRef Medline
2. Biessels GJ, Deary IJ, Ryan CM.Cognition and diabetes: a lifespan perspective.Lancet Neurol2008;7:184 –90CrossRef Medline
3. Roberts RO, Knopman DS, Przybelski SA, et al.Association of type 2 diabetes with brain atrophy and cognitive impairment.Neurology
2014;82:1132– 41CrossRef Medline
4. van den Heuvel MP, Hulshoff Pol HE.Exploring the brain network: a review on resting-state fMRI functional connectivity.Eur Neuro-psychopharmacol2010;20:519 –34CrossRef Medline
5. Sheline YI, Raichle ME.Resting state functional connectivity in preclinical Alzheimer’s disease. Biol Psychiatry 2013;74:340 – 47
CrossRef Medline
6. Zhou H, Lu W, Shi Y, et al.Impairments in cognition and resting-state connectivity of the hippocampus in elderly subjects with type 2 diabetes.Neurosci Lett2010;473:5–10CrossRef Medline
7. Chen YC, Xia W, Qian C, et al.Thalamic resting-state functional connectivity: disruption in patients with type 2 diabetes.Metab Brain Dis2015;30:1227–36CrossRef Medline
8. Musen G, Jacobson AM, Bolo NR, et al.Resting-state brain func-tional connectivity is altered in type 2 diabetes.Diabetes2012;61: 2375–79CrossRef Medline
9. Hoogenboom WS, Marder TJ, Flores VL, et al.Cerebral white matter integrity and resting-state functional connectivity in middle-aged patients with type 2 diabetes.Diabetes2014;63:728 –38CrossRef Medline
10. Cui Y, Jiao Y, Chen HJ, et al.Aberrant functional connectivity of default-mode network in type 2 diabetes patients.Eur Radiol2015; 25:3238 – 46CrossRef Medline
11. Xia W, Wang S, Rao H, et al.Disrupted resting-state attentional networks in T2DM patients.Sci Rep2015;5:11148CrossRef Medline
12. Nelson PT, Smith CD, Abner EA, et al.Human cerebral neuropa-thology of type 2 diabetes mellitus.Biochim Biophys Acta2009;1792: 454 – 69CrossRef Medline
13. Zuo XN, Ehmke R, Mennes M, et al.Network centrality in the human functional connectome. Cereb Cortex2012;22:1862–75
CrossRef Medline
14. Liang X, Zou Q, He Y, et al.Coupling of functional connectivity and regional cerebral blood flow reveals a physiological basis for net-work hubs of the human brain.Proc Natl Acad Sci U S A2013;110: 1929 –34CrossRef Medline
15. Buckner RL, Sepulcre J, Talukdar T, et al.Cortical hubs revealed by intrinsic functional connectivity: mapping, assessment of stability,
and relation to Alzheimer’s disease.J Neurosci2009;29:1860 –73
CrossRef Medline
16. Di Martino A, Zuo XN, Kelly C, et al.Shared and distinct intrinsic functional network centrality in autism and attention-deficit/hy-peractivity disorder. Biol Psychiatry 2013;74:623–32 CrossRef Medline
17. Rubinov M, Knock SA, Stam CJ, et al.Small-world properties of nonlinear brain activity in schizophrenia.Hum Brain Mapp2009; 30:403–16CrossRef Medline
18. Galea M, Woodward M.Mini-Mental State Examination (MMSE). Aust J Physiother2005;51:198CrossRef Medline
19. Hamilton M.A rating scale for depression.J Neurol Neurosurg Psy-chiatry1960;23:56 – 62CrossRef Medline
20. American Diabetes Association.Diagnosis and classification of dia-betes mellitus. Diabetes Care 2014;37(suppl 1):S81–90 CrossRef Medline
21. van den Berg E, Reijmer YD, de Bresser J, et al; Utrecht Diabetic Encephalopathy Study Group.A 4 year follow-up study of cognitive functioning in patients with type 2 diabetes mellitus.Diabetologia
2010;53:58 – 65CrossRef Medline
22. Matthews DR, Hosker JP, Rudenski AS, et al.Homeostasis model assessment: insulin resistance and beta-cell function from fasting plasma glucose and insulin concentrations in man.Diabetologia
1985;28:412–19CrossRef Medline
23. Wahlund LO, Barkhof F, Fazekas F, et al; European Task Force on Age-Related White Matter Changes.A new rating scale for age-re-lated white matter changes applicable to MRI and CT.Stroke2001; 32:1318 –22CrossRef Medline
24. Jenkinson M, Bannister P, Brady M, et al.Improved optimization for the robust and accurate linear registration and motion correction of brain images.Neuroimage2002;17:825– 41CrossRef Medline
25. Cox RW.AFNI: software for analysis and visualization of func-tional magnetic resonance neuroimages.Comput Biomed Res1996; 29:162–73CrossRef Medline
26. Tchistiakova E, Anderson ND, Greenwood CE, et al.Combined ef-fects of type 2 diabetes and hypertension associated with cortical thinning and impaired cerebrovascular reactivity relative to hy-pertension alone in older adults.Neuroimage Clin2014;5:36 – 41
CrossRef Medline
27. Espeland MA, Bryan RN, Goveas JS, et al; WHIMS-MRI Study Group.Influence of type 2 diabetes on brain volumes and changes in brain volumes: results from the women’s health initiative magnetic resonance imaging studies. Diabetes Care 2013;36: 90 –97CrossRef Medline
28. Cui Y, Jiao Y, Chen YC, et al.Altered spontaneous brain activity in type 2 diabetes: a resting-state functional MRI study.Diabetes2014; 63:749 – 60CrossRef
29. Chen YC, Jiao Y, Cui Y, et al.Aberrant brain functional connectivity related to insulin resistance in type 2 diabetes: a resting-state fMRI study.Diabetes Care2014;37:1689 –96CrossRef Medline
30. Machielsen WC, Rombouts SA, Barkhof F, et al.FMRI of visual encoding: reproducibility of activation.Hum Brain Mapp2000;9: 156 – 64Medline
31. Ham T, Leff A, de Boissezon X, et al.Cognitive control and the sa-lience network: an investigation of error processing and effective connectivity.J Neurosci2013;33:7091–98CrossRef Medline