University of Warwick institutional repository: http://go.warwick.ac.uk/wrap
This paper is made available online in accordance with publisher policies. Please scroll down to view the document itself. Please refer to the repository record for this item and our policy information available from the repository home page for further information.
To see the final version of this paper please visit the publisher’s website. Access to the published version may require a subscription.
Author(s): G. Nisbet, C.L.A. Lamont, M. Polcik, R. Terborg, D.I. Sayago, J.T. Hoeft, M. Kittel, R.L. Toomes and D.P. Woodruff Article Title: Structural analysis of Pt(1 1 1)c(√3 × 5)rect.–CO using photoelectron diffraction
Year of publication: 2007 Link to published version:
http://dx.doi.org/10.1016/j.susc.2006.12.073
Structural analysis of Pt(111)-c(3 x 5)rect-CO using photoelectron
diffraction
G. Nisbet1, C.L.A. Lamont1*,M. Polcik2, R. Terborg2, D.I. Sayago2, J.T. Hoeft2, M. Kittel2, R.L. Toomes3 and D.P. Woodruff3,
1
Dept. of Chemical & Biological Sciences, University of Huddersfield, Queensgate,
Huddersfield HD1 3DH, UK
2
Fritz-Haber-Institut der Max-Planck-Gesellschaft, Faradayweg 4-6, 14195 Berlin,
Germany 3
Physics Dept, University of Warwick, Coventry CV4 7AL, UK
Abstract
Core level shift scanned-energy mode photoelectron diffraction using the two distinct components of the C 1s emission has been used to determine the structure of the Pt(111)c(√35)rect.-CO phase formed by 0.6 ML of adsorbed CO. The results confirm earlier assignments of these components to CO in atop and bridging sites, further confirm that the best structural model involves a 2:1 occupation ratio of these two sites, and provides quantitative structural parameter values. In particular the Pt-C chemisorption bondlengths for the atop and bridging sites are, respectively, 1.860.02 Å and 2.020.04 Å. These values are closely similar to those found in the 0.5 ML coverage c(4x2) phase, involving an atop:bridge occupation ratio of 1:1, obtained in earlier quantitative low energy electron diffraction studies. The results also indicate a clear tilt of the molecular axis of atop CO species in this compression phase, consistent with the finding of an earlier electron-stimulated desorption ion angular distribution investigation.
1. Introduction
The interaction of CO with Pt surfaces is one of the most studied problems in surface science, in part as a ‘simple’ model system of chemisorption, and in part because of the relevance of the system to CO oxidation catalysis. The structural aspects of CO adsorption on transition metals in general is surprisingly complex, indicating subtle variations with material, crystal face and coverage. Typically CO occupies either atop (one-fold coordinated), bridge (two-fold coordinated) or hollow (three-fold of four-fold coordinated) adsorption sites, but the preferred site at low coverage differs on different surfaces and may change with increasing coverage. Early qualitative LEED (low energy electron diffraction) observations of CO adsorption on Pt(111) show a whole sequence of different ordered phases with increasing coverage [1], with the higher coverage phases showing apparent continuous variation in unit mesh dimensions consistent with a uniaxial compression of the overlayer. Initially, such LEED patterns in other systems were interpreted in terms of a ‘floating’ overlayer which at intermediate coverages was incommensurate with the substrate [2] (implying an infinite variety of local adsorption sites). This picture, however, was revised largely as a consequence of the interpretation of the results of vibrational spectroscopic studies using electron energy loss spectroscopy (EELS) and reflection-absorption infra-red spectroscopy (RAIRS).
c(√35)rect., and the 0.67 ML c(√33)rect. phases as proposed by Persson et al. [13]. In going from 0.5 ML to 0.6 ML the number of atop CO molecules has been increased to produce the zig-zag row of atop species in the c(√35)rect. phase, and the spacing of these dense zig-zag rows then decreases with increasing coverage. By increasing the density of atop species in these rows, and varying their spacing, a large sequence of different structural phases can be formed, and fluctuations in the spacing of these atop chains can lead to intermediate average periodicities as sampled by the LEED pattern. Notice that the near-neighbour occupation of the atop sites in the dense rows may be expected to lead to a tilt of the C-O axes for these molecules due to intermolecular repulsion, as shown schematically in fig. 1.
Here we should note that adsorption site identification on the basis of vibrational spectroscopy has not always proved to be consistent with true quantitative structural methods; in particular, 0.5 ML c(4x2) phases of CO on both Ni(111) and Pd(111) were widely believed to involve pure bridge site occupation on the basis of the measured value of the C-O stretching frequency, whereas subsequent structure determinations for Ni(111) using PhD (scanned-energy mode photoelectron diffraction) [14, 15] and quantitative LEED [16], and for Pd(111) using PhD [17], have shown that the true structure in both cases involves only three-fold coordinate hollow site occupation. For Pt(111)/CO, however, the two distinct vibrational absorption bands at frequencies entirely consistent with the atop and bridge assignments seems far less open to doubt, but even more importantly, quantitative LEED structure determinations [18,19] of the 0.5 ML c(4x2) phase in this case have provided clear confirmation of the structure shown in fig. 1 in which 0.25 ML of CO molecules occupy atop sites while a further 0.25 ML CO occupy bridge sites. A detailed STM (scanning tunnelling microscopy) investigation of this phase that also included full theoretical modelling of the images also clearly favoured this structural model for the c(4x2) phase over alternative models based on other mixtures of atop, hollow and bridge sites [20].
higher coverage ‘compression’ phases, they do not provide a secure basis for determining the relative occupation of these two sites at different coverages. This is because the relative intensities of the absorption bands can be influenced by a range of vibrational coupling effects in addition to the number of contributing molecules. Core level (X-ray) photoelectron spectroscopy (XPS), on the other hand, does show a clear linear relationship between photoemission intensity and coverage, and both C 1s and O 1s XPS signals from CO on Pt(111) show clear ‘chemical’ shifts in the photoelectron binding energies between emission from molecules in the atop and bridge sites. These spectra show clearly that the c(4x2) phase does correspond to equal occupation of the two distinct local sites, while at higher coverages an increasing fraction of atop sites are occupied [21].
The Pt(111)/CO system has also been subjected to many theoretical studies, including several using what are generally regarded as the most sophisticated and reliable methodologies in density functional theory (DFT) slab calculations. However, these calculations have revealed a systematic failure to correctly determine the energetically-preferred adsorption site at low coverage, such calculations consistently favouring hollow sites rather than the atop site seen in experiments [22]. Several recent publications have explored the origins of this effect and claimed to overcome this problem (e.g. [23, 24, 25, 26, 27]), but there seems to be no general acceptance of a satisfactory solution. In view of this it is unclear whether such methods yield meaningful results for the more complex Pt(111)/CO structural phases at high coverages, although calculations constrained to the experimentally-determined adsorption sites may be expected to still give the correct optimised geometry for these sites. There appears to be one such calculation for the c(4x2) phase [28].
surrounding atoms. This interference leads to modulations in the detected intensity as a function of the direction or photoelectron energy (and thus photoelectron wavelength), due to changes in the relative phase of different scattering paths. By working at relatively low photoelectron energies (~100-400 eV), backscattering from the substrate atoms is strong and dominates the detected diffraction modulations. The technique provides local
structural information about the (adsorbate) emitter atom that is intrinsically element-specific, but also chemical-state specific through changes in the photoelectron binding energy. In the Pt(111)/CO case it is therefore possible to obtain essentially independent local structural information on the bridge and atop CO species by measuring the photoelectron diffraction from each CLS component of the C 1s or O 1s photoemission. In this respect the method is significantly more incisive than the ‘benchmark’ surface structural technique of quantitative LEED. In fact, this chemical-state-specificity of photoelectron diffraction has already been exploited by Bondino et al. [30] using measurements of the polar and azimuthal angle dependence of the C 1s emission to provide an independent determination of the local structure of the c(4x2) phase. Notice that this study also provided positive identification of the origin of the two C 1s components that had previously relied only on spectral fingerprinting. The results of the CLS photoelectron diffraction study are in generally good agreement with those of the quantitative LEED studies, although there do appear to be slight but significant differences in the structural parameters (notably the Pt-CO bondlengths) obtained.
an independent test of the proposal, based on ESDIAD (electron-stimulated desorption ion angular distribution) data [31], and favoured by various theoretical treatments (e.g. [13, 32]), that the higher coverage (>0.5 ML) phase involves tilting of the C-O axes away from the surface normal. In addition, we seek to distinguish different models that have been proposed of the long-range ordering of the atop and bridge species in the c(√35)rect. unit mesh. While the PhD technique is primarily sensitive to the local
structure, scattering by near-neighbour adsorbates can provide some sensitivity to the long-range ordering model.
2. Experimental Details
C 1s PhD spectra were recorded in the photoelectron kinetic energy range of 68 - 372 eV, at 3 eV intervals in photon energy, at polar emission angles between 0° and 60° from the surface normal in the [110], [121] and [211] azimuths. At each step in the photon energy an energy distribution curve (EDC) around the C 1s peak was recorded covering a kinetic energy window of 28 eV. The analyser pass energy and step size were chosen such that the two C 1s peaks could be clearly resolved, while also giving a satisfactory signal-to-noise ratio. It should be noted that although Pt Auger peaks are present in the background over the chosen energy range, the fact that they are much broader than the C 1s peaks means that so long as each EDC has been measured over a suitably wide energy window, the normalisation procedures which are applied in the analysis allow the contribution of
these Auger peaks to be separated from the photoemission peaks. To extract the PhD
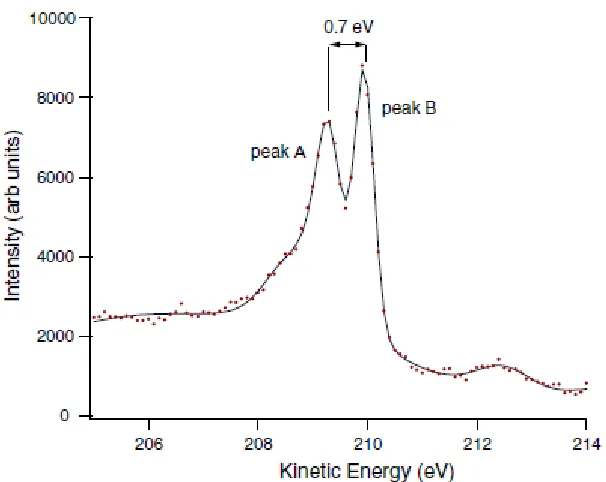
modulation spectra, each EDC was first fitted by a sum of two Gaussian peaks and two associated background steps. The integrated area of each component peak was then plotted as a function of kinetic energy, I(E). A stiff spline function, I0(E), through these
data was then subtracted and the resulting function was divided by the spline function, to yield the PhD modulation spectrum (E)=(I(E)-I0E)/I0(E). Notice that the presence of the
shoulder on the lower kinetic energy C 1s peak meant that this component was relatively poorly described by a Gaussian peak. Additional fits were therefore tested using three component peaks, the third component fitting this shoulder. The resulting PhD spectra showed that the shoulder displayed the modulations of the main low energy peak and these were quite different from those of the higher energy peak. This clearly confirms that the shoulder is associated with the same emitter atoms as the main low energy peak. These tests also indicated that the PhD spectra for the lower energy peak were largely independent of the method of peak fitting used.
3. Results and structure determination
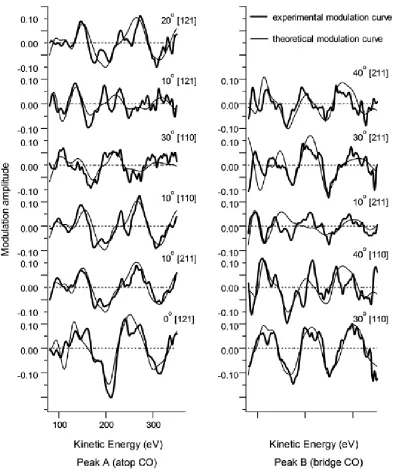
selected to provide a reasonable range of emission directions, but also focussed on those showing the largest modulation amplitudes. It is the spectra with the largest amplitudes that are expected to be most accurately represented by the multiple scattering simulations, and typically these correspond to emission directions that place a substrate scatterer atom almost directly behind the emitter relative to the detector, giving the favoured 180° scattering geometry. For this reason we expect the largest modulations to occur in different emission directions for the atop and bridge species, and indeed it is notable that the PhD spectra from the low energy peak show the strongest near-single-period modulations at normal emission, consistent with an atop site, while those from the higher energy peak show the strongest modulations at an emission angle of ~30-40° in the [110] azimuth, consistent with a bridge-site emitter. In general, however, all the modulations are rather weak, typically being only ~10% even in these directions. More typically, in PhD, one may obtain modulations of ~40% of more for high-symmetry adsorption sites. The reason for these weak modulations is attributable to the special scattering characteristics of Pt atoms that show a broad minimum in the backscattering cross-section in the energy range relevant to these measurements. This same effect is well-known in EXAFS and leads to similar problems of unusually weak modulations.
In order to extract the structure from these measurements, multiple scattering curved-wave calculations must be performed for a range of trial structures, using a computer code developed by Fritzsche [34, 35]. This theoretical formulation is based on a magnetic quantum number expansion and takes into account the finite acceptance angle of the detector (5) and the energy resolution of the experiment (5eV). These factors help to reduce the importance of longer scattering pathways, and ensure that fourth and higher order scattering events can largely be ignored. To quantify the agreement between the theoretical and experimental modulation functions a reliability factor, Rm is calculated
m i i i th m i i i th m R 1 exp 1 2 exp 2 2 exp is the experimental modulation curve, while th is the theoretical modulation curve. Rm is the normalised sum of the squares of the differences between exp and th and
should be as close to zero as possible. Typically, in a range of structural studies using this approach, values in the range ~0.1-0.3 have been found to be achievable, although the weak modulations found in the present system might lead us to expect the best fits here to be in the upper end of this range.
-factor values, defined as var(Rmin)= Rmin √(2/N), where N is a measure of the number of
independent pieces of information in the experimental data defined and discussed elsewhere [36]. For the low kinetic energy component the resulting variance is 0.058, while for the high energy component it is 0.056. We may reject any solution that has an
R-factor value greater that Rmin+var(Rmin), which, as may be seen from Table 1, clearly
excludes any of the other adsorption sites.
A second stage of structural refinement was then undertaken in which relaxation of individual atoms in the outermost Pt layer perpendicular to the surface, and tilting of the C-O axis relative to the surface normal (in the azimuth found in the ESDIAD experimental study). In addition, three different models of the possible ordering of the atop and bridge CO species, shown in fig. 4, were considered. (a) is the model proposed by Persson et al. [13] as shown in fig. 1, while (b) is the model suggested by Avery in an early EELS publication [6], which shows denser atop chains and more widely-spacing CO molecules in bridging sites. Notice, though, that model (b) strictly has (√35)rect.
of the component intensities of individual EDCs will not provide a reliable measure of the relative occupation, but an average of many such measurements will. We also find an atop:bridge ratio of approximately 2.
Distinguishing models (a) and (b) of fig. 4 is more difficult using PhD, because the main difference is the number of atop neighbours (all of the same separation) in the atop chains, and the extent to which the bridge CO molecules do, or do not, have atop CO molecules as near neighbours. The two models also differ in the number of CO molecules expected to tilt, but the magnitude of the tilt angles is unknown in both models. In fact the optimisation of the structures of these two models does lead to slightly lower R-factor values for model (a) to model (b). The global R-factors (summing over both the atop and bridge PhD spectra) are 0.24 and 0.26 respectively, but with a variance in the minimum of 0.03 this difference is not formally significant. However, for the bridge site PhD spectra alone the R-factors for the (a) and (b) models are 0.25 and 0.31 respectively, with a variance in Rmin of 0.05, rendering the difference just significant. The R-factor for the
atop C 1s PhD spectra is also lower (0.19) for model (a) than for model (b) (0.22) although in this case this difference falls just within the variance. Bearing in mind that we may expect the bridge site CO emitters to be more sensitive to the difference in these models (with or without atop CO neighbours) we therefore conclude that model (a) is the preferred structure. Of course, the fact that the two LEED patterns should be different is also a further factor, beyond the PhD analysis, which favours model (a).
shows a tilt angle of 6°, and the desorption of this species is believed to be dominated by the contribution from the atop species; the ESDIAD data thus provide no information on any possible tilt of the bridging CO species. Table 2 also shows that the structural parameters obtained in the DFT calculations for the c(4x2) structure and, for the atop CO tilt angle, for a hypothetical (√3x3) structure. Clearly the bondlengths found in these DFT calculations agree well with the LEED data and our results, consistent with the notion that the failure in DFT for this system is in determining the relative energy of the atop and hollow sites, but not the associated optimised geometries.
4. Conclusions
Our CLS PhD investigation of the structure of the Pt(111)c(√35)rect.-CO phase formed by 0.6 ML of adsorbed CO provides clear support for the mixed atop + bridging site model, based on a 2:1 occupation ratio, previously proposed on the basis of the observed LEED patterns and vibrational spectroscopic data [13]. It also provides clear support for the previously assumed assignment of the chemically-shifted components of the C 1s photoemission spectrum. Consideration of three alternative models of the arrangement of the atop and bridge CO molecules within the unit mesh leads to a clear preference for the model mentioned above, in part based on the PhD data. The local structural parameters, notable the Pt-C chemisorption bond lengths found in this analysis are entirely consistent with the values obtained in LEED studies of the 0.5 ML c(2x4) phase, but highlight a slight numerical discrepancy of these two sets of results with an earlier CLS photoelectron diffraction study of the c(4x2) phase based an angle-scan data. The PhD results also indicate a clear tilt of the atop CO molecular axes in this compression phase, consistent with the finding of an earlier ESDIAD investigation.
Acknowledgements
Table 1
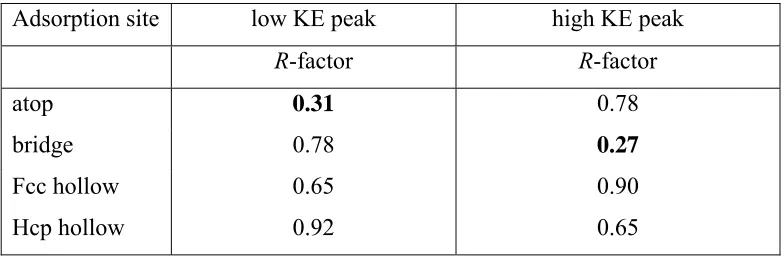
Summary of lowest R-factor values found in the first-order structure analysis for each of the different possible high-symmetry local adsorption sites for the PhD spectra from the two C 1s chemically-shifted components
Adsorption site low KE peak high KE peak
R-factor R-factor
atop 0.31 0.78
bridge 0.78 0.27
Fcc hollow 0.65 0.90
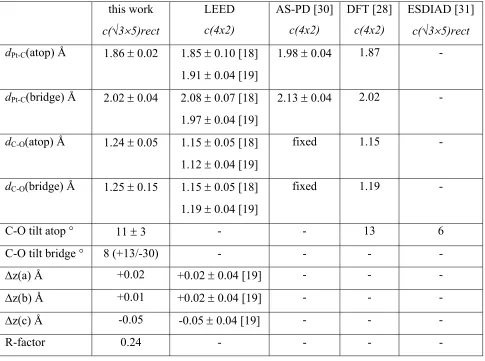
Table 2
Summary of structural parameter values for the best-fit structure (fig. 4(a)) found in this CLS PhD study of the Pt(111)c(√35)rect.-CO phase compared with values for the LEED and angle-scan photoelectron diffraction (AS-PD) investigations of the Pt(111)c(4x2)-CO phase and the tilt angle found for the high coverage phases in ESDIAD. z(a) is the outward relaxation of the outermost Pt atoms labelled a (directly below the atop CO) in fig. 4(a), z(b) is the same parameter for the b atoms of this fig (Pt atoms bonding to the bridging CO) and z(c) is the same parameter for the c atoms of this fig (Pt atoms not bonded to CO)
this work
c(√35)rect
LEED c(4x2) AS-PD [30] c(4x2) DFT [28] c(4x2) ESDIAD [31]
c(√35)rect
dPt-C(atop) Å 1.86 0.02 1.85 0.10 [18]
1.91 0.04 [19]
1.98 0.04 1.87 -
dPt-C(bridge) Å 2.02 0.04 2.08 0.07 [18]
1.97 0.04 [19]
2.13 0.04 2.02 -
dC-O(atop) Å 1.24 0.05 1.15 0.05 [18]
1.12 0.04 [19]
fixed 1.15 -
dC-O(bridge) Å 1.25 0.15 1.15 0.05 [18]
1.19 0.04 [19]
fixed 1.19 -
C-O tilt atop ° 11 3 - - 13 6
C-O tilt bridge ° 8 (+13/-30) - - - -
z(a) Å +0.02 +0.02 0.04 [19] - - -
z(b) Å +0.01 +0.02 0.04 [19] - - -
z(c) Å -0.05 -0.05 0.04 [19] - - -
Figure Captions
References
[1] G. Ertl, M. Neumann and K.M. Streit, Surf. Sci. 64 (1977) 393. [2] J.C. Tracey and P.W. Palmberg, J. Chem. Phys. 51 (1969) 4852.
[3] N. Sheppard and N.T. Nguyen, Adv. IR Raman Spectrosc. 5 (1978) 67.
[4] H. Froitzheim, H. Hopster, H. Ibach and S. Lehwald, Appl. Phys. 13 (1977) 147. [5] A.M. Baró and H. Ibach, J. Chem. Phys. 71 (1979) 4812.
[6] N. Avery, J. Chem. Phys. 74 (1981) 4202.
[7] H. Steininger, S. Lehwald and H. Ibach, Surf. Sci. 123 (1982) 264. [8] H.-J. Krebs and H. Lüth, Appl. Phys. 14 (1977) 337.
[9] B.E. Hayden and A.M. Bradshaw, Surf. Sci. 125 (1983) 787.
[10] E. Schweizer, B.N.J. Persson, M. Tüschaus, D. Hoge and A.M. Bradshaw, Surf. Sci. 213 (1989) 49.
[11] J.P. Biberian and M.A. Van Hove, Surf. Sci. 138 (1984) 361.
[12] P. Uvdal, P.-A. Karlsson, C. Nyberg, S. Andersson and N.V. Richardson, Surf. Sci. 202 (1988) 167.
[13] B.N.J. Persson, M. Tüschaus and A.M. Bradshaw, J. Chem. Phys. 92 (1990) 5034. [14] K.–M. Schindler, Ph. Hofmann, K.–U. Weiss, R. Dippel, V. Fritzsche, A. M. Bradshaw, D. P. Woodruff, M.E. Davila, M.C. Asensio, J.C. Conesa and A.R. González-Elipe, J. Electr. Spectros .Rel. Phenom. 64/65 (1993) 75.
[15] M.E. Davila, M.C. Asensio, D.P. Woodruff, K.–M. Schindler, Ph. Hofmann, K.–U. Weiss, R. Dippel, P. Gardner, V. Fritzsche, A.M. Bradshaw, J.C. Conesa and A.R. González-Elipe, Surf. Sci. 311 (1994) 337.
[16] L.D. Mapledoram, M.P. Bessent, A.D. Wander and D.A. King, Chem. Phys. Lett. 228 (1994) 527.
[17] T. Gieel, O. Schaff, C.J. Hirschmugl, V. Fernandez, K.-M. Schindler, A. Theobald, S. Bao, W. Berndt, A.M. Bradshaw, C. Baddeley, A.F. Lee, R.M. Lambert and D.P. Woodruff, Surf. Sci. 406 (1998) 90.
[18] D.F. Ogletree, M.A. Van Hove and G.A. Somorjai, Surf. Sci. 173 (1986) 351. [19] I. Zsada and M.A. Van Hove, Surf. Rev. Lett. 7 (2000) 15.
Besenbacher, Chem. Phys. Lett. 299 (1999) 403.
[21] O. Bjorneholm, A. Nilsson, H. Tillborg, P. Bennich, A. Sandell, B. Hernnas, C. Puglia and N. Martensson, Surf. Sci. 315 (1994) L983.
[22] P.J. Feibelman, B. Hammer, J.K. Nørskov, F. Wagner, M. Scheffler, R. Stumpf, R. Watwe and J. Dumesic, J. Phys. Chem. B 105 (2001) 4018.
[23] H. Orita, N. Itoh and Y. Inada, Chem Phys. Lett. 384 (2004) 271. [24] K. Doll, Surf. Sci. 573 (2004) 464.
[25] A. Gil, A. Clotet, J.M. Ricart, G. Kresse, M. Garcia-Hernández, N. Rösch and P. Sautet, Surf. Sci. 530 (2003) 71.
[26] G. Kresse, A. Gil and P. Sautet, Phys. Rev. B 68 (2003) 073401. [27] L. Köhler and G. Kresse, Phys. Rev. B 70 (2004) 165405.
[28] J.A. Steckel, A. Eichler and J. Hafner, Phys. Rev. B 68 (2003) 085416. [29] D.P. Woodruff and A.M. Bradshaw, Rep. Prog. Phys. 57 (1994) 1024.
[30] F. Bondino, G. Comelli, F. Esch, A. Locatelli, A. Baraldi, S. Lizzit, G. Paolucci and R. Rosei, Surf. Sci. Lett. 459 (2000) L467.
[31] M. Kiskinova, A. Szabo and J.T. Yates, Jr. Surf. Sci. 205 (1988) 215.
[32] J.S. McEwan, S.H. Payne, H.J. Kreuzer, M. Kinne, R. Denecke and H.P. Steinrück, Surf. Sci. 545 (2003) 47.
[33] K. J. S. Sawhney, F. Senf, M. Scheer, F. Schäfers, J. Bahrdt, A. Gaupp and W. Gudat, Nucl. Instrum. Methods A 390 (1997) 395.
[34] V. Fritzsche, Surf. Sci. 213 (1989) 648.
[35] V. Fritzsche, J. Phys. Condens. Matter 2 (1990) 1413.
[36] N.A. Booth, R. Davis, R. Toomes, D.P. Woodruff, C. Hirschmugl, K.-M. Schindler, O. Schaff, V. Fernandez, A. Theobald, Ph. Hofmann, R. Lindsay, T. Giessel, P. Baumgärtel and A. M. Bradshaw, Surf. Sci. 387 (1997) 152.