• No results found

Measurement of the inclusive isolated prompt photon cross section in pp collisions at √s=7 TeV with the ATLAS detector

N/A
N/A
Protected

Academic year: 2020

Share "Measurement of the inclusive isolated prompt photon cross section in pp collisions at √s=7 TeV with the ATLAS detector"

Copied!
32
0
0

Loading.... (view fulltext now)

Full text

(1)

University of Warwick institutional repository:

http://wrap.warwick.ac.uk

This paper is made available online in accordance with

publisher policies. Please scroll down to view the document

itself. Please refer to the repository record for this item and our

policy information available from the repository home page for

further information.

To see the final version of this paper please visit the publisher’s website.

Access to the published version may require a subscription.

Author(s): ATLAS Collaboration

Article Title: Measurement of the inclusive isolated prompt photon

cross section in pp collisions at sqrt[s]=7 TeV with the ATLAS detector

Year of publication: 2011

Link to published article:

http://dx.doi.org/10.1103/PhysRevD.83.052005

(2)

Measurement of the inclusive isolated prompt photon cross section in

pp

collisions

at

p

ffiffiffi

s

¼

7 TeV

with the ATLAS detector

G. Aadet al.* (ATLAS Collaboration)

(Received 20 December 2010; published 18 March 2011)

A measurement of the cross section for the inclusive production of isolated prompt photons in pp

collisions at a center-of-mass energypffiffiffis¼7 TeVis presented. The measurement covers the pseudor-apidity rangesjj<1:37and1:52 jj<1:81in the transverse energy range15E

T<100 GeV.

The results are based on an integrated luminosity of880 nb1, collected with the ATLAS detector at the

Large Hadron Collider. Photon candidates are identified by combining information from the calorimeters and from the inner tracker. Residual background in the selected sample is estimated from data based on the observed distribution of the transverse isolation energy in a narrow cone around the photon candidate. The results are compared to predictions from next-to-leading-order perturbative QCD calculations.

DOI:10.1103/PhysRevD.83.052005 PACS numbers: 14.70.Bh

I. INTRODUCTION

Prompt photon production at hadron colliders provides a handle for testing perturbative QCD (pQCD) predic-tions [1,2]. Photons provide a colorless probe of quarks in the hard partonic interaction and the subsequent parton-shower. Their production is directly sensitive to the gluon content of the proton through the qg!q process, which dominates at leading-order (LO). The measure-ment of the prompt photon production cross section can thus be exploited to constrain the gluon density function [3,4]. Furthermore, photon identification is important for many physics signatures, including searches for Higgs boson [5] and graviton decays [6] to photon pairs, decays of excited fermions [7], and decays of pairs of super-symmetric particles characterized by the production of two energetic photons and large missing transverse energy [8–10].

Prompt photons include both ‘‘direct’’ photons, which take part in the hard scattering subprocess (mostly quark-gluon Compton scattering, qg!q, or quark-antiquark annihilation, qq !g), and ‘‘fragmentation’’ photons, which are the result of the fragmentation of a high-pT

parton [11,12]. In this analysis, an isolation criterion is applied based on the amount of transverse energy inside a cone of radius R¼pffiffiffiffiffiffiffiffiffiffiffiffiffiffiffiffiffiffiffiffiffiffiffiffiffiffiffiffiffiffiffiffiffiffiffiffiffiffiffiffiffiffiffiffiffiffiffiffiffiffiðÞ2þ ðÞ2 ¼0:4 centered around the photon direction in the pseudorapidity () and azimuthal angle () plane [13]. After the isolation requirement is applied the relative contribution to the total cross section from fragmentation photons decreases, though it remains non-negligible especially at low

transverse energies [12]. The isolation requirement also significantly reduces the main background of nonprompt photon candidates from decays of energetic 0 and

mesons inside jets.

Early studies of prompt photon production were carried out at the ISR collider [14,15]. Subsequent studies, for example [16–18], further established prompt photons as a useful probe of parton interactions. More recent measure-ments at hadron colliders were performed at the Tevatron, in pp collisions at a center-of-mass energypffiffiffis¼1:96 TeV. The measurement by the D0 Collaboration [19] is based on 326 pb1and covers a pseudorapidity rangejj<0:9and

a transverse energy range23< ET<300 GeV, while the measurement by the CDF Collaboration [20] is based on 2:5 fb1 and covers a pseudorapidity range jj<1:0

and a transverse energy range30< ET<400 GeV. Both D0 and CDF measure an isolated prompt photon cross section in agreement with next-to-leading-order (NLO) pQCD calculations, with a slight excess seen in the CDF data between 30 and 50 GeV. Measurements of the inclusive prompt photon production cross section have also been performed in ep collisions, both in photoproduction and deep inelastic scattering, by the H1 [21,22] and ZEUS [23,24] Collaborations. The most recent measurement of the inclusive isolated prompt photon production was done with 2:9 pb1 at pffiffiffis¼7 TeV by the CMS Collaboration [25]. That measurement, which covers 21< ET<

300 GeV and jj<1:45, is in good agreement with

NLO predictions for the fullETrange.

This paper describes the extraction of a signal of isolated prompt photons using880 nb1 of data collected with the

ATLAS detector at the Large Hadron Collider (LHC). A measurement of the production cross section in pp colli-sions at pffiffiffis¼7 TeV is presented, in the pseudorapidity ranges jj<0:6, 0:6 jj<1:37and 1:52 jj<

1:81, for photons with transverse energies between 15 GeV and 100 GeV.

*Full author list given at the end of the article.

Published by American Physical Society under the terms of the Creative Commons Attribution 3.0 License. Further distribution of this work must maintain attribution to the author(s) and the published article’s title, journal citation, and DOI.

(3)

The paper is organized as follows. The detector is de-scribed in Sec.II, followed by a summary of the data and the simulated samples used in the measurement in Sec.III. SectionIVintroduces the theoretical predictions to which the measurement is compared. Section V describes the photon reconstruction and identification algorithms; their performance is given in Sec.VI. SectionVIIdescribes the methods used to estimate the residual background in the data and to extract the prompt photon signal, followed by a discussion of the data corrections for the cross section measurement in Sec. VIII. The sources of systematic un-certainties on the cross section measurement are discussed in Sec. IX. Section X contains the main experimental results and the comparison of the observed cross sections with the theoretical predictions, followed by the conclu-sions in Sec.XI.

II. THE ATLAS DETECTOR

The ATLAS detector is described in detail in Refs. [26,27]. For the measurement presented in this paper, the calorimeter, with mainly its electromagnetic section, and the inner detector are of particular relevance.

The inner detector consists of three subsystems: at small radial distancerfrom the beam axis (50:5< r <150 mm), pixel silicon detectors are arranged in three cylindrical layers in the barrel and in three disks in each end-cap; at intermediate radii (299< r <560 mm), double layers of single-sided silicon microstrip detectors are used, organ-ized in four cylindrical layers in the barrel and nine disks in each end-cap; at larger radii (563< r <1066 mm), a straw tracker with transition-radiation detection capabil-ities divided into one barrel section (with 73 layers of straws parallel to the beam line) and two end-caps (with 160 layers each of straws radial to the beam line) is used. These three systems are immersed in a 2 T axial magnetic field provided by a superconducting solenoid. The inner detector has full coverage in . The silicon pixel and microstrip subsystems cover the pseudorapidity range

jj<2:5, while the transition-radiation tracker acceptance is limited to the rangejj<2:0. The inner detector allows an accurate reconstruction of tracks from the primary proton-proton collision region, and also identifies tracks from secondary vertices, permitting the efficient recon-struction of photon conversions in the inner detector up to a radius of80 cm.

The electromagnetic calorimeter is a lead-liquid argon (Pb-LAr) sampling calorimeter with an accordion geome-try. It is divided into a barrel section, covering the pseu-dorapidity region jj<1:475, and two end-cap sections, covering the pseudorapidity regions1:375<jj<3:2. It consists of three longitudinal layers. The first one, with a thickness between 3 and 5 radiation lengths, is segmented into high granularity strips in the direction (width be-tween 0.003 and 0.006 depending on, with the exception of the regions1:4<jj<1:5andjj>2:4), sufficient to

provide an event-by-event discrimination between single-photon showers and two overlapping showers coming from a0 decay. The second layer of the electromagnetic calo-rimeter, which collects most of the energy deposited in the calorimeter by the photon shower, has a thickness around 17 radiation lengths and a granularity of0:0250:025in (corresponding to one cell). A third layer, with thickness varying between 4 and 15 radiation lengths, is used to correct leakage beyond the calorimeter for high-energy showers. In front of the accordion calorimeter a thin presampler layer, covering the pseudorapidity interval

jj<1:8, is used to correct for energy loss before the calorimeter. The sampling termaof the energy resolution (ðEÞ=Ea=pffiffiffiffiffiffiffiffiffiffiffiffiffiffiffiffiffiffiE ½GeV) varies between 10% and 17% as a function of jj and is the largest contribution to the resolution up to about 200 GeV, where the global constant term, estimated to be 0.7% [28], starts to dominate.

The total amount of material before the first active layer of the electromagnetic calorimeter (including the presam-pler) varies between 2.5 and 6 radiation lengths as a function of pseudorapidity, excluding the transition region (1:37 jj<1:52) between the barrel and the end-caps, where the material thickness increases to 11.5 radiation lengths. The central region (jj<0:6) has significantly less material than the outer barrel (0:6 jj<1:37), which motivates the division of the barrel into two separate regions in pseudorapidity.

A hadronic sampling calorimeter is located beyond the electromagnetic calorimeter. It is made of steel and scin-tillating tiles in the barrel section (jj<1:7), with depth around 7.4 interaction lengths, and of two end-caps of copper and liquid argon, with depth around 9 interaction lengths.

A three-level trigger system is used to select events containing photon candidates during data-taking [29]. The first level trigger (level-1) is hardware based: using a coarser cell granularity (0:10:1in) than that of the electromagnetic calorimeter, it searches for electro-magnetic clusters within a fixed window of size0:20:2 and retains only those whose total transverse energy in two adjacent cells is above a programmable threshold. The second and third level triggers (collectively referred to as the ‘‘high-level’’ trigger) are implemented in software. The high-level trigger exploits the full granularity and precision of the calorimeter to refine the level-1 trigger selection, based on improved energy resolution and detailed infor-mation on energy deposition in the calorimeter cells.

III. COLLISION DATA AND SIMULATED SAMPLES

A. Collision data

The measurement presented here is based on proton-proton collision data collected at a center-of-mass energyffiffiffi

s p

(4)

which the calorimeters or the inner detector are not fully operational, or show data quality problems, are excluded. Events are triggered using a single-photon high-level trig-ger with a nominal transverse energy threshold of 10 GeV, seeded by a level-1 trigger with nominal threshold equal to 5 GeV. The selection criteria applied by the trigger on shower-shape variables computed from the energy profiles of the showers in the calorimeters are looser than the photon identification criteria applied in the offline analysis, and allow ATLAS to reach a plateau of constant efficiency close to 100% for true prompt photons withET>15 GeV and pseudorapidity jj<1:81. In addition, samples of

minimum-bias events, triggered by using two sets of scin-tillator counters located atz¼ 3:5 mfrom the collision center, are used to estimate the single-photon trigger effi-ciency. The total integrated luminosity of the sample pass-ing data quality and trigger requirements amounts to

ð880100Þ nb1.

In order to reduce noncollision backgrounds, events are required to have at least one reconstructed primary vertex consistent with the average beam spot position and with at least three associated tracks. The efficiency of this require-ment is expected to be greater than 99.9% in events con-taining a prompt photon with ET>15 GeV and lying within the calorimeter acceptance. The total number of selected events in data after this requirement is 9:6 106. The remaining amount of noncollision background

is estimated using control samples collected— during normal data-taking conditions—with dedicated, low threshold triggers that are activated in events where either no proton bunch or only one of the two beams crosses the interaction region. The estimated contribution to the final photon sample is less than 0.1% and is therefore neglected.

B. Simulated events

To study the characteristics of signal and background events, Monte Carlo (MC) samples are generated using PYTHIA 6.4.21 [30], a leading-order parton-shower MC generator, with the modified leading-order MRST2007 [31] parton distribution functions (PDFs). It accounts for QED radiation emitted off quarks in the initial state (ISR) and in the final state (FSR).PYTHIAsimulates the under-lying event using the multiple-parton interaction model, and uses the Lund string model for hadronisation [32]. The event generator parameters are set according to the ATLAS MC09 tune [33], and the detector response is simulated using the GEANT4 program [34]. These samples are then reconstructed with the same algorithms used for data. More details on the event generation and simulation infrastruc-ture are provided in Ref. [35]. For the study of systematic uncertainties related to the choice of the event generator and the parton-shower model, alternative samples are also generated with HERWIG 6.5 [36]. This generator also uses LO pQCD matrix elements, but has a different

parton-shower model (angle-ordered instead of pT-ordered), a different hadronisation model (the cluster

model) and a different underlying event model, which is generated using the JIMMY package [37] with multiple-parton interactions enabled. TheHERWIGevent generation parameters are also set according to the MC09 tune.

To study the main background processes, simulated samples of all relevant 2!2 QCD hard subprocesses involving only partons are used. The prompt photon con-tribution arising from initial and final state radiation emit-ted off quarks is removed from these samples in studies of the background.

Two different simulated samples are employed to study the properties of the prompt photon signal. The first sample consists of leading-order-jet events, and contains primar-ily direct photons produced in the hard subprocesses qg!q and qq !g. The second signal sample in-cludes ISR and FSR photons emitted off quarks in all 2!2 QCD processes involving only quarks and gluons in the hard scatter. This sample is used to study the con-tribution to the prompt photon signal by photons from fragmentation, or from radiative corrections to the direct process, that are less isolated than those from the LO direct processes.

Finally, a sample of W !esimulated events is used for the efficiency and purity studies involving electrons fromWdecays.

IV. THEORETICAL PREDICTIONS

The expected isolated prompt photon production cross section as a function of the photon transverse energyETis calculated with the JETPHOX Monte Carlo program [11], which implements a full NLO QCD calculation of both the direct and the fragmentation contributions to the total cross section. In the calculation performed for this measurement, the total transverse energy carried by the partons inside a cone of radius R¼0:4 in the space around the photon direction is required to be less than 4 GeV. The NLO photon fragmentation function [38] and the CTEQ 6.6 parton density functions [39] provided by theLHAPDF package [40] are used. The nominal renormalization (R), factorization (F) and fragmentation (f) scales are set to

the photon transverse energyET. Varying the CTEQ PDFs within the 68% C.L. intervals causes the cross section to vary between 5% and 2% asETincreases between 15 and 100 GeV. The variation of the three scales independently between 0.5 and 2.0 times the nominal scale changes the predicted cross section by 20% at lowETand 10% at high

ET, while the variation of the isolation requirement be-tween 2 and 6 GeV changes the predicted cross section by no more than 2%. The MSTW 2008 PDFs [41] are used as a cross-check of the choice of PDF. The central values obtained with the MSTW 2008 PDFs are between 3% and 5% higher than those predicted using the CTEQ 6.6 PDFs.

(5)

The NLO calculation provided by JETPHOX predicts a cross section at parton-level, which does not include effects of hadronisation nor the underlying event and pile-up (i.e. multiple proton-proton interactions in the same bunch crossing). The nonperturbative effects on the cross section due to hadronisation are evaluated using the simulated PYTHIA and HERWIG signal samples described in Sec. III B, by evaluating the ratio of the cross section before and after hadronisation and underlying event simu-lation. The ratios are estimated to be within 1% (2%) of unity inPYTHIA(HERWIG) for allETandregions under

study. To account for the effect of the underlying event and pile-up on the measured isolation energy, a correction to the photon transverse isolation energy measured in data is applied, using a procedure described in Sec.V C.

V. PHOTON RECONSTRUCTION, IDENTIFICATION AND ISOLATION

A. Photon reconstruction and preselection

Photon reconstruction is seeded by clusters in the elec-tromagnetic calorimeter with transverse energies exceed-ing 2.5 GeV, measured in projective towers of35cells in in the second layer of the calorimeter. An attempt is made to match these clusters with tracks that are recon-structed in the inner detector and extrapolated to the calo-rimeter. Clusters without matching tracks are directly classified as ‘‘unconverted’’ photon candidates. Clusters with matched tracks are considered as electron candidates. To recover photon conversions, clusters matched to pairs of tracks originating from reconstructed conversion vertices in the inner detector are considered as ‘‘converted’’ photon candidates. To increase the reconstruction efficiency of converted photons, conversion candidates where only one of the two tracks is reconstructed (and does not have any hit in the innermost layer of the pixel detector) are also retained [27,28].

The final energy measurement, for both converted and unconverted photons, is made using only the calorimeter, with a cluster size that depends on the photon classifica-tion. In the barrel, a cluster corresponding to35() cells in the second layer is used for unconverted photons, while a cluster of37() cells is used for converted photon candidates (to compensate for the opening between the conversion products in the direction due to the magnetic field). In the end-cap, a cluster size of55is used for all candidates. A dedicated energy calibration [27] is then applied separately for converted and unconverted photon candidates to account for upstream energy loss and both lateral and longitudinal leakage.

Photon candidates with calibrated transverse energies (ET) above 15 GeV are retained for the successive analysis steps. To minimize the systematic uncertainties related to the efficiency measurement at this early stage of the experiment, the cluster barycenter in the second layer of the electromagnetic calorimeter is required to lie in

the pseudorapidity region jj<1:37, or 1:52 jj<

1:81. Photon candidates with clusters containing cells overlapping with few problematic regions of the calorime-ter readout are removed. Afcalorime-ter the above preselection, 1:3106 photon candidates remain in the data sample.

B. Photon identification

Shape variables computed from the lateral and longitu-dinal energy profiles of the shower in the calorimeters are used to discriminate signal from background [27,42]. The exact definitions of the discriminating variables are pro-vided in Appendix A. Two sets of selection criteria (de-noted ‘‘loose’’ and ‘‘tight’’) are defined, each based on independent requirements on several shape variables. The selection criteria do not depend on the photon candidate transverse energy, but vary as a function of the photon reconstructed pseudorapidity, to take into account varia-tions in the total thickness of the upstream material and in the calorimeter geometry.

1. Loose identification criteria

A set of loose identification criteria for photons is defined based on independent requirements on three quantities:

(i) the leakage Rhad in the first layer of the hadronic

compartment beyond the electromagnetic cluster, fined as the ratio between the transverse energy de-posited in the first layer of the hadronic calorimeter and the transverse energy of the photon candidate; (ii) the ratio R between the energy deposits in37

and77 cells in the second layer of the electro-magnetic calorimeter;

(iii) the root mean square (RMS) widthw2of the energy

distribution along in the second layer of the electromagnetic calorimeter.

True prompt photons are expected to have small hadronic leakage (typically below 1%–2%) and a narrower energy profile in the electromagnetic calorimeter, more concen-trated in the core of the cluster, with respect to background photon candidates from jets.

The loose identification criteria onRhad,Randw2 are

identical for converted and unconverted candidates. They have been chosen, using simulated prompt photon events, in order to obtain a prompt photon efficiency, with respect to reconstruction, rising from 97% at ET¼20 GeV to above 99% for ET>40 GeV for both converted and un-converted photons [28]. The number of photon candidates in data passing the preselection and loose photon identi-fication criteria is0:8106.

2. Tight identification criteria

(6)

tightened. In addition, the transverse shape along the direction in the second layer (the variableR, computed from the ratio between the energy deposits in33 and 37cells) and the shower shapes in the first layer of the calorimeter are examined. Several variables that discrimi-nate single-photon showers from overlapping nearby showers (in particular those which originate from neutral meson decays to photon pairs) are computed from the energy deposited in the first layer:

(i) the total RMS widthws;totof the energy distribution

along;

(ii) the asymmetry Eratio between the first and second

maxima in the energy profile along;

(iii) the energy difference E between the second maximum and the minimum between the two maxima;

(iv) the fraction Fside of the energy in seven strips

centered (in ) around the first maximum that is not contained in the three core strips;

(v) the RMS widthws;3of the energy distribution

com-puted with the three core strips.

The first variable rejects candidates with wide showers consistent with jets. The second and third variables provide rejection against cases where two showers give separated energy maxima in the first layer. The last two variables provide rejection against cases where two showers are merged in a wider maximum.

The tight selection criteria are optimized independently for unconverted and converted photons to account for the quite different developments of the showers in each case. They have been determined using samples of simulated signal and background events prior to data-taking, aiming to obtain an average efficiency of 85% with respect to reconstruction for true prompt photons with transverse energies greater than 20 GeV [28]. About0:2106photon candidates are retained in the data sample after applying the tight identification requirements.

C. Photon transverse isolation energy

An experimental isolation requirement, based on the transverse energy deposited in the calorimeters in a cone around the photon candidate, is used in this measurement to identify isolated prompt photons and to further suppress the main background from 0 (or other neutral hadrons

decaying in two photons), where the0is unlikely to carry

the full original jet energy. The transverse isolation energy (Eiso

T ) is computed using calorimeter cells from both the

electromagnetic and hadronic calorimeters, in a cone of radius 0.4 in thespace around the photon candidate. The contributions from57electromagnetic calorimeter cells in thespace around the photon barycenter are not included in the sum. The mean value of the small leakage of the photon energy outside this region, evaluated as a function of the photon transverse energy, is subtracted from the measured value of EisoT . The typical size of this

correction is a few percent of the photon transverse energy. After this correction, EisoT for truly isolated photons is nominally independent of the photon transverse energy.

In order to make the measurement ofEiso

T directly

com-parable to parton-level theoretical predictions, such as those described in Sec. IV, Eiso

T is further corrected by

subtracting the estimated contributions from the underly-ing event and from pile-up. This correction is computed on an event-by-event basis using a method suggested in Refs. [43,44]. Based on the standard seeds for jet recon-struction, which are noise-suppressed three-dimensional topological clusters [26], and for two different pseudora-pidity regions (jj<1:5 and 1:5<jj<3:0), a kT

jet-finding algorithm [45,46], implemented inFASTJET[47], is used to reconstruct all jets without any explicit transverse momentum threshold. During reconstruction, each jet is assigned an area via a Voronoi tessellation [48] of the space. According to the algorithm, every point within a jet’s assigned area is closer to the axis of that jet than of any other jet. The transverse energy density for each jet is then computed from the ratio between the jet transverse energy and its area. The ambient-transverse-energy density for the event, from pile-up and underlying event, is taken to be the median jet transverse energy density. Finally, this ambient-transverse-energy density is multiplied by the area of the isolation cone to compute the correction toEisoT .

The estimated ambient-transverse-energy fluctuates sig-nificantly event-by-event, reflecting the fluctuations in the underlying event and pile-up activity in the data. The mean correction to the calorimeter transverse energy in a cone of radius R¼0:4 for an event with one pp interaction is around 440 MeV in events simulated with PYTHIA and 550 MeV in HERWIG. In the data, the mean correction is 540 MeV for events containing at least one photon candi-date with ET>15 GeV and exactly one reconstructed

primary vertex, and increases by an average of 170 MeV with each additional reconstructed primary vertex. The average number of reconstructed primary vertices for the sample under study is 1.56. The distribution of measured ambient-transverse-energy densities for photons passing the tight selection criteria is shown in Fig. 1. The impact of this correction on the measured cross section is dis-cussed in Sec. IX B. For a consistent comparison of this measurement to a theoretical prediction which incorpo-rates an underlying event model, the method described above should be applied to the generated final state in order to evaluate and apply the appropriate event-by-event corrections.

After the leakage and ambient-transverse-energy correc-tions, theEiso

T distribution for direct photons in simulated

events is centered at zero, with an RMS width of around 1.5 GeV (which is dominated by electronic noise in the calorimeter). In the following, all photon candidates with EisoT <3 GeVare considered to be experimentally isolated.

(7)

This criterion can be related to a cut on the transverse isolation energy calculated at the parton-level in PYTHIA, in order to mimic the isolation criterion implemented in JETPHOX. This parton-level isolation is the total transverse energy of all partons that lie inside a cone of radius R¼0:4around the photon direction and originated from the same quark emitting the photon in either ISR or FSR. The efficiency of the experimental isolation cut at 3 GeV for photons radiated off partons inPYTHIA is close to the efficiency of a parton-level isolation cut at 4 GeV. This cut on the parton-level isolation is equivalent to the same cut on a particle-level isolation, which measures the transverse energy in a cone of radiusR¼0:4around the photon after hadronisation (with the underlying event removed). The experimental isolation criterion is expected to reject roughly 50% of background candidates with transverse energy greater than 15 GeV.

The number of photon candidates satisfying the tight identification criteria and havingEiso

T <3 GeVis110 442:

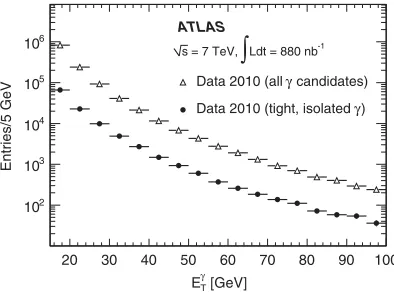
73 614 are reconstructed as unconverted photons and 36 828as converted photons. The transverse energy distri-bution of these candidates is shown in Fig.2. For compari-son, the initial distribution of all photon candidates after the reconstruction and preselection is also shown.

VI. SIGNAL EFFICIENCY

A. Reconstruction and preselection efficiency

The reconstruction and preselection efficiency,"reco, is

computed from simulated events as a function of the true photon transverse energy for each pseudorapidity interval under study. It is defined as the ratio between the number of true prompt photons that are reconstructed—after prese-lection—in a certain pseudorapidity interval and have reconstructedEisoT <3 GeV, and the number of true pho-tons with true pseudorapidity in the same pseudorapidity interval and with particle-level transverse isolation energy lower than 4 GeV. The efficiency of the requirement ET>15 GeVfor prompt photons of true transverse energy greater than the same threshold is taken into account in Sec.VIII.

The reconstruction and preselection efficiencies are cal-culated using a cross-section-weighted mixture of direct photons produced in simulated -jet events and of frag-mentation photons produced in simulated dijet events. The uncertainty on the reconstruction efficiency due to the difference between the efficiency for direct and fragmen-tation photons, and the unknown ratio of the two in the final sample of selected signal photons, are taken into account as sources of systematic uncertainty in Sec.IX A.

The average reconstruction and preselection efficiency for isolated prompt photons withjtruej<1:37or1:52

jtruej<1:81is around 82%; the 18% inefficiency is due to the inefficiency of the reconstruction algorithms at low photon transverse energy (a few %), to the inefficiency of the isolation requirement (5%) and to the acceptance loss from a few inoperative optical links of the calorimeter readout [49].

B. Identification efficiency

The photon identification efficiency, "ID, is similarly

computed as a function of transverse energy in each pseudorapidity region. It is defined as the efficiency for reconstructed (true) prompt photons, with measured Eiso

T <3 GeV, to pass the tight photon identification

crite-ria described in Sec. V B. The identification efficiency is determined from simulation after shifting the photon shower shapes by ‘‘shower-shape correction factors’’ that account for the observed average differences between the discriminating variables’ distributions in data and MC. The simulated sample used contains all the main QCD signal and background processes. The average differences

[GeV] γ T E

20 30 40 50 60 70 80 90 100

Entries/5 GeV

2 10

3 10

4 10

5 10

6 10

candidates) γ

Data 2010 (all

) γ Data 2010 (tight, isolated

-1

Ldt = 880 nb

[image:7.612.73.271.47.190.2]

= 7 TeV, s ATLAS

FIG. 2. Transverse energy distribution of photon candidates selected in data, after reconstruction and preselection (open triangles) and after requiring tight identification criteria and transverse isolation energy lower than 3 GeV (full circles). The photon candidates have pseudorapidity jj<1:37 or

1:52 jj<1:81.

Ambient Transverse Energy Density [GeV/Unit Area] 0 0.5 1 1.5 2 2.5 3 3.5 4 4.5 5

Entries / 100 MeV

0 2000 4000 6000 8000 10000

12000 ATLAS -1 L dt = 880 nb

= 7 TeV s Data 2010,

Tight Photons > 15 GeV γ

[image:7.612.75.272.497.644.2]

T E

(8)

between data and simulation are computed after applying the tight identification criteria. The typical size of the correction factors is 10% of the RMS of the distribution of the corresponding variable in data, with a maximum of 50% of the RMS for the variableðRÞwhere the simulation

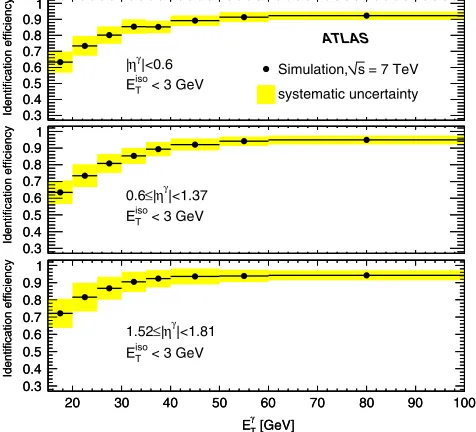
is in worse agreement with the data. The corresponding correction to the MC efficiency is typically around 3% and is always between5%and zero. The photon identi-fication efficiency after all selection criteria (including isolation) are applied is shown in Fig. 3 and in Table I, including the systematic uncertainties that are discussed in more detail in Sec. IX A. The efficiencies for converted photons are, on average, 3%–4% lower than for uncon-verted photons with the same pseudorapidity and trans-verse energy.

As a cross-check, photon identification efficiencies are also inferred from the efficiencies of the same identifica-tion criteria applied to electrons selected in data fromW

decays. Events containingW!ecandidates are selected by requiring: a missing transverse energy greater than 25 GeV (corresponding to the undetected neutrino); an opening azimuthal angle larger than 2.5 radians between the missing transverse energy vector and any energetic jets (ET>15 GeV) in the event; an electron transverse

isola-tion energy in a cone of radius 0.4 in the space smaller than 0.3 times the electron transverse momentum; and a track, associated to the electron, that passes track-quality cuts, such as the minimum requirement on the measured transition-radiation in the transition-radiation tracker and the requirement of the presence of hits in the silicon trackers. These selection criteria, which do not rely on the shape of the electron shower in the calorimeter, are sufficient to select aW !esample with a purity (mea-sured using a calorimeter isolation technique similar to that described in Sec. 6.1 of Ref. [50]) greater than 95%. The identification efficiency of converted photons is taken from the efficiency for selected electrons to pass the tight photon selection criteria. This approximation is expected to hold to within 3% from studies of simulated samples of converted isolated prompt photons and of isolated electrons fromW decays. For unconverted photons, the electrons in data are used to infer shower-shape corrections. These corrections are then applied to unconverted photons in simulation, in order to calculate the unconverted photon efficiency from Monte Carlo. The results from the electron extrapolation method are consistent with those from the simulation, with worse precision due to the limited statistics of the selected electron sample.

C. Trigger efficiency

The efficiency of the calorimeter trigger, relative to the photon reconstruction and identification selection, is defined as the probability for a true prompt photon, passing the tight photon identification criteria and with Eiso

T <3 GeV, to pass the trigger selection. It is

esti-mated in two steps. First, using a prescaled sample of minimum-bias triggers, the efficiency of a lower threshold (3:5 GeV) level-1 calorimeter trigger is determined. The measured efficiency of this trigger is 100% for all photon

Identification efficiency 0.3

0.4 0.5 0.6 0.7 0.8 0.9 1

Identification efficiency 0.3

0.4 0.5 0.6 0.7 0.8 0.9 1

= 7 TeV s Simulation,

systematic uncertainty ATLAS

Identification efficiency

0.3 0.4 0.5 0.6 0.7 0.8 0.9 1

Identification efficiency

0.3 0.4 0.5 0.6 0.7 0.8 0.9 1

[GeV]

T γ

E

20 30 40 50 60 70 80 90 100

Identification efficiency

0.3 0.4 0.5 0.6 0.7 0.8 0.9 1

[GeV]

T γ

E

20 30 40 50 60 70 80 90 100

Identification efficiency

0.3 0.4 0.5 0.6 0.7 0.8 0.9 1

[image:8.612.55.293.49.265.2]

FIG. 3 (color online). Efficiency of the tight identification criteria as a function of the reconstructed photon transverse energy for prompt isolated photons. Systematic uncertainties are included.

TABLE I. Isolated prompt photon identification efficiency in the intervals of the photon pseudorapidity and transverse energy under study.

ET[GeV] Identification Efficiency [%]

0:00 jj<0:60 0:60 jj<1:37 1:52 jj<1:81

[15, 20) 63:36:6 63:56:9 72:28:4

[20, 25) 73:56:1 73:56:8 81:68:3

[25,30) 80:25:4 80:85:7 86:76:6

[30, 35) 85:54:5 85:34:8 90:45:9

[35, 40) 85:23:9 89:34:3 92:35:0

[40, 50) 89:23:3 92:13:6 93:54:6

[50, 60) 91:33:1 94:12:8 93:93:6

[60, 100) 92:22:6 94:82:6 94:22:9

[image:8.612.123.491.589.717.2]
(9)

candidates with reconstructedET>15 GeVpassing tight identification criteria. Then, the efficiency of the high-level trigger is measured using the sample of events that pass the level-1 calorimeter trigger with the 3.5 GeV threshold.

The trigger efficiency for reconstructed photon candi-dates passing tight selection criteria, isolated and with ET>15 GeV is found to be "trig ¼ ð99:50:5Þ%,

con-stant within uncertainties over the full ET and ranges

under study. The quoted uncertainty is obtained from the estimation of the possible bias introduced by using photon candidates from data, which are a mixture of signal and background photon candidates. Using Monte Carlo samples the absolute difference of the trigger efficiency for a pure signal sample and for a pure background sample is found to be smaller than 0.5% for isolated tight photon candidates withET>15 GeV.

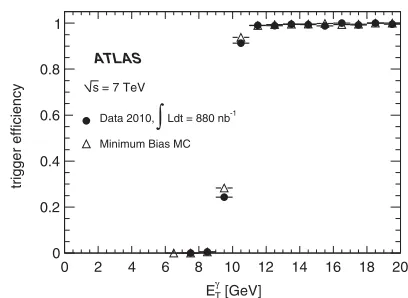
A comparison between the high-level trigger efficiency in data and in the background predicted by the simulation is shown in Fig.4.

VII. BACKGROUND SUBTRACTION AND SIGNAL YIELD DETERMINATION

A non-negligible residual contribution of background candidates is expected in the selected photon sample, even after the application of the tight identification and isolation requirements. Two methods are used to estimate the background contribution from data and to measure the prompt photon signal yield. The first one is used for the final cross section measurement, while the second one is used as a cross-check of the former. All estimates are made separately for each region of pseudorapidity and transverse energy.

A. Isolation vs identification sideband counting method

The first technique for measuring the prompt photon yield uses the number of photon candidates observed in the sidebands of a two-dimensional distribution to estimate

the amount of background in the signal region. The two dimensions are defined by the transverse isolation energy Eiso

T on one axis, and the photon identification (ID) of

the photon candidate on the other axis. On the isolation axis, the signal region contains photon candidates with Eiso

T <3 GeV, while the sideband contains photon

candi-dates withEisoT >5 GeV. On the other axis, photon candi-dates passing the tight identification criteria (tight candidates) belong to the ID signal region, while those

that fail the tight identification criteria but pass a background-enriching selection (‘‘nontight’’ candidates) belong to theIDsideband. The nontight selection requires

photon candidates to fail at least one of a subset of the photon tight identification criteria, but to pass all criteria not in that subset. All the shower-shape variables based on the energy measurement in the first layer of the electro-magnetic calorimeter are used to define the background-enriching selection, with the exception ofws;tot, since it is found to be significantly correlated with theEisoT of back-ground photon candidates, while the photon yield mea-surement relies on the assumption of negligible (or small) correlations between the transverse isolation energy and the shower-shape quantities used to define the background-enriching selection.

The signal region (region ‘‘A’’) is therefore defined by photon candidates passing the tight photon identification criteria and having experimentalEiso

T <3 GeV. The three

background control regions consist of photon candidates either:

(i) passing the tight photon identification criteria but having experimentalEiso

T >5 GeV(region ‘‘B’’)

(ii) havingEisoT <3 GeVand passing the background-enriching identification criteria (region ‘‘C’’) (iii) havingEiso

T >5 GeVand passing the

background-enriching identification criteria (region ‘‘D’’).

A sketch of the two-dimensional plane and of the signal and background control region definitions is shown in Fig.5.

The method assumes that the signal contamination in the three background control regions is small, and that the isolation profile in the nontight regions is the same as that of the background in the tight regions. If these as-sumptions hold, then the number of background candidates in the signal region can be calculated by taking the ratio of candidates in the two nontight regions (NC=ND), and mul-tiplying it by the number of candidates in the tight, non-isolated region (NB). The number of isolated prompt photons passing the tight identification criteria is therefore:

NAsig¼NANBNC

ND; (1)

whereNAis the observed number of photon candidates in

the signal region.

[GeV] γ T E

0 2 4 6 8 10 12 14 16 18 20

trigger efficiency

0 0.2 0.4 0.6 0.8 1

-1 Ldt = 880 nb

Data 2010,

Minimum Bias MC ATLAS

[image:9.612.70.274.42.191.2]

= 7 TeV s

(10)

The assumption that the signal contamination in the background control regions is small is checked using prompt photon MC samples. As the number of signal events in the background control regions is always positive and nonzero, corrections are applied to limit the effects on the final result. For this purpose, Eq. (1) is modified in the following way:

NAsig¼NA ðNBcBN sig

A Þ

ðNCcCNsigA Þ

ðNDcDNsigA Þ; (2)

wherecK

NsigK

NsigA (forK2 fB; C; Dg) are the signal leakage

fractions extracted from simulation. Typical values forcB are between 3% and 17%, increasing with the photon candidate transverse energy; for cC, between 2% and 14%, decreasing withET.cD is always less than 2%. The total effect of these corrections on the measured signal photon purities is typically less than 5%.

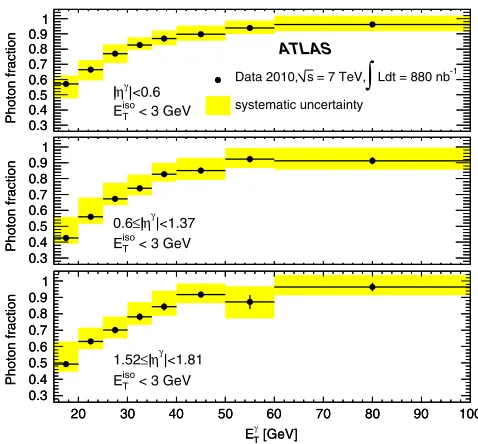
The isolated prompt photon fraction measured with this method, as a function of the photon reconstructed

transverse energy, is shown in Fig. 6. The numbers of isolated prompt photon candidates measured in each pseu-dorapidity and transverse energy interval are also reported in TableII. The systematic uncertainties on the measured prompt photon yield and fraction in the selected sample are described in Sec.IX B.

B. Isolation template fit method

The second method relies on a binned maximum like-lihood fit to the Eiso

T distribution of photon candidates

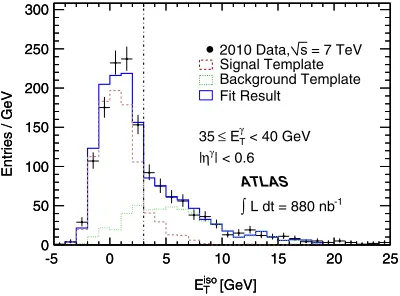
selected in data which pass the tight identification criteria. The distribution is fit to the sum of a signal template and a background template, determined from control samples extracted from data. This is similar to the technique em-ployed in [20], but relies less on simulation for signal and background templates. The signal template is determined from the Eiso

T distribution of electrons from W and Z [GeV]

iso T E

-5 0 5 10 15 20 25 30 35

ID

γ

pass tight cuts fail tight cuts

A C

B D

FIG. 5 (color online). Illustration of the two-dimensional plane, defined by means of the transverse isolation energy and a subset of the photon identification (ID) variables, used for estimating, from the observed yields in the three control regions ðB; C; DÞ, the background yield in the signal region (A).

Photon fraction 0.30.4

0.5 0.6 0.7 0.8 0.9 1

Photon fraction 0.30.4

0.5 0.6 0.7 0.8 0.9 1 -1

Ldt = 880 nb

[image:10.612.316.555.43.265.2] [image:10.612.69.286.46.197.2] [image:10.612.124.489.578.716.2]

= 7 TeV, s Data 2010, systematic uncertainty ATLAS |<0.6 γ η |

< 3 GeV

iso T E Photon fraction 0.3 0.4 0.5 0.6 0.7 0.8 0.9 1 Photon fraction 0.3 0.4 0.5 0.6 0.7 0.8 0.9 1 |<1.37 γ η | ≤ 0.6

< 3 GeV

iso T E [GeV] γ T E

20 30 40 50 60 70 80 90 100

Photon fraction 0.3 0.4 0.5 0.6 0.7 0.8 0.9 1 [GeV] T E

20 30 40 50 60 70 80 90 100

Photon fraction 0.3 0.4 0.5 0.6 0.7 0.8 0.9 1 |<1.81 γ η | ≤ 1.52

< 3 GeV

iso T

E

FIG. 6 (color online). Fraction of isolated prompt photons as a function of the photon transverse energy, as obtained with the two-dimensional sideband method.

TABLE II. Observed number of isolated prompt photons in the photon transverse energy and pseudorapidity intervals under study. The first uncertainty is statistical, the second is the systematic uncertainty, evaluated as described in Sec.IX B.

Isolated prompt photon yield

ET[GeV] 0:00 jj<0:60 0:60 jj<1:37 1:52 jj<1:81

[15, 20) ð1193þ12

20Þ 10

2 ð1304þ40

11Þ 10

2 ð722þ20

7Þ 10

2

[20, 25) ð50112þ47

53Þ 10

1 ð57818þ125

45Þ 10

1 ð30410þ40

23Þ 10

1

[25, 30) ð2607þ20

21Þ 10

1 ð30610þ46

18Þ 10

1 ð1356þ16

10Þ 10

1

[30, 35) ð1465þ9

6Þ 10

1 ð1606þ19

9Þ 10

1 ð734þ8

5Þ 10

1

[35, 40) ð824þ5

4Þ 10

1 ð1024þ9

6Þ 10

1 ð443þ5

3Þ 10

1

[40, 50) ð773þ54Þ 101 ð984þ9

7Þ 101 ð382

þ3

2Þ 101

[50, 60) ð32920þ17

14Þ 10

0 ð4202030Þ 100 ð14716þ16

17Þ 10

0

[60, 100) ð32920þ19

15Þ 10

0 ð37020þ30

20Þ 10

0 ð15412þ12

8Þ 10

0

(11)

decays, selected using the criteria described in [50]. Electrons from W decays are required to fulfill tight selection criteria on the shapes of their showers in the electromagnetic calorimeter and to pass track-quality re-quirements, including the presence of transition-radiation hits. They must also be accompanied byEmiss

T >25 GeV,

and the electron-EmissT system must have a transverse mass larger than 40 GeV. Electrons fromZdecays are selected with looser criteria, but the pair must have an invariant mass close to the Z mass. A single signal template is constructed for each region injj, exploiting the indepen-dence ofEiso

T from the transverse energy of the object (after

applying the corrections described in Sec. V C) to max-imize the available statistics. A small bias is expected due to differences between the electron and photonEiso

T

distri-butions, especially in regions where there is significant material upstream of the calorimeter. A shift of the signal template is applied to the electron distributions extracted from data to compensate for the differences between elec-trons and photons seen in simulation. This shift, computed using simulated photon and electron samples, increases from 100 MeV to 600 MeV with increasing jj.

The background template is extracted from data for each (ET,jj) bin, using the same reverse-cuts procedure as in the two-dimensional sideband technique. A simulation-based correction, typically of the order of 3%–4%, is applied to the final photon fraction to account for a signal which leaks into the background template. The fit is per-formed in each region of jj for the individual bins in

transverse energy, and the signal yield and fraction are extracted. An example of such a fit is shown in Fig. 7. The results from this alternative technique are in good agreement with those from the simpler counting method described in the previous subsection, with differences

typically smaller than 2% and within the systematic un-certainties that are uncorrelated between the two methods.

C. Electron background subtraction

The background of prompt electrons misidentified as photons needs also to be considered. The dominant elec-tron production mechanisms are semileptonic hadron de-cays (mostly from hadrons containing heavy flavor quarks) and decays of electroweak bosons (the largest contribution being fromWdecays). Electrons from the former are often produced in association with jets, and have Eiso

T profiles

similar to the dominant backgrounds from light mesons. They are therefore taken into account and subtracted using the two-dimensional sideband technique described in Sec. VII A. Conversely, electrons from W and Z decays haveEiso

T profiles that are similar to those of signal photons.

The contribution of this background to the signal yield computed in Sec. VII A needs therefore to be removed before the final measurement of the cross section.

The fraction of electrons reconstructed as photon candidates is estimated from the data, as a function of the electron transverse energy and pseudorapidity, using a control sample ofZ!eþe decays. The average elec-tron misidentification probability is around 8%. Using the W !e andZ!ee cross section times branching ratio measured by ATLAS inppcollisions atpffiffiffis¼7 TeV[50], the estimated fraction of photon candidates due to isolated electrons is found to be on average 0:5%, varying sig-nificantly with transverse energy. A maximum contamina-tion of (2:5%0:8%) is estimated for transverse energies between 40 and 50 GeV, due to the kinematic distribution of electrons from W andZ decays. The uncertainties on these estimates are less than 1% of the photon yield.

VIII. CROSS SECTION MEASUREMENT

The differential cross section is measured by computing:

d dET ¼

NyieldU

ðRLdtÞET"trigger"reco"ID

: (3)

The observed signal yield (Nyield) is divided by the widths of the ET-intervals (E

T) and by the product of

the photon identification efficiency ("ID, determined in

Sec.VI B) and of the trigger efficiency relative to photon candidates passing the identification criteria ("trigger,

deter-mined in Sec. VI C). The spectrum obtained this way, which depends on the reconstructed transverse energy of the photon candidates, is then corrected for detector energy resolution and energy scale effects using bin-by-bin cor-rection factors (the ‘‘unfolding coefficients’’U) evaluated using simulated samples. The corrected spectrum, which is then a function of the true photon energy, is divided by the photon reconstruction efficiency "reco (Sec.VI A) and by

the integrated luminosity of the data sample,RLdt. iso

T E [GeV]

-5 0 5 10 15 20 25

Entries / GeV

0 50 100 150 200 250 300 iso T E [GeV]

-5 0 5 10 15 20 25

Entries / GeV

0 50 100 150 200 250 300

< 40 GeV

γ

T

[image:11.612.75.275.473.621.2]

E ≤ 35

| < 0.6

γ

η |

= 7 TeV s 2010 Data, Signal Template Background Template Fit Result ATLAS -1

L dt = 880 nb

(12)

The unfolding coefficients are evaluated from the ratio of the true to reconstructed ET distributions of photon candidates, using PYTHIA isolated prompt photon simu-lated samples. This procedure is justified by the small bin-to-bin migrations (typically of the order of a few %) that are expected, given the good electromagnetic calo-rimeter energy resolution compared to the width of the transverse energy intervals used in this analysis (between 5 and 40 GeV). The values of the unfolding coefficients are slightly higher than 1 and decrease as a function of ET,

approaching 1. They differ from 1 by less then 2% in the

jjregion between 0.0 and 0.6, and by less than 5%–7% in the other two jj regions, where more material up-stream of the electromagnetic calorimeter is present.

IX. SYSTEMATIC UNCERTAINTIES

Several sources of systematic uncertainties on the cross section are identified and evaluated as described in the following sections. The total systematic uncertainty is obtained by combining the various contributions, taking into account their correlations: uncorrelated uncertainties are summed in quadrature while a linear sum of correlated uncertainties is performed.

A. Reconstruction, identification, trigger efficiencies

The systematic uncertainty on the reconstruction effi-ciency from the experimental isolation requirement is evaluated from the prompt photon simulation varying the value of the isolation criterion by the average difference (of the order of 500 MeV) observed for electrons fromW and Z decays in simulation and data. It is 2.5% in the pseudorapidity regions covered by the barrel calorimeter and 4.5% in the end-caps.

The systematic uncertainty on the identification effi-ciency due to the photon shower-shape corrections is di-vided into two parts. The first term evaluates the impact of treating the differences between the distributions of the shower-shape variables in data and simulation as an average shift. This uncertainty is evaluated in the following way:

(i) A modified description of the detector material is used to produce a second sample of simulated photon candidates. These candidates have different shower-shape distributions, due to the different amount of material upstream of and within the calorimeter. This alternative model contains an additional 10% of material in the inactive volumes of the inner detector and 10% of a radiation length in front of the elec-tromagnetic calorimeter. This model is estimated to represent a conservative upper limit of the additional detector material that is not accounted for by the nominal simulation.

(ii) The correction procedure is applied to the nominal simulation to estimate the differences between the nominal and the alternative simulation. The shifts between the discriminating variable distributions in the nominal and the alternative simulation are

eval-uated, and are used to correct the shower-shape variable distributions of the nominal simulation. (iii) The photon efficiency from the nominal simulation

is recomputed after applying these corrections, and compared with the efficiency obtained from the alternative simulation.

The difference between the efficiency estimated from the nominal simulation (after applying the corrections) and the efficiency measured directly in the alternative sample (with no corrections) ranges from 3% at ET20 GeV to less than 1% at ET80 GeV.

The second part of the systematic uncertainty on the identification efficiency accounts for the uncertainty on the extracted shower-shape correction factors. The correction factors were extracted by comparing tight photons in data and simulation; to evaluate the uncertainty associated with this choice, the same correction factors are extracted using loose photons. The difference in the final efficiency when applying the tight corrections and the loose corrections is then taken as the uncertainty. This uncertainty drops from 4% to 1% with increasingET.

Additional systematic uncertainties that may affect both the reconstruction and the identification efficiencies are evaluated simultaneously for the product of the two, to take into account possible correlations. These sources of uncertainty include the amount of material upstream of the calorimeter; the impact of pile-up; the relative fraction of direct and fragmentation photons in data with respect to simulation; the misidentification of a converted photon as unconverted; the difference between the PYTHIA and HERWIGsimulation models; the impact of a sporadic faulty calibration of the cell energies in the electromagnetic calorimeter; and the imperfect simulation of acceptance losses due to inoperative readout links in the calorimeter.

Of all the uncertainties which contribute to this mea-surement, the largest ones come from the uncertainty on the amount of material upstream of the calorimeter (abso-lute uncertainties ranging between 1% and 8% and are larger at low ET), and from the uncertainty on the identi-fication efficiency due to the photon shower-shape correc-tions (the absolute uncertainties are in the range 1%–5%, and are larger at lowET).

The uncertainty on the trigger efficiency, evaluated as described in Sec. VI C, is 0.5% and is nearly negligible compared to all other sources.

B. Signal yield estimates

The following sources of systematic uncertainties affect-ing the accuracy of the signal yield measurement usaffect-ing the two-dimensional sideband technique are considered.

1. Background isolation control region definition

The signal yield is evaluated after changing the isolation control region definition. The minimum value of EisoT

(13)

quired for candidates in the nonisolated control regions, which is set to 5 GeV in the nominal measurement, is changed to 4 and 6 GeV. This check is sensitive to un-certainties in the contribution of prompt photons from QED radiation from quarks: these photons are less isolated than those originating from the hard process. Alternative measurements are also performed where a maximum value of Eiso

T is set to 10 or 15 GeV for candidates in the

non-isolated control regions, in order to reduce the correlation between the isolation variable and the shower-shape dis-tributions seen in simulated events for candidates belong-ing to the upper tail of the isolation distribution. The largest positive and negative variations of the signal yield with respect to the nominal result are taken as systematic un-certainties. The signal photon fraction changes by at most

2% in all the transverse energy and pseudorapidity intervals.

2. Background photon identification control region definition

The measurement is repeated reversing the tight identi-fication criteria on a number of strip variables ranging between two (onlyFsideandws3) and five (all the variables

based on the first layer of the electromagnetic calorimeter). The largest positive and negative variations of the signal yield (with respect to the nominal result) from these three alternative measurements are taken as systematic uncer-tainties. The effect on the signal photon fraction decreases with increasing photon transverse energy, and is around 10% forET between 15 and 20 GeV.

3. Signal leakage into the photon identification background control region

From the photon identification efficiency studies, an upper limit of 5% is set on the uncertainty on the fraction cCof signal photons passing all the tight photon

identifi-cation criteria except those used to define the photon identification control region. The signal yields in each ET, jj interval are thus measured again after varying the estimated signal contamination in the photon identifi-cation control regions (cCandcD=cB) by this uncertainty,

and the difference with the nominal result is taken as a systematic uncertainty. The signal fraction variations are always below 6%.

4. Signal leakage into the isolation background control region

The fractionscBandcDof signal photons contaminating the isolation control regions depend on the relative amount of direct and fragmentation photons in the signal selected in a certainET, jjinterval, since the latter are

charac-terized by larger nearby activity, and therefore usually have slightly larger transverse isolation energies. In the nominal measurement, the values ofcBandcD are computed with

the relative fractions of direct and fragmentation photons predicted byPYTHIA. A systematic uncertainty is assigned by repeating the measurement after varying these fractions between 0% and 100%. The measured signal photon frac-tion varies by less than 5%.

5. Signal photon simulation

The signal yield is estimated using samples of prompt photons simulated with HERWIG instead ofPYTHIAto de-termine the fraction of signal leaking into the three back-ground control regions. The variations of the signal photon fractions in eachET,jjinterval are below 2%.

6. Correlations between the isolation and the photon identification variables for background candidates

Non-negligible correlations between the isolation vari-able and the photon identification quantities would affect Eq. (2): the true number of isolated tight prompt photon candidates would be

NAsig¼NARbkgðN

BcBN

sig

A Þ

ðNCcCN

sig

A Þ

ðNDcDN

sig

A Þ

(4)

where Rbkg NAbkgN bkg D

NBbkgNCbkgwould then be different from unity.

The simulation of background events shows a small but non-negligible correlation between the isolation and the discriminating shower-shape variables used to define the photon identification signal and background control re-gions. The signal yields are therefore recomputed with the formula in Eq. (4), using forRbkg the value predicted

by the PYTHIA background simulation, and compared with the nominal results. The effect is smaller than 0.6% in the jj<1:37intervals and around 3.6% for 1:52

jj<1:81.

7. Transverse isolation energy corrections

The effects of the Eiso

T correction for the underlying

event on the estimated signal yield are also investigated. The impact of this correction is evaluated by estimating the signal yield, with and without the correction applied, for events with only one reconstructed primary vertex (to eliminate any effects of pile-up). The estimated signal yields using the uncorrected values of Eiso

T , normalized to

the yields derived using the corrected values, show no trend inETor. Furthermore, the impact on the cross section of the event-by-event corrections is equivalent to that of an average correction of 540 MeV applied to the transverse isolation energies of all photon candidates. Similar studies inPYTHIAandHERWIGMC yield identical results.

C. Unfolding coefficients

(14)

using simulated samples. There are three sources of un-certainties on these coefficients.

1. Energy scale uncertainty

The uncertainty on the energy scale was estimated to be

3% in test beam studies [51], and is confirmed to be below this value from the comparison of the Z!eþe invariant mass peak in data and Monte Carlo. The unfold-ing coefficients are thus recomputed usunfold-ing simulated signal events where the true photon energy is shifted by 3%. The coefficients change by10%. This uncertainty intro-duces a relative uncertainty of about 10% on the measured cross section which is fully correlated between the differ-entETintervals within each pseudorapidity range.

2. Energy resolution uncertainty

The uncertainty on the energy resolution may affect bin-by-bin migrations between adjacent ET bins. Test beam

studies indicate that the sampling terms of the resolution in data and simulation have a relative difference within 20%. Furthermore, studies of theZ!eþe invariant mass dis-tribution in data indicate that the constant term of the calorimeter energy resolution is below 1.5% in the barrel and 3.0% in the end-cap (it is 0.7% in the simulation). The unfolding coefficients are thus recomputed after smearing the reconstructed energy of simulated photons to take into account a 20% relative increase of the sampling term and a constant term of 1.5% in the barrel and 3.0% in the end-cap. The resulting variation of the unfolding coefficients is always less than 1%. The uncertainty arising from non-gaussian tails of the energy resolution function is estimated by recomputing the coefficients using a prompt photon simulation where a significant amount of material is added to the detector model. The variations of the unfolding coefficients are smaller than 1% in all the pseudorapidity and transverse energy intervals under study.

3. Simulated photon transverse energy distribution

The unfolding coefficients, computed inETintervals of non-negligible size, depend on the initial ET distribution predicted by PYTHIA. An alternative unfolding technique [52] is therefore used, which relies on the repeated appli-cation of Bayes’ theorem to iteratively obtain an improved estimate of the unfolded spectrum. This technique relies less on the simulated originalETdistribution of the prompt

photons. The differences between the cross-sections esti-mated using the bin-by-bin unfolding and the iterative Bayesian unfolding are within 2%, and are taken into account as an additional systematic uncertainty.

D. Luminosity

The integrated luminosity is determined for each run by measuring interaction rates using several ATLAS subde-tectors at small angles to the beam line, with the absolute

calibration obtained from beam position scans [53]. The relative systematic uncertainty on the luminosity measurement is estimated to be 11% and translates directly into an 11% relative uncertainty on the cross section.

X. RESULTS AND DISCUSSION

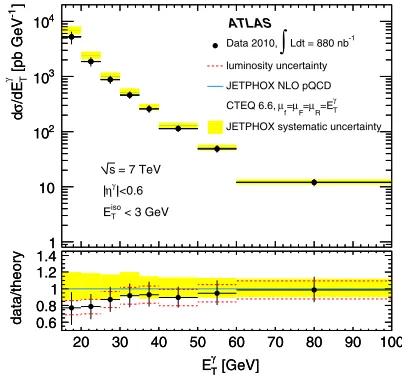
The measured inclusive isolated prompt photon produc-tion cross secproduc-tionsd=dET are shown in Fig.8–10. They are presented as a function of the photon transverse energy, for each of the three considered pseudorapidity intervals. They are also presented in tabular form in Appendix B. The measurements extend from ET¼15 GeV to ET¼

100 GeV spanning almost 3 orders of magnitude. The data are compared to NLO pQCD calculations, obtained with the JETPHOX program as described in Sec. IV. The error bars on the data points represent the combination of the statistical and systematic uncertainties (summed in quadrature): systematic uncertainties dominate over the whole considered kinematic range. The contribution from the luminosity uncertainty (11%) is shown separately (dotted bands) as it represents a possible global offset of all the measurements. The total systematic uncertainties on the theoretical predictions are represented with a solid band. They are obtained by summing in quadrature the contributions from the scale uncertainty, the PDF uncer-tainty (at 68% C.L.) and the unceruncer-tainty associated with the choice of the parton-level isolation criterion. The same quantities are also shown, in the bottom panels of Fig. 8–10, after having been normalized to the expected NLO pQCD cross sections.

In general, the theoretical predictions agree with the measured cross sections for ET>25 GeV. For lowerET

]

-1

[pb GeVT

/dE σ d 1 10 2 10 3 10 4 10 ] -1 [pb GeV /dE σ d 1 10 2 10 3 10 4 10 -1 Ldt = 880 nb

Data 2010,

luminosity uncertainty

JETPHOX NLO pQCD

γ T =E R µ = F µ = f µ CTEQ 6.6,

JETPHOX systematic uncertainty

[image:14.612.336.537.461.649.2]

= 7 TeV s

|<0.6

γ

η

|

< 3 GeV

iso T E ATLAS [GeV] γ T E

20 30 40 50 60 70 80 90 100

data/theory 0.6 0.8 1 1.2 1.4 [GeV] γ T E

20 30 40 50 60 70 80 90 100

data/theory 0.6 0.8 1 1.2 1.4 γ

FIG. 8 (color online). Measured (dots) and expected (full line) inclusive prompt photon production cross sections, as a function of the photon transverse energies above 15 GeV and in the pseudorapidity range jj<0:6. The bottom panel shows the ratio between the measurement and the theoretical prediction.

Figure

FIG. 1.The measured ambient-transverse-energy densities, us-ing the jet-area method, for events with at least one tight photon.The ambient-transverse-energy contains contributions from boththe underlying event and pile-up
TABLE I.Isolated prompt photon identification efficiency in the intervals of the photonpseudorapidity and transverse energy under study.
FIG. 4.Photon trigger efficiency, with respect to reconstructedisolated photon passing the tight identification criteria, as mea-sured in data (circles) and simulated background events (tri-angles).
FIG. 6 (color online).Fraction of isolated prompt photons as afunction of the photon transverse energy, as obtained with thetwo-dimensional sideband method.
+5

References

Related documents

In this study, using 16-channel near infrared spectroscopy, we investigated frontal lobe activation in 46 healthy university students during viewing of photographs of

A six-field, nonlinear, reduced magnetohydrodynamics model containing the fast shear Alfv´en wave and electron and ion heat conduction along magnetic fields is solved by

On the completion of the European customs union, on 1 July 1968, the Federal Minister for Economic Affairs wrote an article on the future aims of European

Machines pour l'industrie du cuir. b) Ohne solche der Textilveredlung und für den Haushalt. Dieselmotoren; ohne Motoren für Kraftfahrzeuge, Straßen­ zugmaschinen und

Department of Forensic Medicine, Institute of Medical Sciences, Banaras Hindu University, Varanasi, India Department of Community Medicine, IMS, BHU, India.. Department of

The main aim of the present study was to characterize the soil and to evaluate the land capability for the production of some common tropical crops in some mountainous ecosystem

Prevalence and Risk Factors of Infectious Spondylodiscitis in Benin’s Children.. Zavier Zomalheto 1* , Michee Assogba 2 , Vanessa

An Isolated Case of Brachyphalangism of the Basal Finger Bones of the Little Finger with Symptoms of Tenosynovitis: A Case Report.. Kazuhiko Hashimoto * , Ryosuke Kakinoki,