This is a repository copy of Water-Soluble Organic Composition of the Arctic Sea Surface Microlayer and Association with Ice Nucleation Ability.
White Rose Research Online URL for this paper: http://eprints.whiterose.ac.uk/127892/
Version: Accepted Version
Article:
Chance, Rosemary Jane orcid.org/0000-0002-5906-176X, Hamilton, Jacqueline Fiona orcid.org/0000-0003-0975-4311, Carpenter, Lucy Jane orcid.org/0000-0002-6257-3950 et al. (3 more authors) (2018) Water-Soluble Organic Composition of the Arctic Sea Surface Microlayer and Association with Ice Nucleation Ability. Environmental Science &
Technology. pp. 1817-1826. ISSN 1064-3389
https://doi.org/10.1021/acs.est.7b04072
[email protected] https://eprints.whiterose.ac.uk/
Reuse
Items deposited in White Rose Research Online are protected by copyright, with all rights reserved unless indicated otherwise. They may be downloaded and/or printed for private study, or other acts as permitted by national copyright laws. The publisher or other rights holders may allow further reproduction and re-use of the full text version. This is indicated by the licence information on the White Rose Research Online record for the item.
Takedown
If you consider content in White Rose Research Online to be in breach of UK law, please notify us by
Water-soluble organic composition of the
1Arctic sea surface microlayer and association
2with ice nucleation ability
34
Rosie J. Chance*1, Jacqueline F. Hamilton1, Lucy J. Carpenter1, Sina C. 5
Hackenberg1, Stephen J. Andrews1, Theodore W. Wilson2 6
7
1. Wolfson Atmospheric Chemistry Laboratories, Department of Chemistry,
8
University of York, Heslington, York, YO10 5DD, UK.
9
2. School of Earth and Environment, University of Leeds, Woodhouse Lane, Leeds,
10
LS2 9TJ, UK.
11
12
Now at Owlstone Medical Ltd., 162 Cambridge Science Park, Milton Road
13
Cambridge, CB4 0GH, UK.
14
15
16
* Corresponding author: [email protected]
17
Abstract 19
Organic matter in the sea surface microlayer (SML) may be transferred to the
20
atmosphere as sea spray and hence influence the composition and properties of
21
marine aerosol. Recent work has demonstrated that the SML contains material
22
capable of heterogeneously nucleating ice, but the nature of this material remains
23
largely unknown. Water-soluble organic matter was extracted from SML and
24
underlying seawater from the Arctic and analyzed using a combination of mass
25
spectrometric approaches. High performance liquid chromatography-ion trap mass
26
spectrometry (LC-IT-MS), and Fourier transform ion cyclotron resonance MS
(FT-27
ICR-MS), showed seawater extracts to be compositionally similar across all stations,
28
while microlayer extracts had a different and more variable composition. LC-IT-MS
29
demonstrated the enrichment of particular ions in the microlayer. Ice nucleation
30
ability (defined as the median droplet freezing temperature) appeared to be related to
31
the relative abundances of some ions, although the extracts themselves did not retain
32
this property. Molecular formulae were assigned using LC - quadrupole time-of-flight
33
MS (LC-TOF-MS2
) and FT-ICR-MS. The ice nucleation tracer ions were associated
34
with elevated biogenic trace gases, and were also observed in atmospheric aerosol
35
collected during the summer, but not early spring suggesting a biogenic source of ice
36
nuclei in the Arctic microlayer.
37
39
TOC/Abstract art 40
Introduction 42
The sea surface microlayer (SML) is a thin layer of water at the sea-air interface in
43
which chemical, physical and biological properties differ from those of the underlying
44
seawater1
. The SML has an operationally defined thickness of ~1 to ~1000 μm 1 , and
45
surfactant enrichments have been found to persist up to wind speeds of up to at least ~
46
13 m s-1 2, 3
. It has been recognized as a distinct compartment for photochemical
47
reactions4, 5
and biogeochemical transformations1 .
48
49
As the SML lies at the interface between the ocean and the atmosphere, it is expected
50
to influence the transfer of gases and particles between these compartments6-10 .
51
Material from the SML may become entrained in sea spray aerosol (SSA) generated
52
by bubble bursting processes11, but the extent of the SML's direct contribution to SSA
53
remains unknown12. In the central Arctic, atmospheric particles have been found to
54
have similar properties to particles (~100 nm diameter) in the SML beneath,
55
suggesting that the SML may be a significant source of these aerosol particles13.
56
Similarly, co-variation of anionic surfactants in aerosol and the SML in the
57
Mediterranean suggests the SML is a source of aerosol organic matter14 .
58
Photochemical and heterogeneous reactions in the microlayer may also supply
59
volatile organic compounds (VOCs) to the atmosphere, and so contribute to
60
secondary organic aerosol formation4, 15, 16 .
61
62
The influence of the SML on air-sea exchange and marine aerosol properties is
63
assumed to be a function of its chemical composition, but as yet, the composition of
64
the microlayer has not been fully characterized. Relative to the underlying bulk
65
seawater, the SML has been found to be enriched in a wide range of organic and
inorganic compounds (12
and references therein; 6, 17-27
). Rising bubbles collect
surface-67
active organic material from the water column and transfer it to the microlayer1, 2,
68
where further enrichment and/or modification (e.g. by photochemical oxidation5, or
69
microbial degradation1, 28
) of some compound classes may occur. Non-targeted
high-70
resolution mass spectrometry has shown a shift towards lower molecular weight
71
compounds in the SML relative to the underlying seawater, thought to be the result of
72
increased degradation22 .
73
74
The microlayer is also enriched in biogenic material that can heterogeneously
75
nucleate ice29
. The presence of ice nucleating particles (INPs) in bulk seawater and
76
marine air masses has long been known30-35
, and recent studies indicate that the oceans
77
are probably an important source of aerosolized atmospheric INPs, particularly in
78
remote regions away from terrestrial sources29, 36-38. Depending on the exact nucleation
79
pathway, heterogeneous ice nucleation by INPs can raise the temperature and/or
80
lower the relative humidity at which ice crystals form in clouds, with consequent
81
impacts on cloud lifetime, precipitation and cloud radiative properties. The identity of
82
INPs in the SML, and the factors governing their abundance, remain unknown.
83
84
In this work, low mass resolution liquid chromatography mass spectrometry was used
85
to explore the molecular composition of dissolved organic matter (DOM) isolated
86
from Arctic SML and underlying seawater, with the aim of identifying features which
87
related to ice nucleation activity, an atmospherically relevant property. A combination
88
of high-mass resolution mass spectrometric techniques was then used to examine
89
these features further. The work was conducted as part of the Aerosol-Cloud Coupling
90
and Climate Interactions in the Arctic (ACCACIA) project.
Experimental section 92
93
Sample collection 94
Samples were collected from the Greenland and Barents Seas during cruise JR288 of
95
the RRS James Clark Ross in July-August 2013. Water sampling locations are shown
96
in Figure 1 and further details are given in Table S1 of Supplementary Information
97
(SI). Sea surface microlayer samples were collected using a remote controlled rotating
98
drum type sampler deployed for approximately 40 minutes per sample29, 39 .
Sub-99
samples of ~1 L were taken for mass spectrometric analysis. Two sampling blanks
100
('boat blanks') were collected by running underlying seawater from the same location
101
over the sampler drum, and consequently through the samplerÕs whole collection
102
system. Underlying seawater was collected from approximately 2-5 m depth using
103
Niskin bottles deployed on a CTD rosette. Seawater subsamples (~10 L) were
104
collected from the Niskin bottles into dedicated clean glass sampling bottles that were
105
rinsed with dilute HCl (10% v/v) prior to the start of the cruise.
106
107
Atmospheric aerosol samples were collected during cruise JR288, and also during a
108
cruise to the same area made by the RV Lance in March 2013. Aerosol samples were
109
collected onto pre-combusted quartz (Whatman QM-A) filters using a high volume
110
aerosol collector (Ecotech Hi-vol 3000; air flow ~68 m3 hr-1
) fitted with a PM2.5 size 111
selective inlet. The sampler was located on the bridge-top deck of each ship, and
112
automatically controlled according to wind direction in order to avoid contamination
113
from the ship's stack. Individual samples were collected over 24 hour periods, with an
114
average total air volume of 1261 m3
per sample.
115
117
118
[image:8.595.58.487.70.791.2]119
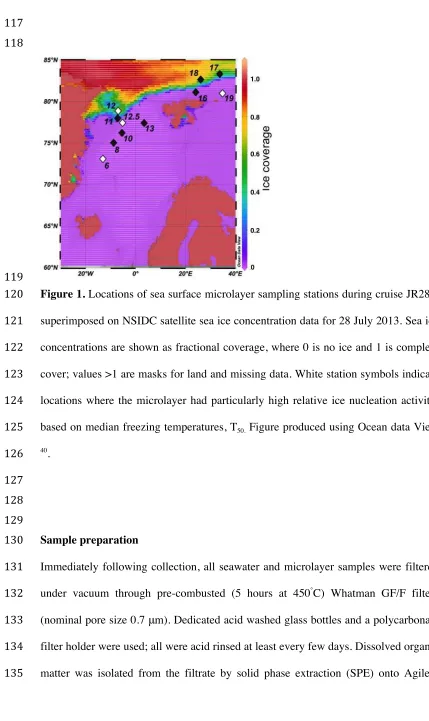
Figure 1. Locations of sea surface microlayer sampling stations during cruise JR288,
120
superimposed on NSIDC satellite sea ice concentration data for 28 July 2013. Sea ice
121
concentrations are shown as fractional coverage, where 0 is no ice and 1 is complete
122
cover; values >1 are masks for land and missing data. White station symbols indicate
123
locations where the microlayer had particularly high relative ice nucleation activity,
124
based on median freezing temperatures, T50. Figure produced using Ocean data View 125
40 .
126
127
128
129
Sample preparation 130
Immediately following collection, all seawater and microlayer samples were filtered
131
under vacuum through pre-combusted (5 hours at 450¡
C) Whatman GF/F filters
132
(nominal pore size 0.7 μm). Dedicated acid washed glass bottles and a polycarbonate
133
filter holder were used; all were acid rinsed at least every few days. Dissolved organic
134
matter was isolated from the filtrate by solid phase extraction (SPE) onto Agilent
Bond Elut PPL cartridges, using LC-MS grade solvents (Fisher Optima), according to
136
the method of Dittmar et al41. Procedural blanks were prepared by replacing the
137
sample with ~5 mL of rinse solution (0.01M hydrochloric acid). The operationally
138
defined fraction of the DOM isolated by this procedure is referred to as SPE-DOM.
139
SPE extraction efficiency was not evaluated here, but a previous comparison of
140
sorbents found the protocol adopted here to be the most efficient at extracting DOM
141
from seawater, with average recoveries of 43 and 62% for coastal and open ocean
142
waters respectively41
. Longnecker et al42
achieved DOM recoveries from Arctic
143
seawater of 32 to 43% using a variation of this method with two SPE extraction steps.
144
145
Methanolic extracts were stored in pre-combusted glass vials at -20 ¡
C for return to
146
the UK. Prior to analysis, samples were evaporated to dryness using a vacuum solvent
147
evaporator (Biotage, Sweden) and redissolved in methanol-water (1:1 mixture).
148
Potential exists for organic matter to undergo molecular transformations, such as
149
trans-esterification of carboxylic acids and esters43, and acetal and hemi-acetal
150
formation44
, in methanolic extracts. Some of these changes may occur very rapidly,
151
over timescales of minutes, and so be effectively unavoidable. During longer-term
152
storage, it has been shown that methanolic extracts may undergo proton exchange but
153
not esterification or hemiacetal formation45
. Repeat analyses of our samples after
154
more than 12 months also suggests they are stable at -20 o C.
155
156
Aerosol samples were foil wrapped and frozen at -20¡C immediately following
157
collection for return to the UK. Aerosol material was extracted from the filters into
158
ultrapure water (Fisher LC-MS grade) by ultrasonication, and then extracted by SPE
159
as above. To allow direct comparison of seawater and aerosol SPE-DOM, the salinity
of the aqueous aerosol extracts was made up to that of seawater (~35 g L-1
) by adding
161
sodium chloride prior to SPE. As aerosol loadings were very low, extracts from three
162
or four consecutive aerosol samples of the same air mass origin (assigned using air
163
mass back trajectories from NOAA Hysplit 46
) were combined.
164
165
Mass spectrometric analysis 166
167
High performance liquid chromatography-ion trap mass spectrometry (LC-IT-MS). 168
The SPE-DOM sample extracts were first analyzed by LC-IT-MS using an HCT Plus
169
ion trap mass spectrometer (Bruker Daltonics GmbH, Bremen, Germany) coupled to
170
an Agilent 1100 series HPLC. A Pinnacle DB-C18 column with 5 μm particle size 171
(Restek, 4.6 x 150 mm) was used with 0.1% (v/v) formic acid in ultrapure water
172
(Optima LC-MS grade, Fisher, UK) and methanol (Optima LC-MS grade, Fisher,
173
UK) mobile phases and a flow rate of 0.6 mL min-1
. Gradient elution was performed
174
as follows: 0-13 minutes 20% methanol; 13-23 minutes increase to 60% methanol;
175
23-33 minutes, hold at 60% methanol; 33-43 minutes increase to 100% methanol;
43-176
50 minutes hold at 100% methanol; 50-53 minutes return to starting conditions; 53-59
177
minutes hold at starting conditions. Electrospray ionization was used with a source
178
temperature of 365¡
C, nebulizer pressure of 70 psi and drying gas (N2) flow rate of 12 179
L min-1
. The mass spectrometer was operated in alternating positive and negative ion
180
mode, with a scan range of m/z 50 - 1000 and a target mass setting of m/z 150. Mass
181
calibration was conducted using a standard containing arginine clusters
(Sigma-182
Aldrich). The mass accuracy ranged from ~ 100 to 2000 ppm, and the mass resolution
183
was 500 at m/z 200.
184
Fourier transform ion cyclotron resonance mass spectrometry (FT-ICR-MS).
SPE-186
DOM extracts were also analyzed by ultra-high mass resolution FT-ICR-MS with
187
electrospray ionization using a SolariX XR 9.4T instrument (Bruker Daltonics,
188
Coventry, UK). Samples were introduced by direct infusion at a flow rate of
189
120 μl hr-1
. The source temperature was 220 ¡
C, the nebulizer gas (N2) pressure was 190
1.2 bar and the drying gas flow rate was 4 L min-1
. Samples were analyzed separately
191
in positive and negative mode over a scan range of m/z 58 to 1200. Each sample was
192
analyzed twice, typically with 50 (negative mode) or 200 (positive mode) scans
193
collected per analysis. The mass resolution was ~140,000 at m/z 200. The instrument
194
was externally calibrated using sodium formate clusters. Negative mode FT-ICR-MS
195
spectra were internally recalibrated using the ubiquitous series of DOM anions
196
(C17H19O8
-, C18H21O8
-, C19H23O8
etc) proposed by Kujawinski et al., 200947. Positive
197
mode FT-ICR-MS spectra were internally calibrated using a combination of DOM
198
and common contaminant ions (e.g. proline, arginine, polyethylene glycol oligomers).
199
Aerosol SPE extracts were screened for selected ions using FT-ICR-MS in negative
200
mode, with conditions as above. Due to a lack of suitable ions, internal mass
201
calibration was not carried out for these samples.
202
203
Bulk compositional analysis was conducted for FT-ICR-MS data collected in the
204
negative mode, as this has been more widely reported in comparable previous studies.
205
Only m/z values that satisfied the following criteria were considered: (i) absent from
206
the procedural extraction blank (at a signal to noise ratio of at least four); (ii) present
207
in both analytical replicates; (iii) signal-to-noise ratio greater than ten. Molecular
208
formulae were generated using the SmartFormula functionality within DataAnalysis
209
4.1 software (Bruker Daltonics, Bremen, Germany), In addition to C, H and O, the
heteroatoms N, S and P were allowed, with a formula error limit of 1 ppm. Elemental
211
combinations were restricted according to rules adopted from similar previous work 22,
212
48-54
, see SI for further details.
213
214
High-performance liquid chromatography - quadrupole time-of-flight mass 215
spectrometry (LC-TOF-MS2).
A subset of microlayer and seawater extracts were
216
analyzed by LC-TOF-MS2
using a maXis 3G mass spectrometer (Bruker Daltonics,
217
Coventry, UK) coupled to a Dionex ultimate 3000 HPLC system (Thermo Scientific
218
Inc., UK). The column, mobile phases and gradient program were the same as those
219
used for LC-IT-MS analysis (see above), with the exception that HPLC grade water
220
(Fisher, UK) was used instead of LC-MS grade water. Differences in instrument
221
plumbing resulted in a slight retardation of retention times of ~2 minutes.
222
Electrospray ionization was used with a source temperature of 350¡C, nebulizer
223
pressure of 4 bar and drying gas (N2) flow rate of 9 L min -1
. Samples were analyzed in
224
positive and negative mode separately; in each mode external mass calibration was
225
conducted using Agilent low concentration tuning mix (part no. G1969-85000).
226
Fragmentation spectra for specified ions were acquired across a range of collision
227
energies (7-40 eV) in order to obtain good fragmentation spectra for as many ions as
228
possible.
229
230
The purpose of the LC-TOF-MS2
analysis was to allow high confidence assignment
231
of molecular formulae to selected ions of interest identified by LC-IT-MS. This was
232
achieved in two ways. Firstly, it provided more accurate m/z values for ions of interest
233
for which the retention time was known, so constrained the number of corresponding
234
peaks in the FT-ICR-MS spectra. FT-ICR-MS spectra of microlayer samples,
seawater samples and procedural blanks within this narrower m/z window were then
236
compared to identify ions present at appropriate relative abundances, and possible
237
molecular formulae for these were generated. Secondly, possible formulae for
238
fragment ions and constant neutral losses detected by LC-TOF-MS2
were used to
239
identify relationships between groups of ions and inform formula selection. This
240
information was combined with the FT-ICR-MS results in order to deduce probable
241
molecular formulae for the target ions.
242
243
Supporting parameters 244
The measurement of ice nucleating particles (INP) in untreated SML samples is
245
described in Wilson et al., 2015. In order to determine whether INP were retained
246
during the SPE extraction (Section 2.2), INP assays were also conducted on SML
247
extracts that had been dried and reconstituted in a salt-water matrix (35 g L-1) and a
248
matrix blank. The reconstitution volume was selected such that analyte concentrations
249
were returned to those in the original, untreated SML sample. This allowed direct
250
comparison of the extract IN activity with the microlayer IN activity measured in the
251
raw samples during cruise JR288 29 .
252
253
Total organic carbon content of untreated SML samples was measured using a
254
Shimadzu TOC-V analyzer, as described in Wilson et al., 2015. A suite of trace gases
255
(DMS, halocarbons, monoterpenes) were measured by purge-and-trap gas
256
chromatography mass spectrometry using the method described in 55, though we
257
caution that these results are semi-quantitative at best because microlayer sampling
258
methods were not gas-tight.
259
Results and discussion 261
262
Presence of microlayer enhanced ions revealed by LC-IT-MS 263
Low mass resolution LC-IT-MS analysis of all samples revealed differences in
264
organic composition, both between seawater and microlayer extracts, and within the
265
subset of microlayer extracts. Total ion chromatograms obtained using LC-IT-MS
266
showed a broad peak between 18 and 36 minutes in seawater and microlayer samples,
267
while procedural blanks did not (Figs S1a, S2a). This broad peak is thought to be due
268
to a large number of co-eluting, organic compounds present at low concentrations56 .
269
For some, but not all microlayer samples, discreet peaks appeared superimposed upon
270
the broader hump (Figs S1a, S2a), suggesting a small number of ions either present at
271
elevated levels, or with substantially higher ionization efficiencies. Base peak
272
chromatograms (which display the abundance of the most intense ion in the mass
273
spectra at each time point) confirmed the enhancement of selected ions in the
274
microlayer (Figs S1b, S2b). In contrast, seawater samples did not exhibit any discreet
275
peaks within this region.
276
277
Average mass spectra calculated for the 18-36 minute retention time region showed a
278
characteristic distribution of peaks separated by 14 Da (corresponding to a CH2 unit) 279
for all seawater samples (Fig S3). Note that the choice of instrumental parameters
280
(e.g. target mass) will influence the shape and center of the m/z distributions obtained,
281
as well as the response factors of individual ions, so only data obtained under the
282
same conditions can be directly compared. Average mass spectra were strikingly
283
similar for all seawater samples, suggesting homogeneity in the extracted organic
284
matter between sampling stations. Average mass spectra of microlayer samples
displayed additional peaks with higher relative intensity than observed in the seawater
286
samples (Fig S3). This is consistent with the presence of elevated concentrations of
287
certain ions in the microlayer compared to the underlying seawater.
288
289
LC-IT-MS chromatograms for microlayer sampling boat blanks did not contain these
290
enhanced species, and the average mass spectra appeared similar to those for the
291
seawater from which they were prepared (Figs S1, S2 and S3), suggesting they were
292
not the result of contamination during microlayer sampling.
293
294
Inspection of base peak chromatograms and average mass spectra obtained by
LT-IT-295
MS found 33 negative ions and 117 positive ions that were enhanced in microlayer
296
samples, and these ions were selected for further study. Peak areas (obtained from
297
extracted ion chromatograms) for these microlayer enhanced ions were normalized
298
according to aqueous extraction volume, and used as a proxy for their relative
299
abundances. As the sensitivity of ESI-MS varies across different compounds and as a
300
function of matrix, peak areas are only used to compare the same ions (at same
301
retention time and so approximately same matrix) across samples, and not to compare
302
abundances of different ions within or between samples.
303
304
Link between abundance of microlayer enhanced ions and ice nucleation activity 305
The microlayer samples had higher ice nucleation (IN) activity than the underlying
306
seawater, and this varied between stations (see Wilson et al., 2015). Ice nucleation
307
ability, quantified in terms of median freezing temperature (T50; the temperature at 308
which 50% of droplets had frozen), was correlated with the relative abundances of
309
some of the microlayer enhanced ions identified by LC-IT-MS analysis (Fig 2, Table
1). Considering the microlayer samples only, linear correlation coefficients of R2 >
311
0.5 were obtained for 7 negative ions and 27 positive ions (Table 1); for ease, these
312
ions are referred to as 'IN tracer ions' hereafter. To examine this relationship over a
313
wider linear range, correlation analysis was extended to include the measured IN
314
activity of diluted microlayer samples (1% and 10% by volume) and calculated ion
315
abundance, assuming that peak area scales linearly for the ions of interest. This
316
revealed strong exponential relationships between IN activity and IN tracer ion
317
relative abundance, with correlation coefficients of R2
> 0.8 in all but one case (Fig 2,
318
Table 1). Seawater samples also appear to broadly fit this relationship (Fig 2), but
319
were not included in quantitative correlation analysis as both ice nucleation ability
320
and peak area were at or very close to the limit of detection.
321
323
324
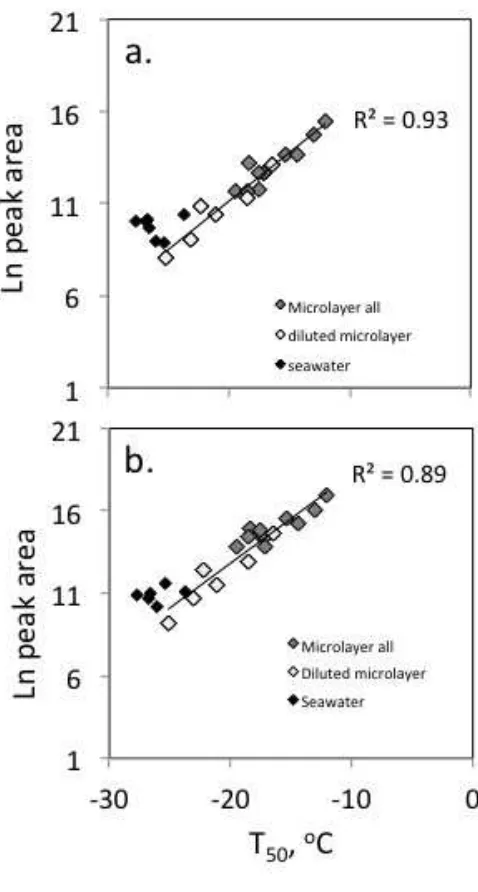
Figure 2. Natural log of volume normalized peak area plotted against 50% freezing
325
temperature, for ions with (a) retention time 30.8 mins, [M-H]-
= 289.2 and (b)
326
retention time 38.5 mins, [M+H]+
= 285.2 for microlayer (grey diamonds) and
327
seawater (black diamonds) samples, and microlayer samples diluted with ultrapure
328
water to 10 and 1% by volume (white diamonds). Lines of best fit and correlation
329
coefficients are for microlayer (whole and diluted) only, assuming peak area scales
[image:17.595.122.361.89.535.2]linearly with sample dilution; seawater values were excluded from correlation
331
analysis as they were at or close to the limit of detection for both ice nucleation ability
332
and peak area.
333
334
The correlations between IN tracer ion abundance and T50 for microlayer samples are 335
comparable or greater than that identified between T50 and TOC content of the 336
microlayer (R2
= 0.51). For many ions, the relationship between ion abundance and
337
IN activity was also stronger than that between ion abundance and TOC (Table 1).
338
The IN tracer ions were variably correlated with TOC (Table 1), consistent with
339
compositional differences between the SML samples, rather than solely a
340
homogenous DOC pool present at varying concentrations.
341
342
IN assays of reconstituted SPE extracts yielded freezing curves that were very similar
343
to those of the salt-water matrix (Fig. S4) and of the fresh seawater analyzed
344
immediately following collection29. The elevated freezing temperatures characteristic
345
of the raw microlayer samples29
were not observed in the reconstituted SPE extracts.
346
This implies that the INPs are not extracted and/or preserved by the SPE protocol, and
347
that the IN tracer ions are only associated with INPs, but do not contribute directly to
348
ice nucleation.
349
350
351
352
353
Table 1. Formula assignment, correlation coefficients (R2) and enrichment factors (EF) for ice nucleation tracer ions that were enhanced the 355
SML, in order of retention time (tR).
356
tR,
mins
Mode Exact m/z Suggested
formula
Formula
error,
ppm
Adduct Fragment ions R2
Peak
area vs.
T50
R2
Ln(peak
area)
vs. T50* R2
Peak
area vs.
TOC
EF
range
23.1 + 187.09647 C9H14O4 0.08 [M+H]+ b 0.56 0.87 0.62 12 - 436
23.9 + 273.13086 C11H22O6 -0.00 [M+Na]+ a 0.52 0.85 0.56 16 - 85
24.3 + 197.11723 C11H16O3 -0.05 [M+H]+ 179.11, 161.10, (135), 133.10, 107.09,
93.07
0.55 0.84 0.85 29 -
1502
26.5 - 261.13429 C12H22O6 -0.27 [M-H]- 187.09, 125.09 0.52 0.85 0.52 2 - 175
28.6 + 285.13105
285.16727
C12H22O6
C13H26O5
C19H25S+
-0.65
-0.09
-0.43
[M+Na]+
[M+Na]+
a 0.58 0.81 0.26 8 - 167
29.4 + 125.09606 C8H12O 0.25 [M+H]+ a 0.61 0.90 0.55 6 - 97
29.7 + 299.14675 C13H24O6 -0.80 [M+Na]+ 73.6079 0.56 0.80 0.26 14 - 101
30.7 + 273.13086
273.16968
C11H22O6
C14H24O5
0.00
-0.11
[M+Na]+
[M+H]+
c 0.58 0.86 0.48 6 - 50
30.8 - 289.15757
289.16557
C14H27O4P
C14H26O6
0.61
-0.31
[M-H]-
[M-H]
-215.12 0.71 0.93 0.50 5 - 115
31.0 + 315.17790 C14H28O6 -0.30 [M+Na]+ a 0.52 0.81 0.42 28 - 272
31.5 - 187.13382 C10H20O3 -0.46 [M-H]- 167.10, 151.04, 141.12, 112.98 0.56 0.87 0.53 35 - 647
31.6 + 171.13797 C10H18O2 -0.08 [M+H]+ 153.13, 135.12, 107.09 0.55 0.86 0.54 12 - 266
31.7 + 273.16968 C14H24O5 -0.11 [M+H]+ 153.13, 135.12 0.57 0.81 0.39 11 - 399
31.8 - 289.15757
289.16557
C14H27O4P
C14H26O6
0.61
-0.31
[M-H]-
[M-H]
-215.12, 197.11 0.61 0.86 0.46 23 - 894
31.9 + 257.17489 C14H24O4 -0.60 [M+H]+ 211.08, 147.12, 137.13, 95.09 0.52 0.82 0.60 3 - 326
33.9 + 187.13281 C10H18O3 0.33 [M+H]+ 173.12, 155.11, 137.10, 119.09, 109.10,
95.09
0.53 0.86 0.57 41 - 744
34.0 + 241.14100 C11H22O4 -0.12 [M+Na]+ 209.12 0.54 0.81 0.41 82 -
1952
35.7 + 241.14100 C11H22O4 0.12 [M+Na]+ 209.12 0.58 0.85 0.68 15 - 273
5512
36.7 - 201.14952 C11H22O3 0.49 [M-H]- 155.14 0.55 0.87 0.69 386 -
12931
36.7 + 149.13246 C11H16 0.11 [M+H]+ 121.10, 109.10, 107.09, 95.09 0.56 0.87 0.69 17 - 625
36.7 + 185.15361 C11H20O2 -0.02 [M+H]+ 167.14, 149.13, 121.10, 109.10, 95.09,
83.09, 81.07
0.56 0.87 0.71 86 -
1927
38.5 + 285.20581 C16H28O4 0.79 [M+H]+ b 0.66 0.89 0.53 17-67
39.1 + 125.13251 C9H16 -0.26 [M+H]+ c 0.52 0.87 0.67 9 - 114
39.2 - 236.11384 C20H42O8S2 -0.85 [M-2H]2- 375.24, 96.96 0.64 0.84 0.29 52 -
1944
40.1 - 236.11384 C20H42O8S2 -0.85 [M-2H]2- 375.24, 195.13, 154.06, 96.96 0.64 0.78 0.16 25 -
3728
40.7 + 257.17464 C14H24O4 -0.37 [M+H]+ 201.15, 183.14, 165.13, 147.12, 137.13,
123.12, 95.09
0.53 0.84 0.49 8 - 244
Where two different m/z are listed, it was not possible to unambiguously identify the tracer ion in the FT-ICR-MS spectra. Where fragment ions
357
are not given either (a) the ion did not fragment, (b) the fragmentation spectra were of very low intensity, or (c) the tracer ion was not apparent in
358
the LC-TOF-MS2
chromatogram. Rows shaded grey indicate formulae that are related to each other by the loss or gain of water molecules, so
359
may indicate adducts of the same compound. Correlation coefficients are shown for relative abundance versus ice nucleation ability, measured as
360
median freezing temperature (T50), and total organic carbon content (TOC). *Correlation of Ln(peak area) against T50 includes diluted microlayer
samples. Enrichment factors are estimated as the ratio of the peak area in a microlayer sample to that in the corresponding seawater sample,
362
following adjustment for extraction volume; the range for all microlayer samples is shown.
Identity and potential origin of IN tracer ions
364
Microlayer enhanced peaks (and high IN activity) were particularly common and 365
abundant at station 12, and also stations 6, 12.5 and 19 (Figs S1, S2 and S3). The 366
underlying water at stations 6, 12, 12.5 and 19 did not exhibit any distinctive features 367
in either total or size-segregated chlorophyll concentrations (C. Hughes, University of 368
York, unpub. data), or the chlorophyll contribution of individual phytoplankton 369
groups derived from pigment analysis (A. Small, Oxford University, unpub. data). 370
Similarly, there was no apparent relationship between the variation in SML 371
composition (as determined here) or freezing temperature (as presented in Wilson et 372
al.29
) and the numbers of bacteria present (cell count data presented in Wilson et al.29
). 373
Examination of temperature-salinity profiles, and the shipboard wind speed and 374
ambient light levels at the time of sampling, and in the 6 and 24 hours prior to the 375
SML sampling, also failed to show any corresponding trends. Interestingly, semi-376
quantitative determinations of the biogenic trace gases dimethyl sulfide, methyl 377
iodide, bromochloromethane and di-iodomethane revealed that these gases also 378
tended to be present at higher levels in microlayer samples 6, 12, 12.5 and 19 than in 379
other samples (Fig S5). These stations were also unusual in that ethyl and propyl 380
iodide were observed. From the above consideration of the available supporting 381
evidence, a single factor associated with the relative abundance of IN tracer ions (and 382
high INPs themselves) cannot be identified, but the associations with TOC and 383
biogenic trace gases point towards a biological and/or photochemical influence. 384
385
The nature of marine INPs has not yet been fully elucidated, but evidence suggests 386
they originate from marine phytoplankton or bacteria60-64
. Phytoplankton cell exudates 387
have both been suggested as possible sources29, 36, 63
. Laboratory mesocosm 389
experiments found that peaks in airborne IN activity coincided with increases in 390
relatively aliphatic rich, low O/C organic material in submicron SSA; these changes 391
were ascribed to phytoplankton cell lysis under conditions of relatively low bacterial 392
lipase activity36, 64, 65
. Cell breakage may occur in the surface ocean, with subsequent 393
concentration of the products in the SML, or the process may be enhanced in the SML 394
itself. Enrichments of mannose and arabinose in the SML have previously been 395
attributed to phytoplankton cell degradation66
. Aller et al.67
observed an increased 396
proportion of membrane damaged cells in the SML, and suggested this might be due 397
to the increased potential for viral infection, zooplankton grazing and physical 398
stresses in the microlayer. Either process could potentially result in increased 399
abundances of INPs and other biogenic material in the SML. We hypothesize that the 400
IN tracer ions originate from a phytoplankton exudate mix (including any associated 401
bacteria and viruses), of which larger sized constituents confer the IN activity. 402
403
Phytoplankton are known to release a wide variety of organic compounds, ranging in 404
size from volatile gases of less than 100 Da to macromolecules and colloids of several 405
1000 Da. As a result of sample processing and instrumental constraints, this study 406
(and all others using similar approaches), considers only an operationally defined 407
fraction of the total organic matter present. Specifically, the analytical approaches 408
used here have targeted compounds that are low molecular weight (<1000 m/z), water
409
soluble, neither strongly hydrophobic or strongly hydrophilic, and easily ionizable by 410
electrospray. High-resolution mass spectrometry was used to elucidate molecular 411
formulae for the IN tracer ions (Table 1). Searches of online databases (e.g. 412
formula or more. Our data is insufficient to distinguish between these isomers, so we 414
can only explore whether the IN formulae are consistent with algal exudates. For 415
example, known algal metabolites with similar carbon numbers to the IN tracer ions 416
include polyunsaturated aldehydes (PUAs; e.g. decatrienal, C10H14O) 68
and 417
unsaturated hydrocarbons (e.g. fucoserratene, C8H12; dictyopterenes, C11H18) 69
. Two 418
tracer ion formulae exactly match those of compounds from these classes: isomers of 419
C8H12O include the PUA octadienal, while those of C11H16 include the algal hormone
420
hormosirene70
. Other tracer ions have formulae consistent with oxygenated organics 421
(e.g. C8H14O3, C12H16O3) formed when PUAs are produced by the cleavage of higher
422
molecular weight polyunsaturated fatty acids (PUFA)71
. PUAs are mainly produced 423
by diatoms, as a response to cell wounding, for example by zooplankton grazing 72
; 424
the elevated levels of DMS (and potentially halocarbons) observed in the samples 425
with high levels of the IN tracer ions are indicative of grazing having taken place at 426
these locations73
. It is beyond the scope of this work to prove that the IN tracer ions 427
were indeed derived from PUAs, but we speculate that cellular damage (e.g. by 428
grazing, stress or viral infection) could cause the simultaneous release of PUAs, trace 429
gases and INPs. 430
431
The IN tracer ions were massively enriched in the SML, with enrichment factors 432
ranging from ~2 to 12931 (Table 1). Such EF values are several orders of magnitude 433
greater than observed for dissolved organic carbon and other organic molecules 12
, 434
supporting the possibility that the tracer ions were formed in-situ. One possible
435
mechanism for this is the photo-chemical modification of organic matter within the 436
SML. Many have formulae consistent with fatty acid and dicarboxylic acid groups, 437
e.g. saturated oxo-fatty acids (CnH2n-2O3), and unsaturated dicarboxylic acids (CnH
4O4), which have been tentatively identified in nascent see spray aerosol 74
. 439
Compounds of these classes, including nine with identical formulae to the IN tracer 440
ions, have been found to increase in abundance following the irradiation of cellular 441
material from freshwater aquatic biofilms75
. More generally, the photochemical 442
production of low molecular weight, saturated and unsaturated, carbonyl compounds 443
has been demonstrated in natural microlayer samples and model systems4, 5, 16, 76
. 444
Alternative oxidation mechanisms include the oxidation of unsaturated organic 445
compounds by ozone at the air-sea interface77
, or bacterial metabolism in the SML1, 28
. 446
Formation of the IN tracer ions within the SML by abiotic reactions or bacterial 447
breakdown is not incompatible with a link to phytoplankton described above, as this 448
may supply the precursor material. 449
450
Semi-quantitative comparison of seawater and microlayer SPE-DOM
451
composition using FT-ICR-MS
452
Mass spectra obtained using the high resolution FT-ICR-MS echoed the general 453
trends suggested by the LC-IT-MS analysis, described earlier. Seawater samples were 454
similar across stations, even at the fine scale. The negative mode high-resolution mass 455
spectra for seawater samples visually resemble those obtained in other studies22, 47, 57,
456
58
. As mentioned earlier, it should be noted that relative ion intensities across the m/z
457
range scanned are in part a function of user selected instrument settings. Previous 458
studies have also reported a high level of homogeneity between SPE-DOM mass 459
spectra for surface seawater samples57, 58. 460
461
In contrast, SML samples displayed differences both from seawater and each other, 462
tended to contain peaks across a wider m/z range than the seawater spectra, and have
464
more high intensity spikes. In the negative mode, higher molecular weight peaks (m/z
465
~700 to 900) were particularly prominent in SML samples 6 and 12.5, which also had 466
high IN activity. 467
468
The visual contrast between seawater and SML spectra resembles the differences 469
observed between ESI-FT-ICR mass spectra of underlying seawater and SML from an 470
estuary, where enhancement of surfactant peaks has been observed22
. Interestingly, 471
seawater samples incubated with different microbial communities have also been 472
shown to exhibit comparable differences in low molecular weight DOM 473
composition59. In that study, plankton larger than ~1 m were removed from 474
seawater, resulting in a microbial community dominated by heterotopic bacteria. 475
High-resolution mass spectra from these incubations revealed the presence of unique, 476
high-abundance ions that were not present in spectra from whole water, and overall 477
had higher average H/C ratios and lower DBE values59
. In light of these findings, it 478
seems plausible that differences in the DOM composition of the microlayer relative to 479
seawater observed here could, at least in part, reflect the differing microbial 480
communities in each. 481
482
In the positive mode LC-IT-MS average spectra, there is some indication that the 483
microlayer may be depleted in compounds at the higher molecular weight end of the 484
detection envelope (m/z 200-400; Fig S2) relative to seawater. This is in agreement
485
with the shift to smaller molecular size in the microlayer observed by Lechtenfeld et 486
al.22, which was attributed to photochemical and microbiological degradation. 487
suggested the presence of additional higher molecular weight (m/z ~700 to 900) peaks
489
in some SML samples that were absent from seawater (Fig S6). These peaks were not 490
present in the LC-IT-MS average mass spectra (Supp info Fig S3A), probably because 491
they have long retention times and did not elute in the time window of interest. 492
493
Assignment of molecular formulae to negatively charged ions detected by FT-ICR-494
MS is described in the SI. Formula assignment for complex organic mixtures, where 495
multiple heteratoms must be considered, can be ambiguous78, 79
, and we consider our 496
results to be subject to uncertainty. Average DBE values and H/C ratios suggested 497
SPE-DOM from the microlayer was slightly more aliphatic than that from seawater 498
(Table S2). A tendency towards higher saturation and decreased aromaticity in the 499
microlayer relative to the underlying seawater has been observed previously19, 22, and 500
is consistent with the enhancement of hydrophobic substances in the microlayer. That 501
the SML was more aliphatic than the underlying water, and also had higher IN 502
activity, is consistent with the observation of an association between IN activity and 503
more aliphatic material in SSA36, 64, 65
. However, we did not observe trends in average 504
elemental rations or DBE values within the SML subset that co-varied with IN 505
activity. 506
507
Possible occurrence of SML derived compounds in atmospheric aerosol
508
The presence of relatively low molecular weight, highly oxygenated compounds in 509
the sea surface microlayer, raises the possibility that primary sea spray aerosol may 510
also contribute to the atmospheric aerosol burden of such compounds in the marine 511
environment. FT-ICR-MS identified ions with the same molecular formulae as five of 512
sampled in the Greenland Sea during the July-August 2013, but not March 2013 514
(Table S3).Good agreement between observed spectra and simulated isotopic patterns 515
(indicated by a relatively low mSigma value) confirmed that the molecular formulae 516
agreed. These ions were absent from the aerosol sampling procedural blanks. The 517
possible occurrence of IN tracer ions in ambient atmospheric aerosol is consistent 518
with the transfer of material, possibly including INPs, from the microlayer to sea 519
spray aerosol. It has recently been demonstrated that SSA produced by wave breaking 520
contains INPs at levels in agreement with ambient INP measurements made over the 521
oceans36
. That the IN tracer ions were only found in aerosol collected during the 522
summer, and not the early spring, is consistent with a biological source for these ions. 523
524
525
526
Acknowledgements
527
We acknowledge funding from the NERC ACCACIA (Aerosol-Cloud Coupling And 528
Climate Interactions in the Arctic) project (NE/I028769/1), and are grateful to the 529
Principal Investigator Prof Ian Brooks and to the cast and crew of the R/V Lance
530
March 2013 and JR288 July 2013 cruises. The York Centre of Excellence in Mass 531
Spectrometry was created thanks to a major capital investment through Science City 532
York, supported by Yorkshire Forward with funds from the Northern Way Initiative. 533
We thank Ed Bergstršm and David Ashford for assistance with FT-ICR-MS and 534
maXis LT-TOF-MS2 analyses respectively. The authors gratefully acknowledge the 535
NOAA Air Resources Laboratory (ARL) for the provision of the HYSPLIT transport 536
and dispersion model and/or READY website (http://www.ready.noaa.gov) used in 537
this publication. 538
Supporting information. The FT-ICR-MS formula assignment procedure is 540
described in the SI. Table S1 contains microlayer (and seawater) sampling 541
information, and Table S2 contains average elemental composition information 542
derived from FT-ICR-MS analysis of these samples. Table S3 provides details of 543
aerosol sample collection, air mass origin and presence/absence of IN tracer ions. 544
Total ion and base peak chromatograms obtained by LC-IT-MS for all samples are 545
shown in Figures S1 and S2, and average mass spectra from these analyses are 546
compared in Figure S3. Figure S4 shows freezing curves for reconstituted microlayer 547
extracts, and raw microlayer and seawater extracts. Figure S5 compares the relative 548
abundance of selected IN tracer ions with approximate concentrations of trace gases 549
in microlayer samples. Negative mode FT-ICR mass spectra for seawater, microlayer 550
and procedural blanks are shown in Figure S6, numbers of molecular formulae found 551
in each sample type are given in Figure S7 (Venn diagram), and Figure S8 is a van 552
Krevelen plot of these results. This information is available free of charge via the 553
Internet at http://pubs.acs.org. 554
555
556
References
557
558
1. Cunliffe, M.; Engel, A.; Frka, S.; Gasparovic, B.; Guitart, C.; Murrell, J. C.; 559
Salter, M.; Stolle, C.; Upstill-Goddard, R.; Wurl, O. Sea surface microlayers: A 560
unified physicochemical and biological perspective of the air-ocean interface. 561
Prog. Oceanogr. 2013,109, 104-116.
562
2. Wurl, O.; Wurl, E.; Miller, L.; Johnson, K.; Vagle, S. Formation and global 563
distribution of sea-surface microlayers. Biogeosciences 2011,8 (1), 121-135. 564
3. Sabbaghzadeh, B.; Upstill-Goddard, R. C.; Beale, R.; Pereira, R.; Nightingale, 565
P. D. The Atlantic Ocean surface microlayer from 50 degrees N to 50 degrees S is 566
ubiquitously enriched in surfactants at wind speeds up to 13ms(-1). Geophys.
567
Res. Lett. 2017,44 (6), 2852-2858.
568
4. Ciuraru, R.; Fine, L.; van Pinxteren, M.; D'Anna, B.; Herrmann, H.; George, 569
C. Unravelling New Processes at Interfaces: Photochemical Isoprene Production 570
5. Ciuraru, R.; Fine, L.; van Pinxteren, M.; D'Anna, B.; Herrmann, H.; George, 572
C. Photosensitized production of functionalized and unsaturated organic 573
compounds at the air-sea interface. Scientific Reports 2015,5. 574
6. Ebling, A. M.; Landing, W. M. Sampling and analysis of the sea surface 575
microlayer for dissolved and particulate trace elements. Mar. Chem. 2015,177, 576
134-142. 577
7. Shaw, M. D.; Carpenter, L. J. Modification of Ozone Deposition and I-2 578
Emissions at the Air-Aqueous Interface by Dissolved Organic Carbon of Marine 579
Origin. Environ. Sci. Technol. 2013,47 (19), 10947-10954. 580
8. del Vento, S.; Dachs, J. Influence of the surface microlayer on atmospheric 581
deposition of aerosols and polycyclic aromatic hydrocarbons. Atmos. Environ.
582
2007,41 (23), 4920-4930.
583
9. Frew, N. M.; Bock, E. J.; Schimpf, U.; Hara, T.; Haussecker, H.; Edson, J. B.; 584
McGillis, W. R.; Nelson, R. K.; McKenna, S. P.; Uz, B. M.; Jahne, B. Air-sea gas 585
transfer: Its dependence on wind stress, small-scale roughness, and surface films. 586
J. Geophys. Res.: Oceans 2004,109 (C8), 23.
587
10. Donaldson, D. J.; George, C. Sea-Surface Chemistry and Its Impact on the 588
Marine Boundary Layer. Environ. Sci. Technol. 2012,46 (19), 10385-10389. 589
11. Blanchard, D. C. Sea-to-air transport of surface active material. Science
590
1964,146 (364), 396-&.
591
12. Quinn, P. K.; Collins, D. B.; Grassian, V. H.; Prather, K. A.; Bates, T. S. 592
Chemistry and Related Properties of Freshly Emitted Sea Spray Aerosol. Chem.
593
Rev. 2015,115 (10), 4383-4399.
594
13. Leck, C.; Bigg, E. K. Biogenic particles in the surface microlayer and 595
overlaying atmosphere in the central Arctic Ocean during summer. Tellus Series
596
B-Chemical and Physical Meteorology 2005,57 (4), 305-316.
597
14. Roslan, R. N.; Hanif, N. M.; Othman, M. R.; Azmi, W.; Yan, X. X.; Ali, M. M.; 598
Mohamed, C. A. R.; Latif, M. T. Surfactants in the sea-surface microlayer and their 599
contribution to atmospheric aerosols around coastal areas of the Malaysian 600
peninsula. Marine Pollution Bulletin 2010,60 (9), 1584-1590. 601
15. Mungall, E. L.; Abbatt, J. P. D.; Wentzell, J. J. B.; Lee, A. K. Y.; Thomas, J. L.; 602
Blais, M.; Gosselin, M.; Miller, L. A.; Papakyriakou, T.; Willis, M. D.; Liggio, J. 603
Microlayer source of oxygenated volatile organic compounds in the summertime 604
marine Arctic boundary layer. Proc. Natl. Acad. Sci. U.S.A. 2017,114 (24), 6203-605
6208. 606
16. Zhou, X. L.; Mopper, K. Photochemical production of low-molecular-607
weight carbonyl compounds in seawater and surface microlayer and their air-sea 608
exchange. Mar. Chem. 1997,56 (3-4), 201-213. 609
17. van Pinxteren, M.; Muller, C.; Iinuma, Y.; Stolle, C.; Herrmann, H. Chemical 610
Characterization of Dissolved Organic Compounds from Coastal Sea Surface 611
Micro layers (Baltic Sea, Germany). Environ. Sci. Technol. 2012,46 (19), 10455-612
10462. 613
18. Antonowicz, J. P. Daily cycle of variability contents of phosphorus forms in 614
surface microlayer of a light salinity Baltic Sea Lagoon lake (North Poland) - Part 615
II. Central European Journal of Chemistry 2013,11 (5), 817-826.
616
19. Calace, N.; Mirante, S.; Petronio, B. M.; Pietroletti, M.; Rugo, C. Fulvic acid 617
enrichment in the microlayer of the Gerlache Inlet sea (Antarctica): Preliminary 618
results. International Journal of Environmental Analytical Chemistry 2004,84 (6-619
20. Garcia-Flor, N.; Guitart, C.; Abalos, M.; Dachs, J.; Bayona, J. M.; Albaiges, J. 621
Enrichment of organochlorine contaminants in the sea surface microlayer: An 622
organic carbon-driven process. Mar. Chem. 2005,96 (3-4), 331-345. 623
21. Hardy, J. T.; Cleary, J. Surface microlayer contamination and toxicity in the 624
German Bight. Mar. Ecol. Prog. Ser. 1992,91 (1-3), 203-210. 625
22. Lechtenfeld, O. J.; Koch, B. P.; Gasparovic, B.; Frka, S.; Witt, M.; Kattner, G. 626
The influence of salinity on the molecular and optical properties of surface 627
microlayers in a karstic estuary. Mar. Chem. 2013,150, 25-38. 628
23. Galgani, L.; Piontek, J.; Engel, A. Biopolymers form a gelatinous microlayer 629
at the air-sea interface when Arctic sea ice melts. Scientific Reports 2016,6, 10. 630
24. Cincinelli, A.; Stortini, A. M.; Perugini, M.; Checchini, L.; Lepri, L. Organic 631
pollutants in sea-surface microlayer and aerosol in the coastal environment of 632
Leghorn - (Tyrrhenian Sea). Mar. Chem. 2001,76 (1-2), 77-98. 633
25. Jayarathne, T.; Sultana, C. M.; Lee, C.; Malfatti, F.; Cox, J. L.; Pendergraft, M. 634
A.; Moore, K. A.; Azam, F.; Tivanski, A. V.; Cappa, C. D.; Bertram, T. H.; Grassian, V. 635
H.; Prather, K. A.; Stone, E. A. Enrichment of Saccharides and Divalent Cations in 636
Sea Spray Aerosol During Two Phytoplankton Blooms. Environ. Sci. Technol.
637
2016,50 (21), 11511-11520.
638
26. Gao, Q.; Leck, C.; Rauschenberg, C.; Matrai, P. A. On the chemical dynamics 639
of extracellular polysaccharides in the high Arctic surface microlayer. Ocean
640
Science 2012,8 (4), 401-418.
641
27. Kuznetsova, M.; Lee, C.; Aller, J. Characterization of the proteinaceous 642
matter in marine aerosols. Mar. Chem. 2005,96 (3-4), 359-377. 643
28. Kuznetsova, M.; Lee, C. Enhanced extracellular enzymatic peptide 644
hydrolysis in the sea-surface microlayer. Mar. Chem. 2001,73 (3-4), 319-332. 645
29. Wilson, T. W.; Ladino, L. A.; Alpert, P. A.; Breckels, M. N.; Brooks, I. M.; 646
Browse, J.; Burrows, S. M.; Carslaw, K. S.; Huffman, J. A.; Judd, C.; Kilthau, W. P.; 647
Mason, R. H.; McFiggans, G.; Miller, L. A.; Najera, J. J.; Polishchuk, E.; Rae, S.; 648
Schiller, C. L.; Si, M.; Temprado, J. V.; Whale, T. F.; Wong, J. P. S.; Wurl, O.; Yakobi-649
Hancock, J. D.; Abbatt, J. P. D.; Aller, J. Y.; Bertram, A. K.; Knopf, D. A.; Murray, B. J. 650
A marine biogenic source of atmospheric ice-nucleating particles. Nature 2015,
651
525 (7568), 234-. 652
30. Bigg, E. K. Ice nucleus concentrations in remote areas. Journal of the
653
Atmospheric Sciences 1973,30 (6), 1153-1157.
654
31. Bigg, E. K. Ice forming nuclei in the high Arctic. Tellus Series B-Chemical
655
and Physical Meteorology 1996,48 (2), 223-233.
656
32. Schnell, R. C. Ice nuclei in seawater, fog water and marine air off the coast 657
of Nova-Scotia - summer 1975. Journal of the Atmospheric Sciences 1977,34 (8), 658
1299-1305. 659
33. Schnell, R. C.; Vali, G. Freezing nuclei in marine waters. Tellus 1975,27
660
(3), 321-323. 661
34. Schnell, R. C.; Vali, G. Biogenic ice nuclei. 1. Terrestrial and marine 662
sources. Journal of the Atmospheric Sciences 1976,33 (8), 1554-1564. 663
35. Rosinski, J.; Haagenson, P. L.; Nagamoto, C. T.; Parungo, F. Nature of ice-664
forming nuclei in marine air masses. Journal of Aerosol Science 1987,18 (3), 291-665
. 666
36. DeMott, P. J.; Hill, T. C. J.; McCluskey, C. S.; Prather, K. A.; Collins, D. B.; 667
Sullivan, R. C.; Ruppel, M. J.; Mason, R. H.; Irish, V. E.; Lee, T.; Hwang, C. Y.; Rhee, T. 668
Abbatt, J.; Lee, C.; Sultana, C. M.; Ault, A. P.; Axson, J. L.; Martinez, M. D.; Venero, I.; 670
Santos-Figueroa, G.; Stokes, M. D.; Deane, G. B.; Mayol-Bracero, O. L.; Grassian, V. 671
H.; Bertram, T. H.; Bertram, A. K.; Moffett, B. F.; Franc, G. D. Sea spray aerosol as a 672
unique source of ice nucleating particles. Proc. Natl. Acad. Sci. U.S.A. 2016,113
673
(21), 5797-5803. 674
37. Burrows, S. M.; Hoose, C.; Poschl, U.; Lawrence, M. G. Ice nuclei in marine 675
air: biogenic particles or dust? Atmos. Chem. Phys. 2013,13 (1), 245-267. 676
38. Vergara-Temprado, J.; Murray, B. J.; Wilson, T. W.; O'Sullivan, D.; Browse, 677
J.; Pringle, K. J.; Ardon-Dryer, K.; Bertram, A. K.; Burrows, S. M.; Ceburnis, D.; 678
DeMott, P. J.; Mason, R. H.; O'Dowd, C. D.; Rinaldi, M.; Carslaw, K. S. Contribution 679
of feldspar and marine organic aerosols to global ice nucleating particle 680
concentrations. Atmos. Chem. Phys. 2017,17 (5), 3637-3658. 681
39. Knulst, J. C.; Rosenberger, D.; Thompson, B.; Paatero, J. Intensive sea 682
surface microlayer investigations of open leads in the pack ice during Arctic 683
Ocean 2001 expedition. Langmuir 2003,19 (24), 10194-10199. 684
40. Schlitzer, R. Ocean Data View, http://odv.awi.de: 2014. 685
41. Dittmar, T.; Koch, B.; Hertkorn, N.; Kattner, G. A simple and efficient 686
method for the solid-phase extraction of dissolved organic matter (SPE-DOM) 687
from seawater. Limnology and Oceanography-Methods 2008,6, 230-235. 688
42. Longnecker, K. Dissolved organic matter in newly formed sea ice and 689
surface seawater. Geochim. Cosmochim. Acta 2015,171, 39-49. 690
43. McIntyre, C.; McRae, C. Proposed guidelines for sample preparation and 691
ESI-MS analysis of humic substances to avoid self-esterification. Organic
692
Geochemistry 2005,36 (4), 543-553.
693
44. Bateman, A. P.; Walser, M. L.; Desyaterik, Y.; Laskin, J.; Laskin, A.; 694
Nizkorodov, S. A. The effect of solvent on the analysis of secondary organic 695
aerosol using electrospray ionization mass spectrometry. Environ. Sci. Technol.
696
2008,42 (19), 7341-7346.
697
45. Flerus, R.; Koch, B. P.; Schmitt-Kopplin, P.; Witt, M.; Kattner, G. Molecular 698
level investigation of reactions between dissolved organic matter and extraction 699
solvents using FT-ICR MS. Mar. Chem. 2011,124 (1-4), 100-107. 700
46. Stein, A. F.; Draxler, R. R.; Rolph, G. D.; Stunder, B. J. B.; Cohen, M. D.; Ngan, 701
F. NOAA's HYSPLIT atmospheric transport and dispersion modeling system. 702
Bulletin American Meteorological Society 2015,96, 2059-2077.
703
47. Kujawinski, E. B.; Longnecker, K.; Blough, N. V.; Del Vecchio, R.; Finlay, L.; 704
Kitner, J. B.; Giovannoni, S. J. Identification of possible source markers in marine 705
dissolved organic matter using ultrahigh resolution mass spectrometry. Geochim.
706
Cosmochim. Acta 2009,73 (15), 4384-4399.
707
48. Hertkorn, N.; Harir, M.; Koch, B. P.; Michalke, B.; Schmitt-Kopplin, P. High-708
field NMR spectroscopy and FTICR mass spectrometry: powerful discovery tools 709
for the molecular level characterization of marine dissolved organic matter. 710
Biogeosciences 2013,10 (3), 1583-1624.
711
49. Hawkes, J. A.; Hansen, C. T.; Goldhammer, T.; Bach, W.; Dittmar, T. 712
Molecular alteration of marine dissolved organic matter under experimental 713
hydrothermal conditions. Geochim. Cosmochim. Acta 2016,175, 68-85. 714
50. Schmitt-Kopplin, P.; Liger-Belair, G.; Koch, B. P.; Flerus, R.; Kattner, G.; 715
Harir, M.; Kanawati, B.; Lucio, M.; Tziotis, D.; Hertkorn, N.; Gebefugi, I. Dissolved 716
organic matter in sea spray: a transfer study from marine surface water to 717
51. Stubbins, A.; Spencer, R. G. M.; Chen, H. M.; Hatcher, P. G.; Mopper, K.; 719
Hernes, P. J.; Mwamba, V. L.; Mangangu, A. M.; Wabakanghanzi, J. N.; Six, J. 720
Illuminated darkness: Molecular signatures of Congo River dissolved organic 721
matter and its photochemical alteration as revealed by ultrahigh precision mass 722
spectrometry. Limnol. Oceanogr. 2010,55 (4), 1467-1477. 723
52. Gurganus, S. C.; Wozniak, A. S.; Hatcher, P. G. Molecular characteristics of 724
the water soluble organic matter in size-fractionated aerosols collected over the 725
North Atlantic Ocean. Mar. Chem. 2015,170, 37-48. 726
53. Kujawinski, E. B.; Behn, M. D. Automated analysis of electrospray 727
ionization Fourier transform ion cyclotron resonance mass spectra of natural 728
organic matter. Anal. Chem. 2006,78 (13), 4363-4373. 729
54. Wozniak, A. S.; Bauer, J. E.; Sleighter, R. L.; Dickhut, R. M.; Hatcher, P. G. 730
Technical Note: Molecular characterization of aerosol-derived water soluble 731
organic carbon using ultrahigh resolution electrospray ionization Fourier 732
transform ion cyclotron resonance mass spectrometry. Atmos. Chem. Phys. 2008,
733
8 (17), 5099-5111. 734
55. Andrews, S. J.; Hackenberg, S. C.; Carpenter, L. J. Technical Note: A fully 735
automated purge and trap GC-MS system for quantification of volatile organic 736
compound (VOC) fluxes between the ocean and atmosphere. Ocean Sci. 2015,11
737
(2), 313-321. 738
56. Dittmar, T.; Whitehead, K.; Minor, E. C.; Koch, B. P. Tracing terrigenous 739
dissolved organic matter and its photochemical decay in the ocean by using 740
liquid chromatography/mass spectrometry. Mar. Chem. 2007,107 (3), 378-387. 741
57. Flerus, R.; Lechtenfeld, O. J.; Koch, B. P.; McCallister, S. L.; Schmitt-Kopplin, 742
P.; Benner, R.; Kaiser, K.; Kattner, G. A molecular perspective on the ageing of 743
marine dissolved organic matter. Biogeosciences 2012,9 (6), 1935-1955. 744
58. Gonsior, M.; Peake, B. M.; Cooper, W. T.; Podgorski, D. C.; D'Andrilli, J.; 745
Dittmar, T.; Cooper, W. J. Characterization of dissolved organic matter across the 746
Subtropical Convergence off the South Island, New Zealand. Mar. Chem. 2011,
747
123 (1), 99-110. 748
59. Kujawinski, E. B.; Longnecker, K.; Barott, K. L.; Weber, R. J. M.; Kido Soule, 749
M. C. Microbial Community Structure Affects Marine Dissolved Organic Matter 750
Composition. Frontiers in Marine Science 2016,3 (45). 751
60. Knopf, D. A.; Alpert, P. A.; Wang, B.; Aller, J. Y. Stimulation of ice nucleation 752
by marine diatoms. Nat. Geosci. 2011,4 (2), 88-90. 753
61. Schnell, R. C. Ice nuclei produced by laboratory cultured marine 754
phytoplankton. Geophys. Res. Lett. 1975,2 (11), 500-502. 755
62. Fall, R.; Schnell, R. C. Association of an ice-nucleating psuedomonad with 756
cultures of the marine dinoflagellate, Heterocapsa niei. J. Mar. Res. 1985,43 (1), 757
257-265. 758
63. Ladino, L. A.; Yakobi-Hancock, J. D.; Kilthau, W. P.; Mason, R. H.; Si, M.; Li, 759
J.; Miller, L. A.; Schiller, C. L.; Huffman, J. A.; Aller, J. Y.; Knopf, D. A.; Bertram, A. K.; 760
Abbatt, J. P. D. Addressing the ice nucleating abilities of marine aerosol: A 761
combination of deposition mode laboratory and field measurements. Atmos.
762
Environ. 2016,132, 1-10.
763
64. McCluskey, C. S.; Hill, T. C. J.; Malfatti, F.; Sultana, C. M.; Lee, C.; Santander, 764
M. V.; Beall, C. M.; Moore, K. A.; Cornwell, G. C.; Collins, D. B.; Prather, K. A.; 765
Jayarathne, T.; Stone, E. A.; Azam, F.; Kreidenweis, S. M.; DeMott, P. J. A Dynamic 766