1
Dynamic Matching in Truck Platooning
Date: 26-07-2018 Author:
Joey Klein Koerkamp
First Supervisor UT: Martijn Mes
Second Supervisor UT: Matthieu van Der Heijden
2
Management Summary
Truck platooning is a new technology that allows two or more trucks to drive closely behind each other on public roads in so called platoons. Driving in a platoon saves fuel and possibly wages. Although the technology is almost completely developed, implementation for commercial use is yet to happen.
The process of deciding which trucks should platoon with each other is called truck platoon
matching. The company Distribute has been working on a study for TNO into truck platoon matching, for which they have developed and tested a matching process. In this matching process trucks try to find a match while taking a break at a parking lot. In Distribute’s system a created match is a fixed agreement. It is not possible to improve existing matches when new trucks arrive in the system, resulting in the loss of potential earnings. The goal of this thesis is to develop a new matching process in which this is possible and compare the performance of this new process with the old process. In this new matching process it is possible for trucks to break up their existing match in order to platoon with someone who is a better match for them. The truck who loses his match then starts to search for a replacement.
The new matching process has been designed based on existing literature on truck platoon matching. An algorithm called the Best-Pair-Heuristic was used as the basis for the new matching process, because of its suitability and proven effectiveness.
To measure the performance, a case was simulated using a real world location in the port of
Rotterdam. The arrival rate and destination of the trucks have been modelled according to real world data.
3
Preface
I wrote this thesis as part of my graduation assignment for the bachelor industrial engineering. While working on this thesis I learned a lot, both about the subject and research in general.
I would like to thank Berry for taking the time to discuss the contents of this research with me and for sharing his knowledge of simulation software with me. I would like to thank Robbert Jansen, from TNO, for sharing his thoughts on this research and providing me with more practical insights into the subject. I would also like to thank Martijn for providing feedback on this report and my research, which enabled me to improve it further.
Last I would like to thank everyone who gave me coffee while I was working on this thesis. This thesis might be printed with ink, but it was written with coffee.
4
Table of contents
Management Summary ... 2
Preface ... 3
List of abbreviations ... 7
List of Figures ... 7
List of Tables ... 7
1 Introduction ... 8
1.1 Introduction to truck platooning ... 8
1.2 Introduction to truck platoon matching ... 8
1.3 Current situation: Distribute’s Truck Platoon Matching Project ... 9
1.3.1 Matching while driving ... 9
1.3.2 Matching on a break ... 9
1.3.3 Room for improvement ... 10
2 Problem Identification & problem solving approach ... 11
2.1 Problem identification ... 11
2.2 Problem solving approach ... 12
2.2.1 Designing a dynamic matching process... 12
2.2.2 Testing the performance of the new system ... 13
2.3 Deliverables ... 14
3 Literature review ... 15
3.1 Different settings for truck platoon matching and their (dis)advantages ... 15
3.1.1 Moment of matching ... 15
3.1.2 Decision making ... 16
3.1.3 Starting location of the trucks ... 16
3.1.4 Static and dynamic matching ... 17
3.1.5 Summary ... 17
3.2 Existing matching algorithms ... 17
3.3 Choosing an algorithm ... 18
4 Solution design ... 21
4.1 The Best-Pair-Heuristic ... 21
4.1.1 Algorithm description ... 21
4.1.2 Performance ... 22
4.2 Alterations to the Best-Pair-Heuristic ... 22
5
4.2.2 Agent-based matching for two-truck-platoons ... 22
4.2.3 Toy Problem 1 ... 23
4.2.4 Toy Problem 2 ... 24
4.2.5 Agent-based matching for three-truck-platoons ... 25
4.3 Overviews of the old and the new matching process ... 25
4.3.1 The old matching process ... 26
4.3.2 The new matching process ... 28
4.3.3 Calculating the earnings if a truck joins a platoon ... 29
4.3.4 Differences between the old and the new matching processes ... 30
5 The simulation model ... 31
5.1 Implementation in a simulation environment ... 31
5.1.1 The matching location ... 31
5.1.2 The trucks ... 32
5.1.3 Input data and input variables ... 32
5.2 Performance measurement ... 32
5.2.1 The quantity of platoons ... 33
5.2.2 The financial benefits ... 33
5.2.3 The influence of switches ... 33
5.3 Validation of the simulation model ... 34
6 Experimental design ... 35
6.1 Experiment scenarios ... 35
6.2 Input variables for the experiments ... 35
6.3 Warm-up period ... 36
6.4 Run length ... 36
7 Experiment results... 37
7.1 Comparing the different scenarios on performance ... 37
7.2 The influence of restrictions on switching ... 39
7.3 Sensitivity analysis ... 40
7.4 Summary of findings ... 41
8 Conclusions, discussion and recommendations ... 42
8.1 Conclusions ... 42
8.2 Discussion ... 42
8.3 Recommendations for further research ... 43
6
Appendix A ... 45
Appendix B ... 46
Appendix C... 47
Appendix D ... 48
Appendix E ... 49
Appendix F ... 50
7
List of abbreviations
Dutch abbreviations are translated into English. The Dutch version is added in italics. CACC Cooperative Adaptive Cruise Control
MSER Marginal Standard Error Rule
NDW National Database Traffic Data (Nationale Databank Wegverkeersgegevens) TNO Netherlands Organisation for Applied Scientific Research (Nederlandse organisatie
voor Toegepast Natuurwetenschappelijk Onderzoek)
List of Figures
Figure 1 Problem cluster
Figure 2 Flowchart of the new searching process Figure 3 Flowchart of the old searching process
Figure 4 The “Maasvlakte Plaza” as modelled in the simulation model Figure 5 Graph of switching statistics
Figure 6 MSER formula Figure 7 MSER graph
Figure 8 Convergence forumla
List of Tables
Table 3.1 Overview of the different settings for truck platoon matching Table 3.2 Algorithms and settings table
Table 3.3 Algorithms and settings table updated Table 4.1 Platoon earnings for Toy problem 1 Table 4.2 Platoon earnings for Toy problem 2
Table 4.3 Overview of the different scenarios if a truck joins an existing platoon Table 6.1 Experiment overview
Table 7.1 Numerical results
Table 7.2 Ranks for situation with 90 percent wage savings Table 7.3 Ranks for situation without wage savings\ Table 7.4 Sensitivity analysis results
Table D.1 Input variables Table F.1 The convergence test Table G.1 Batches mean per scenario
8
1
Introduction
In this chapter, the subjects truck platooning and truck platoon matching are introduced. The company Distribute is currently working on a study into truck platoon matching called the Truck Platoon Matching Project. This study and the assignment are introduced as well.
1.1Introduction to truck platooning
Truck platooning involves trucks using a new technology called Cooperative Adaptive Cruise Control (CACC). CACC allows trucks to drive together in a platoon while connected to each other through wireless communication. The first truck is fully manually driven and the other trucks steer, brake and (de)accelerate automatically based on the actions of the first truck (Bhoopalam et al., 2018). The technology is largely developed and successful tests have been performed on the road but the implementation for commercial use has yet to happen.
Truck platooning has various benefits. Trucks that drive in a platoon use less fuel because of reduced air drag. Fuel savings differ between 2-5 percent for the first truck, 11-21 percent for the middle truck and 9-15 percent for the last truck depending on driving speed and distance between trucks (Boysen et al., 2018).
Besides the fuel savings, truck platooning also has the potential to save wages. The following trucks are automatically following the first truck and the drivers in the following trucks do not have to do anything while platooning. They are however required to be in this trucks because of legal
regulations, but this might change in the future (Bhoopalam et al., 2018).
It is possible that waiting costs need to be made in order to form a platoon. If a truck driver has to wait a short time for his platoon partner, he still needs to get paid during this time. Therefore the earnings of a platoon are considered instead of the savings. The earnings of a platoon are defined as the savings of a platoon minus the costs.
Both the fuel and wage savings are higher for the following trucks than for the leading truck. This means that larger platoons have higher savings per truck. There is however a maximum platoon capacity, the largest number of trucks that can be in one platoon. The maximum platoon capacity is not yet known but it is restricted by the platooning technology and expected to be restricted by legal regulations in the future (Bhoopalam et al., 2018).
1.2Introduction to truck platoon matching
In order to exploit the benefits of truck platooning technology, trucks need to be matched to platoon with each other. This is called truck platoon matching, sometimes referred to as truck platoon coordination (Hoef et al., 2018) or truck platoon planning (Bhoopalam et al., 2018). When matching trucks, one needs to consider that each truck has its own starting location, destination, release time and arrival deadline. This makes truck platoon matching a complicated task.
Matching trucks with each other is done by creating so called platoon plans. A platoon plan contains the following information:
Which trucks are in the platoon
The route of the platoon
9
The speed profile on the route (optional)
The order of the trucks (optional)
Common objectives when creating platoon plans are to maximize the earnings, either for individuals or for the entire system or to maximize the number of trucks that drives in a platoon.
Truck platoon matching can be done in different ways. It is for example possible to create the platoon plans before the trucks depart or while they are driving. The most researched settings and their (dis)advantages are described in Chapter 3.
1.3Current situation: Distribute’s Truck Platoon Matching Project
As a project for TNO, Distribute is researching the potential of a real-time, agent-based matching system for truck platooning. Real-time matching means that the platoon plans are created while the trucks are driving or shortly before they depart. The term agent-based is explained in section 3.1.2. In the context of truck platoon matching, agent-based means that the truck drivers, or software
representing them, can choose for themselves with whom they want to match, instead of a controller telling them who they need to platoon with. The (dis)advantages of these types of truck platoon matching compared to other systems are described in Chapter 3.
Distribute has designed a matching system in which each truck tries to find a platoon partner for himself. To achieve this goal they have two possibilities. They can find a platoon partner while driving or while taking a break. In both cases, they try to match with the partner with whom they can
achieve the highest earnings using a best-match-algorithm. Both options are further explained here.
1.3.1 Matching while driving
While driving on the highway, trucks scan their neighbourhood for potential partners. The proposed system has access to the destination and time window of the other trucks and uses this to calculate the earnings if the candidate truck platoons with the searching truck. If a profitable candidate is found, or the most profitable candidate if there is more than one, a match is made. The two trucks than drive to a matching location from where they start platooning. This matching location is, for example, a parking lot or gas station next to the highway.
1.3.2 Matching on a break
While driving their routes truck drivers need to take obligatory breaks, because of labour regulations. They often hold their breaks at the same location as other drivers. For example at big distribution centres, ports and well-known truck stops. The other trucks at these locations are potential
10
1.3.3 Room for improvement
11
2
Problem Identification & problem solving approach
In the previous chapter, the subject of truck platoon matching and the assignment have been introduced. To determine which problem to solve, a problem identification is done according to Heerkens & Winden (2012). This is followed by the creation of a problem solving approach, which is used to guide the further execution of the assignment. To conclude this chapter, the deliverables are listed.
2.1Problem identification
To reduce the loss of potential earnings, the causes of this loss need to be identified. By taking a closer look at the current match making process and studying a report from Distribute about the project, three causes of loss of potential earnings are found.
The first cause is that two trucks that are already matched never wait for a third truck that wants to join, not even when this benefits them. Potential earnings are lost here because the third truck cannot join the platoon and the first two trucks could have increased their earnings by letting the third truck join.
The second cause is that in the current matching system, a truck that wants to join an already formed platoon cannot platoon further with one of the other trucks than the overlapping distance of the first two trucks. When the third truck and one of the other trucks are going in the same direction after the original two trucks go separate ways, there is a potential for more earnings that is not used.
The third cause is that once two trucks have agreed to platoon after their breaks this is a fixed agreement. This means that should a better candidate for one of the trucks arrive during their break, they cannot break up their match with their original partner to go with the better candidate.
Potential earnings are also lost here since matching with the better candidate would have resulted in higher earnings.
12 Figure 1 The problem cluster
To explain the connections between the problems, a problem cluster is created, see Figure 1. From this problem cluster it becomes clear that the core problem is that the matching algorithms that are currently used do not support dynamic matching. This is the core problem because this problem has no other causes and it is something that can be influenced. Solving the core problem then reduces the loss of potential savings. This is then indicated by an increase in performance compared to the existing, static matching algorithms.
2.2Problem solving approach
The problem solving approach is twofold. The first part is to design a matching process that does allow for dynamic matching in a real-time, agent-based system and fits into the implementation environment. The implementation environment is the matching-on-a-break-setting. The second part is to evaluate the performance of this new process and to compare it with the old process’s
performance. Both parts are further described separately.
2.2.1 Designing a dynamic matching process
For this matching process, a matching algorithm is needed that can be used for dynamic matching in a real-time, agent-based system. The algorithm is based on existing literature on truck platooning to support its credibility. In order to do this, five research questions were formulated that need to be answered. These research questions, including the plan to answer them is given below.
1. In which different settings is truck platoon matching researched and what are their (dis)advantages?
This question is answered through a literature review. Existing literature on truck platoon matching is consulted to create an overview of the different settings in which truck platooning is researched, including their (dis)advantages.
2. What matching algorithms are used for truck platoon matching in literature and in which setting are they used?
13 3. Which of the found algorithms is most suitable for dynamic matching in a real-time,
agent-based system?
The found algorithms are evaluated on how easily they can be altered to function in a dynamic, real-time, agent-based matching system. Based on this evaluation, one algorithm is chosen to continue working with.
4. How does the chosen algorithm need to be altered so that it fits the purpose of the assignment?
The chosen algorithm needs to be altered so that it fits the purpose of the assignment. This means that the algorithm needs to function in the matching-on-a-break-setting described earlier and needs to support dynamic matching. Which alterations are needed depends on the chosen algorithm.
2.2.2 Testing the performance of the new system
After going through these steps and answering the research questions, a new matching process is built based on an algorithm obtained from literature. The next step is to evaluate its performance and compare it with the existing static matching system to see whether the dynamic matching system is an improvement. This will be done through simulation. To do this the following knowledge problem needs to be answered:
Under which circumstances does the dynamic matching algorithm outperform the static matching algorithm that was previously used and how big is this difference?
This knowledge problem can be split in the following research questions:
5. How to implement the matching processes in a simulation environment?
The matching processes need to be implemented in a simulation environment to measure their performance. The simulation software Plant Simulation will be the most likely candidate for this because of previous experience with this software. A case is needed to test the algorithm. If possible, one of the cases Distribute already has modelled will be used to save time.
6. Which performance indicators need to be used to measure the performance of the matching processes?
Performance indicators need to be chosen to evaluate the performance of the algorithms. These performance indicators should be chosen to represent the performance TNO is interested in.
7. How do the experiments need to be designed?
The experimental design includes the design of the different scenarios that are simulated. It also includes determining the warm-up period, the run-length, the number of replications and the values of the input variables.
8. How does the performance of the dynamic matching process compare to that of the static matching process?
To compare the performance of the dynamic and the static matching process, the results of the experiments are analysed. Statistic procedures are used to determine whether
14
2.3Deliverables
15
3
Literature review
In this chapter, research question one, two and three are answered. The answers to research question one and two gives an overview of algorithms and matching settings researched in truck platooning literature. Based on this overview, research question three is answered, which choses one algorithm to continue working with. The literature consulted in this chapter is selected through a systematic literature review. A list of the selected literature can be found in Appendix A.
3.1Different settings for truck platoon matching and their (dis)advantages
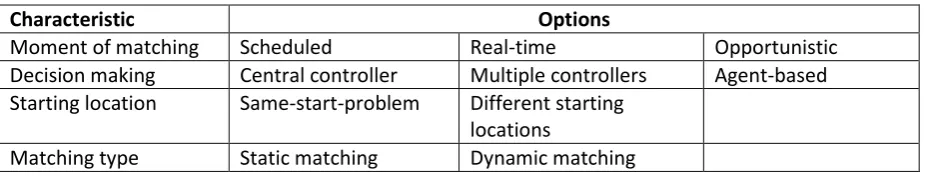
In this paragraph the answer to research question one is given: In which different settings is truck platoon matching researched and what are their (dis)advantages? A setting in which truck platoon matching takes place can be defined by certain characteristics, for example the moment of matching. Four characteristics were found in literature. For each of these characteristics, different options exist. Each characteristic, its different options and their (dis)advantages are described in this section.
3.1.1 Moment of matching
The moment of matching is described as the moment a platoon plan is created relative to the departure of the matched trucks. Bhoopalam et al. (2018) distinghuis between three different catagories on the moment of matching:
Scheduled platoon matching: In scheduled platoon matching all trips are known beforehand and so platoon plans can be created before the first trucks start their trips.
Real-time platoon matching: In real-time platoon matching the platoon plans are created shortly before the trucks start their trips or during the execution of their trips.
Opportunistic platoon matching: In opportunistic platooning, trucks that drive in the
proximity of each other form platoons spontanuously. No platoon plans are created with this form of matching.
Scheduled platoon matching has the advantage that there is more time to create platoon plans, allowing for more complex solution methods that may create better platoon plans. A disadvantage is that even small deviations from the planning, which can be expected in the real world, can disrupt a platoon plan completely. Constantly updating platoon plans is needed to keep a scheduled platoon matching system working (Hoef et al., 2018).
Real-time platoon matching has the advantage that it does not require all information about the trucks’ assignments to be available long before departure. A disadvantage of real-time platooning is that platoon plans need to be created within seconds, because trucks will depart soon or are already driving. This means less complex solution methods can be used than with scheduled platoon
matching (Larsson et al., 2015).
16
3.1.2 Decision making
In a matching system there are different options for who makes the decisions on whom platoons with whom. The following three options are considered:
Central controller: A central controller makes the decisions for all trucks in the system.
Multiple controllers: There are multiple controllers. Each one makes the decisions for a subset of all trucks in the system. These subsets can be, for example trucks, within a certain geographical area or trucks from a certain company or brand. In the case of subsets based on a geographical area, trucks can switch between subsets during the execution of their trips, because they moved to a different geographical area.
Agent-based: The truck drivers, or software representing them, decide for themselves who they match with. To make a match the consent of all drivers included in this match is needed. The advantage of a central controller is that it has an overview of all trucks in the system
(Nourmohammadzadeh & Hartmann, 2016). This allows the central controller to work towards a system optimum. A disadvantage is that a large amount of information needs to be processed, this makes it less suitable for real-time platoon matching (Larson et al., 2013).
Multiple controllers have the advantage over a central controller that they can come up with solutions faster because they need to process the information of only a subset of the total trucks. This makes the creation of platoon plans less complex (Larson et al., 2013). A disadvantage is that they might miss profitable opportunities to platoon between trucks in their subset and trucks that are in another subset. This disadvantage is reduced when the subsets are based on the geographical location of the trucks because trucks that are far away from each other are less likely to be profitable platoon partners (Bhoopalam et al., 2018).
An agent-based system consists of agents that pursue their own goals and can act and think autonomous up to a certain degree. They can use basic logic to make decisions and none of the agents has an overview of all information in the system.
In truck platoon matching the agents are the truck drivers. Their goal is to find the most profitable match and they can use basic logic to find this match. Each truck only knows how profitable it is for him to match with each other truck. They do not know which other options another truck has. The advantage of an agent-based system where the truck drivers make the decision to match is that creating platoon plans becomes even less complex. Each truck driver only looks to make a match for himself. All truck drivers can search for a match simultaneously, allowing for even faster solutions than with multiple controllers. A disadvantage is that truck drivers might make matches that are beneficial for themselves but not for the system as a whole. For the whole system, this may lead to reduced savings compared to a central or multiple controllers.
3.1.3 Starting location of the trucks
17
All trucks start at the same starting location and the matches are made between these trucks. These trucks have varying departure times and destinations. This situation is referred to as the same-start-platooning-problem. The starting location is not necessarily the starting point of the trucks assignment but can also be the current location of the truck in a real-time matching system.
All trucks have their own starting locations and matches can be made between trucks at different locations. Some trucks may still start at the same location but this is because of coincidence and not necessary the case.
An advantage of the same-start-platooning setting is that the number of candidates for each truck is greatly reduced, reducing the complexity. Another advantage is that no careful planning is needed to let the trucks meet while driving, since they are already at the same place (Larsson et al., 2015). A disadvantage is that trucks that could be profitable platoon partners may not match this way because they never were at the same matching location.
3.1.4 Static and dynamic matching
The difference between static and dynamic matching has already been discussed in Chapter 2, but will be repeated here for convenience:
In static matching, once a match has been made and the platoon plan is created it cannot be altered anymore. It is therefore not possible to switch platoons when a better candidate arrives or to wait for a third truck that wants to join a platoon.
In dynamic matching it is possible to alter an already made platoon plan. For example when a new candidate arrives or new information becomes available.
The advantage of dynamic matching over static matching is the ability to improve matches once they are made. This may lead to a higher performance of the system. The disadvantage is that these improvements are not necessary an improvement for everyone involved. With dynamic matching, a truck driver risks losing his match if his platoon partner finds a better candidate. Dynamic matching therefore leads to increased uncertainty for truck drivers compared to static matching.
3.1.5 Summary
Four characteristics that define the setting in which truck platoon matching takes place are found in literature. For each of this characteristics the different options and their (dis)advantages are
discussed. Table 3.1 gives an overview of the found characteristics and their different options.
Characteristic Options
Moment of matching Scheduled Real-time Opportunistic
Decision making Central controller Multiple controllers Agent-based Starting location Same-start-problem Different starting
locations
[image:17.595.66.531.593.681.2]Matching type Static matching Dynamic matching
Table 3.1: Overview of the different settings in which truck platoon matching takes place.
3.2Existing matching algorithms
18 together with a short description of each algorithm, can be found in Appendix B. The static matching algorithms Distribute uses, the best-match-algorithm and the first-come-first-served-algorithm, are also included in this list.
The best-match-algorithm is explained in the introduction. The first-come-first-served-algorithm is an algorithm used by Distribute in the earlier stages of the project. The first-come-first-served-algorithm matches a truck with the first profitable candidate it encounters.
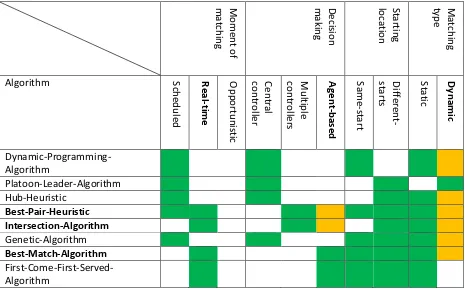
For each of the algorithms it is indicated in which setting they were tested in the literature they were obtained from. These settings are defined by the characteristics found in the previous paragraph. Sometimes an algorithm is tested in multiple settings. The green marks in Table 3.2 show which algorithm has been tested in which setting(s). No algorithms for opportunistic platoon matching are found in literature because opportunistic platoon matching does not require a matching algorithm.
M o m en t o f m atchin g D ecisi o n m akin g Startin g lo cati o n M atchin g ty p e
Algorithm Sch
edu led Rea l-ti me Opp o rtun istic Central co n tr o ller M u ltip le co n tr o ller s Ag e n t-b as e d Sa m e -st art D iff eren
t-starts Static Dy
[image:18.595.68.531.269.559.2]n ami c Dynamic-Programming-Algorithm (1) Platoon-Leader-Algorithm (3,5,9) Hub-Heuristic (8) Best-Pair-Heuristic (8) Intersection-Algorithm (10) Genetic-Algorithm (6) Best-Match-Algorithm (5,D) First-Come-First-Served-Algorithm (D)
Table 3.2: Green marks indicate that an algorithm has been tested in a setting with this characteristic. The number behind an algorithm’s name corresponds with the number of the paper it was obtained from, a “D” indicates it was used by Distribute. The corresponding papers are found in Appendix A.
3.3Choosing an algorithm
In this paragraph the answer to research question three is given: Which of the found algorithms is most suitable for dynamic matching in a real-time, agent-based system? As Table 3.2 shows, no algorithm is found in literature that has been tested for dynamic matching in a real-time, agent-based setting. Therefore, each algorithm is evaluated to see whether it can be altered so that it can function in real-time, function in an agent-based system and support dynamic matching.
19 for solutions. Algorithms that do not fulfil these two requirements are deemed unsuitable for a real-time system.
To function in an agent-based system, the algorithm must allow for the truck drivers to make the decision on whom to match with. This is not possible with all algorithms, for example because some algorithms require truck drivers to do what is most beneficial for the total system and not for themselves. It is assumed here that when truck drivers make the decisions, they choose what is best for themselves.
Most of the algorithms that do not support dynamic matching can be altered to support it by rerunning the algorithm each time information changes. The exception is the First-Come-First-Served-Algorithm because the idea behind it is that it stops once a profitable match is found. Table 3.3 is an variation on Table 3.2 and shows additional information on which algorithms can be altered to function in real-time, function in an agent-based system and support dynamic matching.
M o m en t o f m atchin g D ecisi o n m akin g Startin g lo cati o n M atchin g ty p e
Algorithm Sch
edu led Rea l-ti me Opp o rtun istic Central co n tr o ller M u ltip le co n tr o ller s Ag e n t-b as e d Sa m e -st art D iff eren
t-starts Static Dy
[image:19.595.66.535.320.610.2]n ami c Dynamic-Programming-Algorithm Platoon-Leader-Algorithm Hub-Heuristic Best-Pair-Heuristic Intersection-Algorithm Genetic-Algorithm Best-Match-Algorithm First-Come-First-Served-Algorithm
Table 3.3 Green marks indicate that an algorithm has been tested in a setting with this characteristic. Orange marks indicate that an algorithm can be altered to function in this setting.
Table 3.3 shows that there are three algorithms that can function in the right setting. Two of these are found in literature: the Best-Pair-Heuristic and the Intersection-Algorithm. The other one is currently used by Distribute: the Best-Match-Algorithm.
20 The two remaining algorithms, the Best-Pair-Heuristic and the Best-Match-Algorithm are very similar. The main difference is that with the Best-Match-Algorithm only new trucks that arrive in the system try to make a match with the trucks that are already there, while in the Best-Pair-Heuristic all trucks are constantly trying to make a match.
21
4
Solution design
In the previous chapter the choice for the Best-Pair-Heuristic, used by Larsson et al. (2015), as basis for the design of the new matching process has been motivaded. In this chapter, a detailed
description of the Best-Pair-Heuristic is given, after which research question four is answered. The answer to this question shows how the Best-Pair-Heuristic needs to be altered so that it supports dynamic matching and can function in an agent-based system as is the matching-on-a-break setting. To conclude this chapter, a detailed description of both the old and the new matching processes are given, together with a comparison.
4.1The Best-Pair-Heuristic
In this paragraph a step-by-step description of the Best-Pair-Heuristic is given as it was used by Larsson et al. (2015). The performance of this algorithm was also tested by them, the results of which are discussed here.
4.1.1 Algorithm description
The Best-Pair-Heuristic matches the trucks or existing platoons that can save the most from platooning together first. It then matches the trucks or platoons that can save the most, given that the first match is already made. It continues doing this until no more profitable matches can be made. Pseudocode for the algorithm is presented in Algorithm 1.
Algorithm 1:
The algorithm starts by defining each truck as a single-truck-platoon, with a starting point, a
destination and the truck itself (line 1 to 6). It then looks whether two single-truck-platoons can save money by merging together for the overlap of their route (line 7). When this is the case the two (single-truck-)platoons that can save the most are selected (line 8). The merging and splitting point of the overlap in their routes are determined (line 9). A new platoon is added to the set that starts at the merging point and ends at the splitting point and contains the two trucks.
The Best-Pair-Heuristic uses the following information as input: a Graph G, a set of trucks T. Each truck t ∈ T has its own starting point s on G, its own destination d on G. (When a same-start-platooning- problem is solved, s is the same for all trucks.)
1. define platoon as: p(starting point of platoon, destination of platoon, set of trucks) 2. define P as set of p
3. P → { }
4. For each t and corresponding s, d and r Do 5. add to P: p(s, d, t)
6. End
7. While savings can be achieved with merging Do
22
4.1.2 Performance
The Best-Pair-Heuristic has been tested on a graph that represents the German Autobahn network. The performance was measured as the percentage of fuel that was saved compared to a situation in which all trucks drove alone for their entire journey. The Best-Pair-Heuristic has been tested on the same-start platooning problem for up to 200 trucks with random destinations around the network. The solutions were compared with those of an exact solution method that took a lot more time to generate a solution. In the majority of the cases the Best-Pair-Heuristc was able to find solutions close to the exact solution. However it sometimes found solutions that were a lot lower than the exact solution. No clear indication as to when this occurs was found. It is expected to happen when the Best-Pair-Heuristic makes irreverisble decisions early in the matching process that are far from the optimal solution (Larsson et al., 2015).
4.2Alterations to the Best-Pair-Heuristic
The Best-Pair-Heuristic as described in the previous paragraph forms the basis around which the new matching process is designed. Some alterations need to be made so that the algorithm fits the purpose. This is done by answering research question four: How does the chosen algorithm need to be altered so that it fits the purpose of the assignment? Two of these alterations have been
introduced: The algorithm needs to support dynamic matching and the algorithm needs to become agent-based.
From this point the Best-Pair-Heuristic is only considered in a setting with a same-start-platooning problem since this is the setting in which it is used. This makes it easier to do the proposed alterations.
4.2.1 Supporting dynamic matching
The Best-Pair-Heuristic as described in Algorithm 1 does not support dynamic matching, since there is no way to improve existing matches when the set of trucks T changes. This happens when a new truck arrives at the matching location.
To make the improving of matches possible, existing matches must be allowed to be broken up. The Best-Pair-Heuristic can then be rerun every time a new truck arrives at the matching location, generating a new solution. If a match that existed in the old solution does not exist in the new solution, because one of the trucks found a better match, it is deleted.
4.2.2 Agent-based matching for two-truck-platoons
In its current form, the decision making in the Best-Pair-Heuristic is done by a central controller who has the information of all trucks at the matching location. It is possible to let the truck drivers, make the decisions and come to the same solution as when a central controller uses the
Best-Pair-Heuristic. In this paragraph, this is first proven for a situation where only two-truck-platoons can be formed. To achieve this the following requirements need to be fulfilled:
1. A truck driver knows how much he, himself, can save with each of the other trucks at the matching location. He does not know how much two other truck drivers can save if they platoon with each other.
2. A truck driver can switch matches as often as he wants without penalties. 3. A truck driver wants to maximize their own earnings.
23 To show that under this requirements an agent-based system would lead to the same solution as a central controller using the Best-Pair-Heuristic, a so called toy-problem is solved using both methods in the next paragraph.
4.2.3 Toy Problem 1
In this paragraph an example problem called Toy Problem 1 is described. Toy Problem 1 is then solved with both the Best-Pair-Heuristic and the agent-based approach described in the previous paragraph to show that both methods lead to the same solution.
Toy Problem 1:
Four trucks, truck A, B, C and D, stand on a matching location. No matches have been created yet and the maximum platoon size is two trucks. After a solution is found for truck A, B, C and D, truck E arrives. Now a new solution needs to be found that includes truck E. Table 4.1 shows how much a truck (row) can save if it platoons with each other truck (column), since the earnings of a platoon are equally divided amongst the two trucks the table is symmetrical. A green mark indicates a trucks’ most profitable match. In the first part of the problem truck E has not arrived yet and so the last row and column are ignored.
[image:23.595.64.190.329.416.2]A B C D E A X 4 0 0 0 B 4 X 7 0 0 C 0 7 X 10 0 D 0 0 10 X 15 E 0 0 0 15 X
Table 4.1 An overview of the savings each truck can achieve when it platoons with another truck
Best-Pair-Heuristic solution to Toy Problem 1:
The Best-Pair-Heuristic creates the match with the highest earnings first. This is the match between truck C and D since they can earn €20 in total. The most profitable match, given that C and D are already matched is then truck A and B. The solution is:
A and B platoon together.
C and D platoon together.
The total earnings are €8 + €20 = €28.
When truck E arrives the Best-Pair-Heuristic starts again from the beginning, ignoring all made matches. Truck D and E are matched first since they can save €30 in total. Truck B and C are matched next because they can earn €14 together, which is more than the €8 that truck A and B can earn together. There is no profitable match left for truck A so he drives alone. The solution is:
A drives alone.
B and C platoon together.
D and E platoon together.
The total earnings are €14 + €30 = €44. Agent-based approach solution to Toy Problem 1:
24 C because he has no options that are more profitable. Truck B then asks truck A because this is the most profitable candidate left for him. Truck A says yes because he has no better options. The solution is the same as with the Best-Pair-Heuristic:
A and B platoon together.
C and D platoon together.
The total earnings are €8 + €20 = €28.
When truck E arrives he asks truck D to platoon with him since this is his most profitable option. Truck D says yes because he can save more with truck E than with truck C and he can get out of his match with C without costs. Truck C than asks truck B because this is for him the most profitable option left. Truck B says yes because he can save more with truck C than with truck A. Truck A than ends up alone. The solution is still the same as with the Best-Pair-Heuristic
A drives alone.
B and C platoon together.
D and E platoon together.
The total earnings are €14 + €30 = €44.
4.2.4 Toy Problem 2
The requirements given in section 4.2.2 guarantee that the Best-Pair-Heuristic and the agent-based approach generate the same solution when the maximum platoon size is two. That this is not the case when the maximum platoon size is three or higher is shown by the following example, called Toy Problem 2. This problem is also solved with the Best-Pair-Heuristic and the agent-based approach to show that this leads to different solutions.
Toy Problem 2:
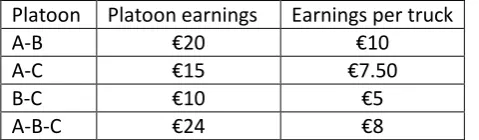
Three trucks, called truck A, B and C stand on a matching location. No matches have been made yet. The maximum platoon size is three. The savings of each possible platoon are given in Table 4.2. Platoon Platoon earnings Earnings per truck
A-B €20 €10
A-C €15 €7.50
B-C €10 €5
[image:24.595.65.305.505.575.2]A-B-C €24 €8
Table 4.2 An overview of the earnings each possible platoon can achieve
Best-Pair-Heuristic solution to Toy Problem 2:
The Best-Pair-Heuristic first matches trucks A and B, because this increases the total earnings the most. Truck C is then matched with A and B because this increases the total savings with €4. The solution is:
A, B and C platoon together.
25 Agent-based approach to Toy Problem 2:
With the agent-based approach truck A choses truck B first and vice versa. Truck C wants to join this platoon but A and B do not want this because their personal earnings decrease from €10 to €8. A different solution is found than when the Best-Pair-Heuristic is used:
A and B platoon together.
C drives alone.
The total earnings are €20.
4.2.5 Agent-based matching for three-truck-platoons
Toy Problem 2 shows that for three-truck-platoons the Best-Pair-Heuristic and the agent-based approach do not always generate the same solution. The difference occurs because the Best-Pair-Heuristic chooses the match with the highest increase in total earnings, while with the agent-based approach, trucks choose the match with the highest personal earnings. This is no problem with two-truck-platoons because the personal earnings are there always half of the total earnings. This means that the match with highest increase in personal earnings is also the match with the highest increase in total earnings. With three-truck platoons however, this leads to different solutions as shown in Toy Problem 2.
To solve this problem, the way the earnings are divided amongst the participants needs to be changed. This division needs to be done in such a way that the searching truck’s earnings are half of the total increase in earnings in each situation, since that leads to the same solution as the Best-Pair-Heuristic. To achieve this the fourth requirement in paragraph 4.2.2 is removed and replaced with a new requirement. The new list of requirements looks like this:
1. All truck drivers know how much they can save with each of the other trucks on the matching location.
2. All truck drivers can switch matches as often as they want without penalties. 3. All truck drivers want to maximize their own earnings.
4. A truck that wants to join a single truck or existing platoon gets half of the increase in total earnings. The other half is for the single truck or divided amongst the trucks that were already in the platoon.
To demonstrate the effect of this new way of dividing the earnings, Toy Problem 2 is solved again using the agent-based approach, with the new way of dividing the earnings.
Agent-based approach solution to Toy Problem 2, with new earnings division:
With the agent-based approach truck A choses truck B first and vice versa. Truck C wants to join this platoon, which would earn him €4. Truck A and B both earn €1 extra if truck C joins them, so they agree. The found solution is now the same as the solution found with the Best-Pair-Heuristic:
A, B and C platoon together.
The total earnings are €24.
4.3Overviews of the old and the new matching process
26
4.3.1 The old matching process
[image:26.595.78.460.160.674.2]In the old matching process, trucks search for a platoon match through the process described in the flowchart in Figure 2. In the old matching process, existing matches cannot be broken up. Therefore, a truck starts the searching process only when it arrives at the matching location. The process is further explained in Figure 2.
Figure 2 Flowchart of the old searching process of a truck at the matching location.
27 profitable to platoon which each of the trucks on the candidate list. If a profitable candidate is found that is not in a platoon he is added to the matches list. If a profitable candidate is already in a platoon, but the platoon has not reached its maximum size, the searching truck calculates whether it is profitable for all the platoon members if he joins the platoon. If this is the case the candidate is added to the matches list.
28
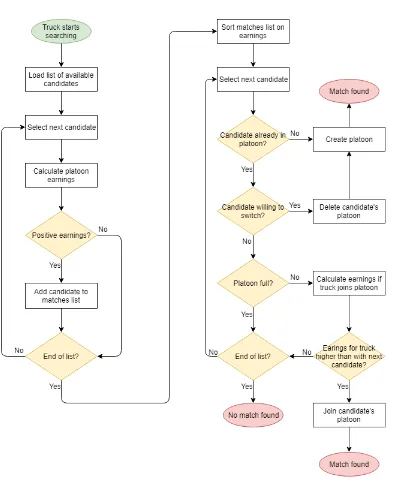
4.3.2 The new matching process
In the new matching process, trucks search for a platoon match through the process described in the flowchart in Figure 3. In the new matching process a truck starts the searching process when it is triggered by one of the following two events:
The truck arrives at the matching location.
[image:28.595.80.474.171.659.2] The truck’s existing match is broken up, leaving the truck with no platoon partner.
Figure 3 Flowchart of the new searching process of a truck at the matching location.
29 Because the truck wants to maximize his earnings, he first tries to platoon with the candidate on the matches list with the highest earnings. If this candidate is not in a platoon a match is created. If the candidate is already in a platoon, the truck asks the candidate to switch platoons, which the candidate agrees to if this is beneficial for him, regardless of whether his current platoon is full. Otherwise the truck checks whether there is room left to join the candidate’s platoon and whether this is more beneficial for him than platooning with the next candidate on the list. When there is both room left and the earnings of joining the candidate’s platoon are higher than those of the next candidate on the list, the truck joins the platoon. Note, that it is no longer required to check whether all members of the candidate’s platoon benefit from the truck joining the platoon. Because of the new way the earnings are divided, their earnings can only increase.
Joining a platoon is only possible when the maximum platoon size is three or higher. When the maximum platoon size is two, the answer to the question “Platoon full?” is always yes.
4.3.3 Calculating the earnings if a truck joins a platoon
If a truck joins an existing platoon, the new earnings need to be calculated. This is more complicated than calculating the earnings of a new (two-truck-)platoon. This subsection explains the difficulties of adding a truck to an existing platoon.
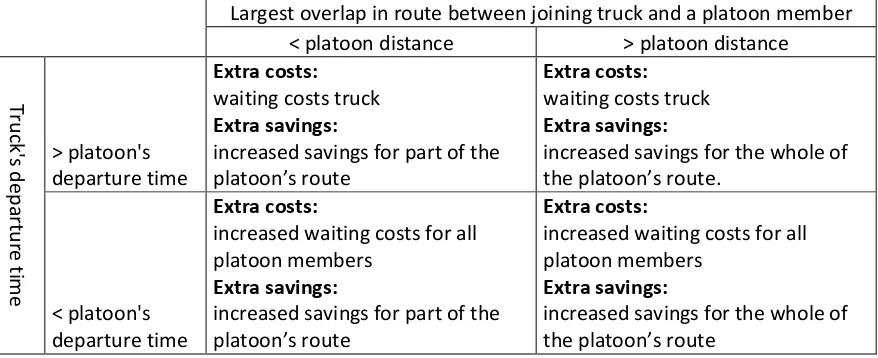
Four different scenarios can arise if a truck joins a platoon, depending on the departure time of the truck, relative to that of the platoon, and whether the overlap in route between the truck and one of the platoon members is larger than the platoon distance. The platoon distance being the overlap in route between the platoon members themselves. The different scenarios and the extra costs and savings that they generate are displayed in Table 4.3.
Largest overlap in route between joining truck and a platoon member < platoon distance > platoon distance
Truck' s depar tur e ti m e > platoon's departure time Extra costs: waiting costs truck Extra savings:
increased savings for part of the platoon’s route
Extra costs: waiting costs truck Extra savings:
increased savings for the whole of the platoon’s route.
< platoon's departure time
Extra costs:
increased waiting costs for all platoon members
Extra savings:
increased savings for part of the platoon’s route
Extra costs:
increased waiting costs for all platoon members
Extra savings:
[image:29.595.72.511.446.625.2]increased savings for the whole of the platoon’s route
Table 4.3 Overview of the different scenarios that can occur if a truck joins an existing platoon
30
4.3.4 Differences between the old and the new matching processes
In this section the most important differences between the old and new matching process are listed:
In the new matching process it is possible to break up an existing match to form a better match.
Because trucks can lose their existing match, trucks do not only start searching for match when they arrive at the matching location but also when they lose their existing match.
The earnings of a three-truck-platoon are divided in a different way in the new matching process compared to the old matching process
31
5
The simulation model
In the previous chapter the new matching process was described and compared with the old process. In this chapter, the performance of these two processes is made measurable. This is done by
answering research question five, that shows how the matching process is implemented into simulation software, and research question six, that makes the performance of the processes measurable. The chapter is concluded with the validation of the simulation model.
5.1Implementation in a simulation environment
In this subchapter, the answer is given to research question five, How to implement the matching processes in a simulation environment? To save time, one of the models Distribute already used for this project is altered for the purpose of this assignment. The simulation software that is used is Plant Simulation 14. The altered simulation model is described in the rest of this chapter. A list of the alterations that have been made to the original simulation model can be found in Appendix C. As described in the previous chapter, the complexity of a platoon matching process increases by a large degree when the maximum platoon size is increased beyond two. Because of the time
constraints of this research, the matching processes are only simulated with a maximum platoon size of two.
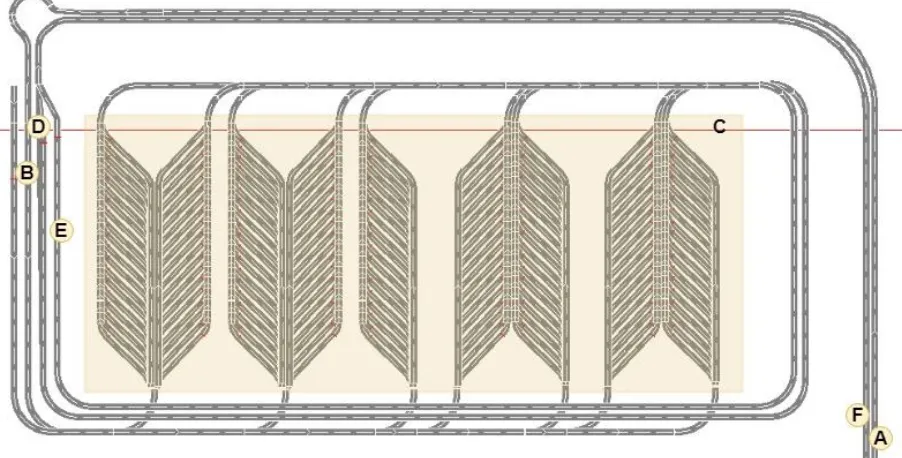
5.1.1 The matching location
[image:31.595.72.523.449.678.2]To simulate the matching processes, a matching location is needed. The real-world location “Maasvlakte Plaza”, or Plaza for short, is used for this purpose. The Plaza is a truck stop located on the Maasvlakte 2 area in the port of Rotterdam in the western part of the Netherlands. Truck drivers, who need to visit the port of Rotterdam, can take their obligatory rest periods here.
Figure 4 The Maasvlakte Plaza as it is modelled in the simulation model
32 is successful or not, he goes to one of the parking spots in (C) and takes his break. When it is time for a platoon to leave, the first truck goes to (D) and waits there until the platoon is complete. Once the platoon is complete they start their journey and leave the figure at (F). A truck that leaves the Plaza alone exits the parking lot through (E) as to not receive hinder from uncomplete platoons that are waiting. The trucks that leave alone also exit the figure at (F).
5.1.2 The trucks
In this simulation, the trucks and the truck drivers are one entity, which is referred to as a truck. Each truck that arrives at the Plaza has two goals. His first goal is to take his obligatory break, which is modelled in the simulation as the truck standing still for the duration of the break. His second goal is to find a platoon partner with whom he can achieve the highest positive earnings. A truck always achieves his first goal, but a truck might fail to find a platoon partner with whom he can achieve positive earnings and leave alone.
The earnings of a platoon are calculated by subtracting the platoon costs from the platoon savings. The platoon savings consists of the fuel savings and potentially the wage savings, both depend on the length of the overlap in route between two trucks. The platoon costs consist of the waiting costs one truck has to make to wait for the other truck, which depends on the deviation in departure time between the two trucks.
The overlap in route between two trucks depends on the destinations of the trucks. Each truck has a destination that is chosen from a list of fifteen different options. Each option is a region or city in Western-Europe.
5.1.3 Input data and input variables
TNO provided data obtained from the NDW, which is used for this simulation model. The intensity with which trucks arrive at the Plaza is modelled so that it represents the NDW data during rush-hour. The different destinations of the trucks are chosen with an intensity, so that it represents the NDW data as close as possible.
To calculate the overlap in routes for trucks with different destinations an origin/destination matrix is used, that shows the overlap in route between two destinations. This matrix is also provided by TNO. There are a number of input variables that influence the benefits and costs of a platoon. These include the percentage of fuel a platooning truck saves, the hourly wage of a truck driver and the fuel price. A complete list and description of these variables and their values can be found in Appendix D.
5.2Performance measurement
In this subsection, the answer is given to research question six, which performance indicators need to be used to measure the performance of the matching processes? The performance of a platoon matching process can be defined in many different ways. Since the goal of the Truck Platoon
Matching project is to obtain insights for TNO in truck platoon matching, the performance indicators need to be chosen so that they represent the interests of TNO.
33 the switching of platoons on the individual trucks. To get insights in this influence, statistics on the switching of platoons are also gathered.
5.2.1 The quantity of platoons
To measure the quantity with which platooning technology is used, the following two performance indicators are used:
The percentage of trucks that leave the Plaza in a platoon. This provides insights in the number of trucks that use platooning technology.
The average kilometres per platoon. This measures how much the trucks use platooning technology. (Note that if two trucks platoon together for 50 kilometre, the total of platooned kilometres for that platoon is 100, since both trucks platooned for 50 kilometres.)
5.2.2 The financial benefits
The financial benefits of truck platooning can be measured at multiple levels. Three performance indicators are used to measure the financial benefits:
The average earnings per platooned kilometre. The savings that are achieved per platooned kilometre consist of the fuel and wage savings, which are fixed per kilometre. The earnings per kilometre therefore only change because of varying platoon costs. (Note that if two trucks platoon together for 50 kilometre the total of platooned kilometres is 100, since both trucks platooned for 50 kilometres.)
The average earnings per platoon. The earnings of a platoon are the sum of the earnings of all platoon members.
The earnings per hour. These are equal to the sum of the earnings of all platoons that are created at the matching location in an hour.
5.2.3 The influence of switches
To provide insights in the influence of switches on the individual trucks, the following information is collected:
The distribution of the number of times a truck loses his match during his stay at the Plaza: This tells which percentage of the trucks gets dumped zero times, one time, two times etc.
34
5.3Validation of the simulation model
To increase confidence in the simulation model, validation is needed. Robinson (2014) distinguishes two types of validation, black-box validation and white-box validation. Black-box validation compares the output of the model with the real world data. The problem with black-box validation, in this case, is that there is no real-world data to compare the simulation output against, neither are their
accurate predictions which can be used for comparing. White-box validation checks the insights of the simulation model.
35
6
Experimental design
In this chapter the different scenarios in which the experiments are conducted are described as well as the different experimental settings. The warm-up-period of the simulation model and the run length of the experiments are determined as well.
6.1Experiment scenarios
Experiments are conducted with three different scenarios. In the first scenario the old, static matching process is used. The other two scenarios use the new, dynamic matching process, but the last scenario uses extra restrictions on the switching of platoons.
Scenario A: The static matching process. This scenario uses the old, static matching process as shown in Figure 2. Switching platoons is not possible at all in this scenario.
Scenario B: The unrestricted dynamic matching process. This scenario uses the new, dynamic
matching process as show in Figure 3. There are no restrictions on or penalties for switching platoons in this scenario.
Scenario C: The restricted dynamic matching process. This scenario is similar to scenario B, but in this scenario it is no longer possible for a truck to switch platoons if the truck with whom he has a match has already started waiting past his own departure time, and therefore making extra costs. This restriction takes away the risk for trucks of waiting for nothing.
6.2Input variables for the experiments
Although truck platooning has the possibility to achieve savings on the wages of the truck drivers, this is not expected to be possible when truck platooning is first used in commercial road transport. To see whether the new matching system is an improvement overall it should therefore be tested in a situation with and without the possibility to save wages. Each of the scenarios will therefore be simulated for a situation in which 90 percent wage savings are achieved for each of the following truck drivers in a platoon and a situation in which no wage savings are achieved. This means that six experiments will be conducted, for an overview see Table 6.1.
Experiment Scenario Wage savings
1 A 90%
2 B 90%
3 C 90%
4 A 0%
5 B 0%
[image:35.595.64.258.519.618.2]6 C 0%
Table 6.1 Experiments overview
36
6.3Warm-up period
Before experiments can be conducted the initialisation bias needs to be dealt with. Robinson (2014) proposes two ways to do this. The first option is to use a warm-up period at the beginning of the simulation during which no output data is collected. The second option is to set initial conditions for the simulation model so that the model starts in a realistic state.
Because of the difficulty of determining realistic initial conditions, a warm-up period is used. To determine the length of the warm-up period a MSER procedure was run. For this procedure scenario B was simulated for a 48 hour time period. Scenario B has been used to determine the warm-up period because it is expected that, because of the lack of restrictions on switching platoons, this scenario takes the longest to reach a steady state.
After running the MSER procedure, a warm-up period of eight hours was found. Details on the execution of the MSER procedure can be found in Appendix E.
6.4Run length
Because of the significant warm-up period, a single long run is performed for each scenario. This has the advantage over multiple replications that the warm-up period needs to be run only once for each scenario.
To determine the length of this single long run, the convergence method proposed by Robinson (2014) is used. With this method, the required run length for each performance indicator can be determined through three replications. The performance indicator that requires the longest run length determines the run length.
Using the convergence method, a run length of 24 hours was found. This is extended with a 50 percent safety margin. Including the earlier found warm-up period of eight hours, each experiment is simulated for 44 hours. Details of the execution of the convergence method can be found in
37
7
Experiment results
In the previous chapter the experimental design has been described. In this chapter the results of the experiments are analysed. This provides the answer to research question eight, how does the
performance of the dynamic matching process compare to that of the static matching process? The analysis of the results is split in two parts. First all three scenarios are compared on the scores of the performance indicators, for both the situation with 90 percent wage savings and the situation without wage savings. After this, scenario B and C are compared on the switching statistics to see the influence of the restriction on switching. This chapter ends with a summary of the findings.
7.1Comparing the different scenarios on performance
Table 7.1 provides a summary of the numerical results of the experiments. This summary includes the mean and variance of each performance indicator for each experiment.
For the situation without wage savings there is no difference in data between scenario B and C. This is because of the lower savings that can be achieved without wage savings, it is not profitable to wait for a long time. Resulting in trucks only matching with trucks with similar departure times. The waiting times are so low that the restriction on switching is never used to prevent a switch, resulting in the same output data as scenario B.
Performance indicator Statistic
90 Percent Wage Savings No Wage Savings Scenario A Scenario B Scenario C
Scenario A
Scenario B
Scenario C
Percentage in Platoon Mean 92.7% 83.7% 90.5% 54.1% 56.2% 56.2%
St. Dev. 3.99% 7.16% 5.57% 7.57% 6.78% 6.78%
Average Platoon KMs Mean 151.9 233.8 223.8 208.7 235.1 235.1
St. Dev. 17.60 34.50 30.21 38.21 45.51 45.51
Earnings per hour Mean € 772.85 € 1,224.73 € 1,231.82 € 24.64 € 35.93 € 35.93
St. Dev. 123.67 194.58 191.15 7.34 10.30 10.30
Earnings per Platoon Mean € 33.24 € 58.62 € 54.29 € 1.82 € 2.52 € 2.52
St. Dev. 5.05 9.46 7.82 0.51 0.58 0.58
Earnings per Platooned KM
[image:37.595.70.558.351.555.2]Mean € 0.2180 € 0.2503 € 0.2424 € 0.0087 € 0.0107 € 0.0107 St. Dev. 0.01090 0.00766 0.00558 0.00166 0.00125 0.00125 Table 7.1 Numerical results. Red indicates a decrease in performance compared to scenario A. Green
indicates an increase in performance compared to scenario A.
To see whether the differences between the scenarios are significant, confidence intervals are used. For each performance indicator, 95 percent confidence intervals are made for the difference
38
Initially each scenario is given the rank one.
If a scenario scores significantly lower on a performance indicator than another scenario, it is given the rank two for that performance indicator.
If a scenario scores significantly lower on a performance indicator than both other scenarios, it is given the rank three for that performance indicator.
Rankings with 90 Percent Wage Savings
Scena rio P er centage in P la to o n Ave rag e P lato o n KM s Earn in
gs per h
o u r Ear n in gs per P lat o o n Earn in gs per P lat o o n ed K M
A 1 3 3 3 3
B 3 1 1 1 1
[image:38.595.70.360.157.344.2]C 1 1 1 2 2
Table 7.2 Ranks for situation with 90 percent wage savings
Scenario B outperforms scenario A on the performance indicators that measure the average quality of a match (average kilometres per platoon, earnings per platoon an earnings per platooned kilometre). Of these performance indicators, the earnings per platoon show the largest improvement. On average, the earnings per platoon increase with 76 percent when dynamic matching is used. It is therefore concluded that the unrestricted dynamic matching process, on average, creates higher quality matches than the static matching process.
Scenario A outperforms scenario B on the percentage of trucks that leave in a platoon, with on average nine percent. Showing that more matches are created with the static, than with the dynamic matching process. However, the increased quality of the matches created with the dynamic matching process is high enough to compensate for the reduction in the number of matches with respect to the total earnings created at the matching location. This becomes clear from scenario B
outperforming scenario A on the earnings per hour. On average scenario B generates 58 percent more earnings per hour.
The restriction on switching platoons that has been added in scenario C has a negative influence on the average quality of the matches compared to scenario B, where there are no restrictions. The restricted dynamic matching process however, creates better matches than the static matching process.
The restriction on switching platoons reduces the negative influence of the dynamic matching process on the percentage of trucks that leave in a platoon, showing no significant difference with the static matching process. The increase in the percentage of trucks that leave in a platoon
39 Rankings with No Wage Savings
Scena rio P er centage in P la to o n Ave rag e P lato o n KM s Earn in
gs per h
o u r Ear n in gs per P lat o o n Earn in gs per P lat o o n ed K M
A 1 3 3 3 3
B 1 1 1 1 1
[image:39.595.73.359.69.256.2]C 1 1 1 1 1
Table 7.3 Ranks for situation without wage savings
Comparing scenario A and B, results in the conclusion that also without wage savings the dynamic matching process produces on average more profitable matches. There is however no reduction in the percentage of trucks that leave the Plaza in a platoon between these two matching processes in the situation without wage savings. A significant increase in the earnings per hour is therefore found when comparing scenario A and B.
As is mentioned earlier, there is no difference in output data between scenario B and C for the situation with no wage savings. All comparisons drawn between scenario A and B therefore also apply to the comparison of scenario A and C.
7.2The influence of restrictions on switching
In this paragraph the effect of the restricted switching on the individual trucks is analysed. Because the restriction has not made a difference in the situation without wage savings, the analysis is limited to the situation with 90 percent wage savings.
Figure 5 Graph of switching statistics
0% 10% 20% 30% 40% 50% 60% 70%
0 1 2 3 4 5 6 7 8
Per ce n tage o f to tal tr u cks
Number of times a truck loses his match
Switching statistics
Unrestricted switching
[image:39.595.68.461.495.725.2]