University of Warwick institutional repository: http://go.warwick.ac.uk/wrap
A Thesis Submitted for the Degree of PhD at the University of Warwick
http://go.warwick.ac.uk/wrap/61774
This thesis is made available online and is protected by original copyright. Please scroll down to view the document itself.
Perceived E-Procurement Quality:
Exploring and measuring the construct at a
tactical level within the public sector
By
Alistair Brandon – Jones
A thesis submitted in partial fulfilment of the requirements
for the degree of Doctor of Philosophy
Exploring Perceived EPQ. Alistair Brandon-Jones
TABLE OF CONTENTS
LIST OF FIGURES 7
LIST OF TABLES 8
ABBREVIATIONS 10
ACKNOWLEDGEMENTS 11
DECLARATION 12
ABSTRACT 13
CHAPTER 1: INTRODUCTION 15
1.1BACKGROUND 15
1.2RESEARCH OBJECTIVES &QUESTIONS 15
1.3RELEVANT LITERATURE 16
1.4RESEARCH PROCESS &THESIS STRUCTURE 17
CHAPTER 2: THE FOUNDATIONS OF PERCEIVED EPQ 20
2.1E-PROCUREMENT &PERCEIVED EPQ 20
2.1.1DEFINING E-PROCUREMENT 20
2.1.2THE FINANCIAL IMPACT OF E-PROCUREMENT 23
2.1.3IMPACT ON TRANSACTION COSTS 24
2.1.4IMPACT ON PRICE 25
2.1.5E-PROCUREMENT COMPLIANCE 28
2.1.6THE ROLE OF PERCEIVED EPQ 29
2.1.7THE NEED TO EXPLORE PERCEIVED EPQ 31
2.2SERVICE QUALITY 32
2.2.1SERVICE QUALITY &SATISFACTION:TWO DIFFERENT CONSTRUCTS 32
2.2.2SERVICE QUALITY AT A THEORETICAL LEVEL 33
2.2.3SERVICE QUALITY AT AN OPERATIONAL LEVEL 34
2.2.4MEASURING SERVICE QUALITY –THE ‘AMERICAN’PERSPECTIVE 35
2.2.5THEORETICAL UNDERPINNING OF SERVQUAL 37
2.2.6CONTENT VALIDITY OF SERVQUAL 38
2.2.7CONSTRUCT VALIDITY OF SERVQUAL 40
2.2.8PREDICTIVE VALIDITY OF SERVQUAL 44
2.2.9CONCLUSION ON SERVQUAL IN AN EXTERNAL SETTING 47
SUMMARY 49
CHAPTER 3: THE PILLARS OF PERCEIVED EPQ 51
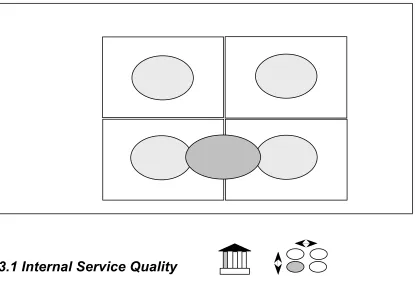
3.1INTERNAL SERVICE QUALITY 51
3.1.1ISQDEFINED 52
3.1.2DIFFERENCES BETWEEN EXTERNAL &INTERNAL CUSTOMERS 54
3.1.3ISQRESEARCH 56
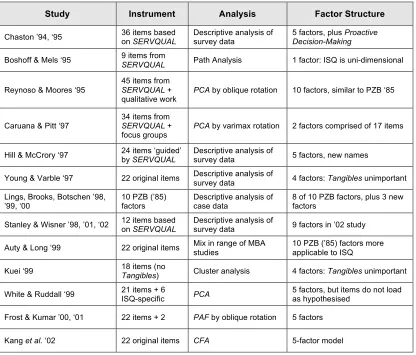
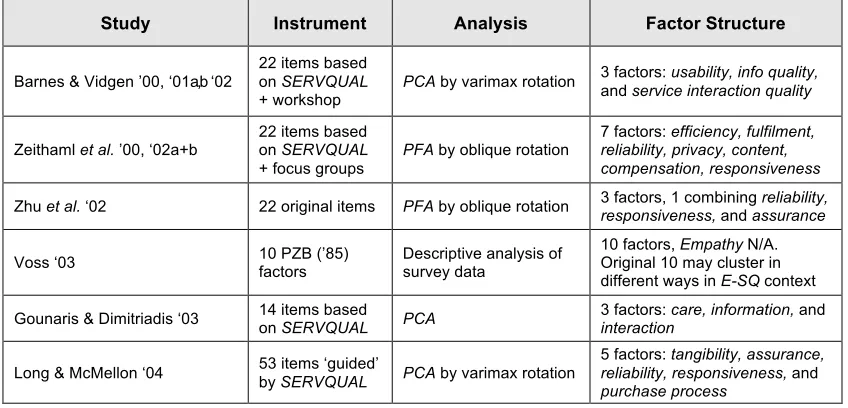
3.1.4MEASURING ISQ WITH SERVQUAL 58
3.1.5ISQ-SPECIFIC MEASUREMENT SCALES 64
3.1.6CONCLUSION ON ISQMEASUREMENT 69
3.2INFORMATION SYSTEMS QUALITY 72
3.2.1TRADITIONAL MEASUREMENT OF INFORMATION SYSTEMS QUALITY 72
3.2.2THE SERVICE COMPONENT IN INFORMATION SYSTEMS QUALITY 74
Exploring Perceived EPQ. Alistair Brandon-Jones
3.2.4CRITIQUE OF SERVQUALAPPLICATION TO INFORMATION SYSTEMS QUALITY 77
3.2.5CONCLUSION ON INFORMATION SYSTEMS QUALITY MEASUREMENT 78
3.3E-SERVICE QUALITY 80
3.3.1PRACTITIONER MEASURES OF E-SQ 81
3.3.2E-SQMEASURES USING INFORMATION SYSTEMS RESEARCH 82
3.3.3MEASURING E-SQ USING ADAPTATIONS OF SERVQUAL 83
3.3.4OTHER ACADEMIC MEASURES OF E-SQ 87
3.3.5CONCLUSION ON ESQMEASUREMENT 90
3.4RESEARCH QUESTIONS 93
SUMMARY 94
CHAPTER 4: RESEARCH DESIGN & METHODS 99
4.1PHILOSOPHICAL OPTIONS 99
4.1.1ONTOLOGICAL ASSUMPTIONS 99
4.1.2EPISTEMOLOGICAL ASSUMPTIONS 100
4.1.3HUMAN NATURE ASSUMPTIONS 102
4.1.4METHODOLOGICAL ASSUMPTIONS 103
4.1.5ASSUMPTIONS ALONG THE OBJECTIVIST-SUBJECTIVIST CONTINUUM 104
4.2RESEARCH DESIGN &METHODS OPTIONS 104
4.2.1EXTENT OF INTERFERENCE 105
4.2.2TIME HORIZON 105
4.2.3RESEARCH SETTING 105
4.2.4ROLE OF RESEARCHER 106
4.2.5EXPERIMENTAL RESEARCH 106
4.2.6SURVEY RESEARCH 107
4.2.7CASE STUDY RESEARCH 107
4.2.8QUALITATIVE RESEARCH 107
4.2.9ACTION RESEARCH 108
4.2.10METHOD OPTIONS 108
4.3PHILOSOPHICAL,RESEARCH DESIGN &METHODS DECISIONS 110
4.3.1PHILOSOPHICAL DECISIONS 110
4.3.2RESEARCH DESIGN DECISIONS 112
4.3.3RESEARCH METHOD DECISIONS 113
4.3.4REVIEW OF DECISIONS 116
4.4CASE STUDY RESEARCH 117
4.4.1CASE STUDY TYPE 118
4.4.2NUMBER OF CASES 118
4.4.3CASE SELECTION 119
4.4.4LEVEL OF ANALYSIS 125
4.4.5CONCLUSION ON CASE STUDY APPROACH 126
4.5RESEARCH METHODS –PHASE 1&2 127
4.5.1PHASE 1&2INTERVIEW DESIGN 127
4.5.2PHASE 1DATA COLLECTION 128
4.5.3PHASE 1PREPARATION FOR ANALYSIS 129
4.5.4PHASE 1ANALYSIS 130
4.5.5PHASE 2DATA COLLECTION 130
4.5.6PHASE 2PREPARATION FOR ANALYSIS 132
4.5.7PHASE 2ANALYSIS 132
4.5.8CONCLUSION ON PHASE 1&2INTERVIEW METHODS 133
4.6RESEARCH METHODS –PHASE 3 134
4.6.1PHASE 3QUESTIONNAIRE DESIGN 135
4.6.2PHASE 3DATA COLLECTION 137
Exploring Perceived EPQ. Alistair Brandon-Jones
4.6.4PHASE 3ANALYSIS 140
4.6.5CONCLUSION ON PHASE 3QUESTIONNAIRE METHODS 141
4.7RESEARCH METHODS –REPLICATION STUDY 142
4.7.1REPLICATION QUESTIONNAIRE DESIGN 142
4.7.2REPLICATION DATA COLLECTION 143
4.7.3REPLICATION PREPARATION FOR ANALYSIS 143
4.6.4REPLICATION ANALYSIS 144
4.6.5CONCLUSION ON REPLICATION STUDY QUESTIONNAIRE METHODS 144
4.8ENSURING QUALITY OF RESEARCH 145
4.8.1ENSURING RELIABILITY 146
4.8.2ENSURING CONSTRUCT VALIDITY 146
4.8.3ENSURING INTERNAL VALIDITY 147
4.8.4ENSURING EXTERNAL VALIDITY 147
4.8.5CONCLUSION ON QUALITY OF DESIGN 148
SUMMARY 148
CHAPTER 5: PHASE 1 & 2 EMPIRICAL ANALYSIS 153
5.1DELINEATING PERCEIVED EPQ 153
5.1.1PERCEIVED EPQOPEN CODES 154
5.1.2PERCEIVED EPQ–FROM OPEN CODES TO SELECTIVE CODES 154
5.2PROPOSED COMPONENTS OF PERCEIVED EPQ–SYSTEM 158
5.2.1FMSINTEGRATION 158
5.2.2INVOICE RECONCILIATION 159
5.2.3SYSTEM CONFIGURABILITY 160
5.2.4REPORTING CAPABILITY 160
5.2.5PROCESSING COMPLEX ORDERS 161
5.2.6SYSTEM SECURITY 162
5.2.7SYSTEM AVAILABILITY 163
5.2.8SCREEN LOADING 164
5.2.9SYSTEM NAVIGATION 165
5.2.10VISUAL APPEAL 166
5.2.11LOADED SUPPLIERS 167
5.2.12LOADED CATALOGUES 168
5.2.13EASE OF SEARCH 168
5.2.14ORDER PROCESSING SPEED 169
5.2.15EASE OF AUTHORISATION 170
5.2.16ORDERS TO SUPPLIERS 171
5.2.17ORDER LEAD-TIME 172
5.2.18ON-TIME DELIVERY 172
5.2.19ORDER ACCURACY 173
5.3PROPOSED COMPONENTS OF PERCEIVED EPQ–SUPPORT 174
5.3.1SUPPORT AVAILABILITY 174
5.3.2SUPPORT RELIABILITY 175
5.3.3SUPPORT RESPONSIVENESS 175
5.3.4KNOWLEDGE 176
5.3.5TALKING USER’S LANGUAGE 177
5.3.6SUPPORT FLEXIBILITY 178
5.3.7PROBLEM RESOLUTION 178
5.3.8CONFIDENTIALITY 179
5.3.9FRIENDLINESS 180
5.3.10CONCERN SHOWN 180
5.3.11TIMELY TRAINING 181
Exploring Perceived EPQ. Alistair Brandon-Jones
5.3.13INFORMATION PROVISION 182
5.3.14ENCOURAGING FEEDBACK 183
5.3.15CONCLUSION ON SELECTIVE EPQCODES 184
5.4SELECTIVE EPQCODE VALIDATION 187
5.4.1DESCRIPTIVE DATA FROM PHASE 2INTERVIEWS 187
5.4.2TESTING THE COMPONENTS OF PERCEIVED EPQ 189
SUMMARY 191
CHAPTER 6: PHASE 3 EMPIRICAL ANALYSIS 193
6.1PERCEIVED EPQFACTOR ANALYSIS 193
6.1.1METHOD SELECTION 194
6.1.2FACTOR DESIGN 194
6.1.3TESTING ASSUMPTIONS 196
6.1.4RETENTION OF FACTORS 202
6.1.5EXTRACTION 203
6.1.6ROTATION 204
6.1.7INTERPRETATION 205
6.1.8SCALE PURIFICATION 206
6.1.9CREATION OF COMPOSITE MEASURE 207
6.1.10FINAL FACTOR SOLUTION 208
6.2EPQSCALE VALIDATION 211
6.2.1EPQSCALE RELIABILITY 212
6.2.2EPQSCALE CONTENT VALIDITY 214
6.2.3EPQSCALE CONSTRUCT VALIDITY 215
6.2.4PREDICTIVE VALIDITY 216
6.2.5VALIDATION CONCLUSION 220
6.3COMPARING PERCEIVED EPQOPERATIONALISATIONS 221
6.3.1RECAP OF DEBATES 222
6.3.2SINGLE-STATEMENT EPQFACTOR ANALYSIS 224
6.3.3SINGLE-STATEMENT EPQSCALE VALIDATION 225
6.3.4CONCLUSION ON PERCEIVED EPQOPERATIONALISATION 229
SUMMARY 231
CHAPTER 7: REPLICATION STUDY EMPIRICAL ANALYSIS 233
7.1REPLICATION PRE-ANALYSIS RESULTS 233
7.2REPLICATION FACTOR ANALYSIS 235
7.3REPLICATION VALIDATION 236
7.4MODIFYING THE EPQSCALE 244
7.5CONCLUSION ON EPQSCALE REPLICATION 246
CHAPTER 8: CONCLUSIONS & CONTRIBUTIONS 248
8.1DEFINING PERCEIVED EPQ 248
8.1.1WHAT ARE THE COMPONENTS OF PERCEIVED EPQ? 250
8.1.2WHAT IS THE STRUCTURE OF PERCEIVED EPQ? 251
8.1.3HOW CAN PERCEIVED EPQ MEASUREMENT BE OPERATIONALISED? 252
8.2QUALITY OF FINDINGS &RESEARCH LIMITATIONS 253
8.2.1QUALITY OF FINDINGS 254
8.2.2RESEARCH LIMITATIONS 255
Exploring Perceived EPQ. Alistair Brandon-Jones
8.3.1VALUE TO ACADEMICS 257
8.3.2VALUE TO PRACTITIONERS 259
8.4FUTURE RESEARCH 260
8.4.1REPLICATING THE EPQSCALE 260
8.4.2DEVELOPING COMPLIANCE CONSTRUCTS AND EXPLORING RELATIONSHIPS 261
8.4.3COMPARING THE EPQSCALE WITH ‘BROAD’SCALES 263
8.4.4EXPANDING THE EPQMODEL 264
FINAL THOUGHTS 265
REFERENCES 266
APPENDICES 286
APPENDIX 1.PHASE 1INTERVIEWEES 286
APPENDIX 2.PHASE 1INTERVIEW GUIDE 287
APPENDIX 3.POST-INTERVIEW CONTACT SUMMARY SHEET 288
APPENDIX 4.EXAMPLE OF CODED TRANSCRIPT 289
APPENDIX 5.PHASE 2INTERVIEWEES 291
APPENDIX 6.PHASE 2INTERVIEW GUIDE 292
APPENDIX 7.PERCEIVED EPQQUESTIONNAIRE 295
APPENDIX 8.COVER LETTER 300
APPENDIX 9.PHASE 3RESPONDENTS (NOVEMBER 2004) 301
APPENDIX 10.PHASE 2DESCRIPTIVE DATA 302
Exploring Perceived EPQ. Alistair Brandon-Jones
List of Figures
FIGURE 1.FOUNDATION &PILLARS OF PERCEIVED EPQ ... 16
FIGURE 2.GENERIC RESEARCH PROCESS ... 17
FIGURE 3.THESIS STRUCTURE ... 19
FIGURE 4.CLASSIFYING E-PROCUREMENT TRANSACTIONAL STRUCTURES ... 22
FIGURE 5.FINANCIAL IMPACT OF E-PROCUREMENT ... 23
FIGURE 6.THE ROLE OF E-PROCUREMENT COMPLIANCE ... 29
FIGURE 7.THE ROLE OF PERCEIVED EPQ ... 31
FIGURE 8.LITERATURE RELATED TO PERCEIVED EPQ ... 31
FIGURE 9.GAPMODEL ... 35
FIGURE 10.MODELLING PERCEIVED EPQ ... 50
FIGURE 11.LITERATURE FRAMEWORK ... 51
FIGURE 12.SERVQUALAPPLICATIONS CONTINUUM ... 58
FIGURE 13.SPECTRUM OF TANGIBILITY ... 74
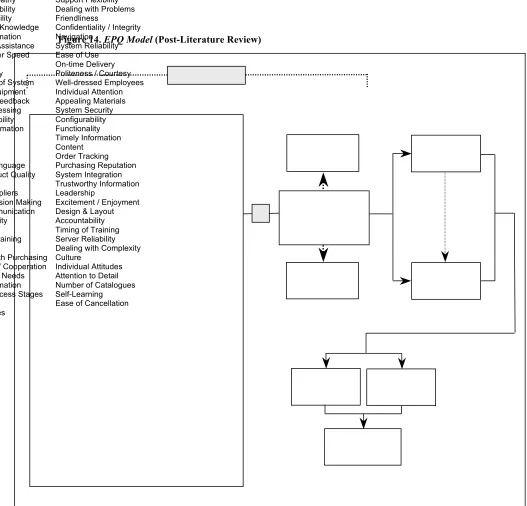
FIGURE 14.EPQMODEL (POST-LITERATURE REVIEW) ... 98
FIGURE 15.ASCHEMA FOR ANALYSING ASSUMPTIONS ABOUT THE NATURE OF SOCIAL SCIENCE ... 100
FIGURE 16.THE REAL, THE ACTUAL, AND THE EMPIRICAL ... 102
FIGURE 17.MARKETPLACE FUNCTIONALITY ... 121
FIGURE 18.CATEGORISATION OF ORDERS FOR MARKETPLACE MEMBERS ... 122
FIGURE 19.MEMBERS OF ESSEX MARKETPLACE ... 123
FIGURE 20.VOLUME-VARIETY DIMENSIONS OF PRODUCTS/SERVICE EXCHANGED IN CASES ... 125
FIGURE 21.4-STEP RESEARCH PROCESS ... 126
FIGURE 22.AXIAL CODING BOARDS ... 131
FIGURE 23.EMPIRICAL ANALYSIS PROCESS DIAGRAM ... 152
FIGURE 24.PERCEIVED EPQSELECTIVE CODES ... 157
FIGURE 25.SCATTER PLOT:AVERAGE EPQVARIABLE TO OEPQRATING ... 189
FIGURE 26.EPQMODEL (POST-PHASE 1&2ANALYSIS) ... 192
FIGURE 27.FACTOR ANALYSIS PROCESS ... 194
FIGURE 28.HISTOGRAM &PPPLOT OF STANDARDISED RESIDUALS ... 199
FIGURE 29.SCATTER PLOT OF PREDICTED VERSUS ACTUAL RESIDUALS ... 199
FIGURE 30.TYPICAL RELATIONSHIP BETWEEN EPQVARIABLES ... 200
FIGURE 31.TYPICAL HISTOGRAM,PP&QQPLOTS ... 200
FIGURE 32.EPQSCALE SCREE PLOT ... 202
FIGURE 33.TYPES OF VARIANCE USED IN FACTOR ANALYSIS ... 204
FIGURE 34.HISTOGRAM OF EPQRESIDUALS ... 220
FIGURE 35.HISTOGRAM OF SINGLE-STATEMENT EPQRESIDUALS ... 229
FIGURE 36.EPQQUESTION MODIFICATION ... 231
FIGURE 37.EPQMODEL (POST-PHASE 3ANALYSIS) ... 232
FIGURE 38.EPQMODEL (POST-REPLICATION 1) ... 247
Exploring Perceived EPQ. Alistair Brandon-Jones
List of Tables
TABLE 1.SOURCES OF TRANSACTION &PRICE SAVINGS ... 27
TABLE 2.SERVQUALAPPLICATIONS IN SERVICE QUALITY LITERATURE ... 48
TABLE 3.SERVQIALAPPLICATIONS IN ISQLITERATURE ... 63
TABLE 4.RELEVANT VARIABLES FROM ISQLITERATURE ... 71
TABLE 5.SERVQUALAPPLICATIONS IN INFORMATION SYSTEMS QUALITY LITERATURE ... 78
TABLE 6.RELEVANT VARIABLES FROM INFORMATION SYSTEMS QUALITY LITERATURE ... 80
TABLE 7.SERVQUALAPPLICATIONS IN E-SQLITERATURE ... 87
TABLE 8.RELEVANT VARIABLES FROM E-SQLITERATURE ... 92
TABLE 9.RELEVANT VARIABLES FROM LITERATURE REVIEW ... 96
TABLE 10.BASIC ASSUMPTIONS ALONG THE OBJECTIVIST-SUBJECTIVIST CONTINUUM ... 104
TABLE 11.RESEARCH METHODS &THEIR USE IN THE STUDY ... 116
TABLE 12.PHILOSOPHICAL,RESEARCH DESIGN &METHODS DECISIONS ... 117
TABLE 13.GENERAL CHARACTERISTICS OF CASES (SEP 04) ... 124
TABLE 14CASE STUDY APPROACH DECISIONS ... 126
TABLE 15.PERCEIVED EPQCLUSTER REVIEW GROUP ... 133
TABLE 16.INTERVIEW METHOD DECISIONS (PHASE 1&PHASE 2) ... 134
TABLE 17.CAUSES OF MISSING DATA ... 138
TABLE 18.DEALING WITH OUTLIERS ... 139
TABLE 19.EPQSCALE VALIDATION ... 140
TABLE 20.QUESTIONNAIRE METHOD DECISIONS (PHASE 3) ... 141
TABLE 21.QUESTIONNAIRE METHOD DECISIONS (REPLICATION 1) ... 145
TABLE 22.TESTING CASE STUDY DESIGN ... 148
TABLE 23.KEY DECISIONS MADE FOR THE PERCEIVED EPQSTUDY ... 150
TABLE 24.PERCEIVED EPQOPEN CODES ... 155
TABLE 25.PERCEIVED EPQVARIABLES &THEIR RELATIONSHIP WITH ANTECEDENT LITERATURE ... 185
TABLE 26.PHASE 2SUMMARY DATA ... 188
TABLE 27.PEARSON CORRELATION:OEPQRATING &AVERAGE EPQVARIABLE ... 190
TABLE 28.LINEAR REGRESSION:AVERAGE EPQ TO OEPQRATING ... 190
TABLE 29.LINEAR REGRESSION:ALL EPQVARIABLES TO OEPQRATING ... 190
TABLE 30.STEPWISE REGRESSION:ALL EPQVARIABLES TO OEPQRATING ... 191
TABLE 31.MISSING DATA ... 197
TABLE 32.TABULATED MISSING DATA PATTERNS ... 197
TABLE 33.MISSING DATA T-TESTS ... 198
TABLE 34.CASEWISE DIAGNOSTICS FOR OUTLIERS ... 199
TABLE 35.SUMMARY OF EPQCORRELATIONS ... 201
TABLE 36.KMO&BARTLETT’S TEST ... 202
TABLE 37.EPQSCALE EIGENVALUES ... 203
TABLE 38.GUIDELINES FOR IDENTIFYING SIGNIFICANT FACTOR LOADINGS ... 205
TABLE 39.DATA REDUCTION OPTIONS ... 207
TABLE 40.SUMMARY OF EFAPROCESS ... 208
TABLE 41.PERCEIVED EPQFACTOR SOLUTION ... 209
TABLE 42.EPQSCALE CRONBACH ALPHAS ... 213
TABLE 43.EPQSCALE ITEM-TO-TOTALS ... 213
TABLE 44.EPQEXPERT PANEL ... 215
TABLE 45.PEARSON CORRELATION:EPQSCALE &OEPQRATING ... 216
TABLE 46.LINEAR REGRESSION:EPQSCORE TO OEPQRATING ... 216
TABLE 47.LINEAR REGRESSION:SIX EPQFACTORS TO OEPQRATING ... 216
TABLE 48.STEPWISE REGRESSION:SIX EPQFACTORS TO OEPQRATING ... 217
TABLE 49.EPQREGRESSIONS ANOVA ... 218
TABLE 50.EPQREGRESSION COEFFICIENTS ... 219
TABLE 51.EPQCASE-WISE DIAGNOSTICS ... 219
TABLE 52.EPQRESIDUAL STATISTICS ... 220
TABLE 53.EPQSCALE VALIDATION SUMMARY ... 221
TABLE 54.EPQEXPECTATIONS ... 223
TABLE 55.SINGLE-STATEMENT EPQFACTOR SOLUTION ... 224
Exploring Perceived EPQ. Alistair Brandon-Jones
TABLE 57.SINGLE-STATEMENT EPQITEM-TO-TOTALS ... 226
TABLE 58.LINEAR REGRESSION:SINGLE-STATEMENT EPQ TO OEPQRATING ... 227
TABLE 59.LINEAR REGRESSION:SINGLE-STATEMENT EPQFACTORS TO OEPQRATING ... 227
TABLE 60.STEPWISE REGRESSION:SINGLE-STATEMENT EPQFACTORS TO OEPQRATING ... 227
TABLE 61.SINGLE-STATEMENT EPQANOVA ... 228
TABLE 62.SINGLE-STATEMENT EPQREGRESSION COEFFICIENTS ... 228
TABLE 63.SINGLE-STATEMENT EPQCASE-WISE DIAGNOSTICS ... 229
TABLE 64.SINGLE-STATEMENT EPQRESIDUAL STATISTICS ... 229
TABLE 65.EPQSCALE VALIDATION:PAIRED-STATEMENTS VS.SINGLE-STATEMENTS ... 230
TABLE 66.EPQFACTOR SOLUTION FOR REPLICATION STUDY ... 235
TABLE 67.EPQSCALE OPTIONS ... 237
TABLE 68.CORRELATIONS BETWEEN EPQ FACTORS,COMPOSITE EPQ AND OEPQRATINGS ... 242
TABLE 69.LINEAR REGRESSION ACROSS SETTINGS:EPQSCORE TO OEPQ ... 243
TABLE 70.REGRESSION ACROSS SETTINGS:EPQFACTORS TO OEPQRATING ... 243
TABLE 71.INTERNAL VALIDITY OF EPQSCALE ... 254
Exploring Perceived EPQ. Alistair Brandon-Jones
Abbreviations
ANOVA Analysis of Variance
B2B Business to Business
B2C Business to Consumer
BACS Bankers Automated Clearing System
BV8 Best Value Performance Indicator
CC County Council
CFA Confirmatory Factor Analysis
EDI Electronic Date Interchange
EFA Exploratory Factor Analysis
EGS E-Government Solutions Ltd
EMI Essex Marketplace Implementation
EP E-Procurement
EPQ E-Procurement Quality
ERP Enterprise Resource Planning
E-SQ E-Service Quality
EUCS End-User Computing Satisfaction
FMS Financial Management System
IDeA Improvement & Development Agency
ISS Information Systems Success Model
ISQ Internal Service Quality
IT Information Technology
KMO Kaiser-Meyer-Olkin Measure of Sampling Adequacy
LAN Local Area Network
LAUG Local Authority User Group
MAR Missing at Random
MCAR Missing Completely at Random
MRO Maintenance, Repair & Operation
MSE Mean Squared Error
MSR Regression Mean Square
MVA Missing Value Analysis
NASA National Aeronautics & Space Administration
NHS National Health Service
NOAC Next Operation as Customer
NPO Non-Profit Organisation
NPR Non-Product Related Expenditure
OEPQ Overall E-Procurement Quality
OGC Office of Government Commerce
PAF Principal Axis Factor Analysis
PCA Principal Components Factor Analysis
PO Purchase Order
SQ Service Quality
STV Subject to Variable
TQM Total Quality Management
UIS User Information Satisfaction
USISF User Satisfaction with Information Systems Function
WEB Warwick E-Business
Exploring Perceived EPQ. Alistair Brandon-Jones
Acknowledgements
This study has taken a good deal of determination and I’m hugely grateful for the encouragement given to me by numerous people. My wife, Emma, has given me the most wonderful support. She has never once stopped believing in me, even when I have had doubts. Her love has given me the strength to work through problems and to stay positive. Most importantly, she has helped me keep some perspective about what truly matters in life.
My supervisors, Simon Croom and Rhian Silvestro, have been instrumental in the PhD. I have their encouragement, enthusiasm and expertise to thank for starting and finishing the process. Other colleagues in the Business School at Warwick University have given me many useful ideas. Particular thanks go to Hilary Bates, Maureen Meadows, Nigel Slack, and Bob Johnston. Within the broader academic community, I have had a great deal of feedback and encouragement at IPSERA conferences over the past three years. I would particularly like to express my gratitude to Erik van Raaij, Luitzen de Boer, and Marc Reunis – people who find e-procurement really interesting!
Exploring Perceived EPQ. Alistair Brandon-Jones
Declaration
I declare that the work reported in this dissertation is my own1. No part of this dissertation has been submitted to any journal for publication or to any university for any degree, diploma or other qualification.
Alistair Brandon-Jones June 2006
Exploring Perceived EPQ. Alistair Brandon-Jones
Abstract
E-procurement has been heralded as a critical enabler in reducing procurement expenditure. However, many businesses report disappointing results from e-procurement implementation, partly because end-users fail to comply with systems or contracts. End-user perceptions of e-procurement quality are considered an important driver of both system and contract compliance. However, very little is written about what e-procurement quality is and how it might be measured.
This thesis presents the findings of a study exploring e-procurement quality from an end-user perspective (Perceived EPQ). The researcher seeks to develop a scale to measure the construct. In doing so, it is necessary to identify the components and structure of Perceived EPQ, and to examine how measurement may be operationalised. The study presents analysis to answer three research questions:
RQ1: What are the components of Perceived EPQ? RQ2: What is the structure of Perceived EPQ?
RQ3: How can Perceived EPQ measurement be operationalised?
Different areas of literature are examined to determine how Perceived EPQ may be theoretically and operationally defined. Disconfirmation theory, found in much of the Service Quality literature, conceptually underpins Perceived EPQ. At an operational level, the construct is partly informed by E-Procurement, Internal Service Quality, Information Systems Quality and E-Service Quality literature, but most importantly by empirical study.
Exploring Perceived EPQ. Alistair Brandon-Jones
research findings hold up in a distinctly different research context. Empirical analysis suggests a construct made up of 30 components, which are incorporated in a proposed EPQ Scale. These variables group into six dimensions – Training, Professionalism, Processing, Content, Usability, and Specification. The research also examines contingencies for managers to consider when selecting the most appropriate method for measuring Perceived EPQ.
This study is the first to empirically examine Perceived E-Procurement Quality and to develop a tool for its measurement. The conceptual model proposed illustrates the importance of Perceived EPQ in driving e-procurement compliance and ultimately procurement expenditure. The measurement tool – the EPQ Scale – is a useful diagnostic instrument which can highlight areas of weakness in e-procurement delivery. Finally, the contingency approach allows managers to select the most appropriate method of construct measurement based on their own objectives.
Exploring Perceived EPQ. Alistair Brandon-Jones
Chapter 1: Introduction
The research presented in this thesis is about exploring e-procurement quality from an end-user perspective (Perceived EPQ). This chapter provides a brief background into the study and then reviews the research objectives and questions. An overview of relevant literature is then given, followed by details of the thesis structure.
1.1 Background
In 2001, the author carried out an OGC-commissioned project to examine key barriers and enablers to e-procurement implementation (Croom & Brandon-Jones, 2005, 2006). The case-based research focused on organisations that reported either very high or very low levels of success with e-procurement. Evidence from interviews with purchasing managers in a range of industries all pointed to a key concern – the lack of e-procurement compliance, defined as the level of system and contract use. Individuals who were unhappy with e-procurement delivery invariably found alternative ways of buying goods and services. Even when system use was high, the level of contract compliance often failed to meet management expectations. It was clear that those implementing e-procurement were often out of touch with those expected to use the systems. The ability to understand the requirements of potential e-procurement users appears critical in the eventual success or failure of implementation. Within the literature, there is very little discussion of e-procurement quality, as perceived by end users. The lack of antecedent literature was therefore a key motivator in undertaking an in-depth study of Perceived EPQ.
1.2 Research Objectives & Questions
Exploring Perceived EPQ. Alistair Brandon-Jones
The overall aim of this study is to model Perceived EPQ, based on an in-depth investigation of e-procurement users, and develop a tool for its measurement. In doing so, it is necessary to identify the components and structure of Perceived EPQ,and to examine ways to operationalise construct measurement. Research objectives give rise to the following three questions:
RQ1: What are the components of Perceived EPQ? RQ2: What is the structure of Perceived EPQ?
RQ3: How can Perceived EPQ measurement be operationalised?
1.3 Relevant Literature
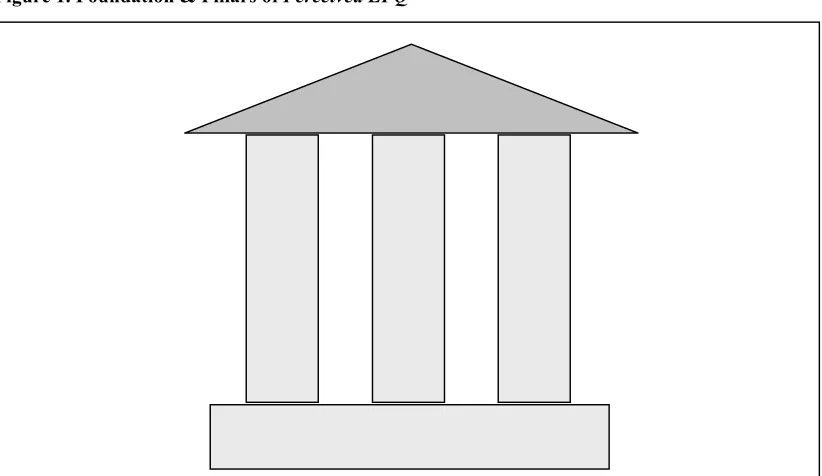
[image:17.595.93.504.524.762.2]Figure 1 illustrates how, in seeking to conceptualise and measure Perceived EPQ, the research draws on various areas of literature. At a theoretical level, disconfirmation theory, used in much of the Service Quality literature, provides the conceptual underpinning of the construct. However, much work in this area is based on very different contexts to e-procurement. Therefore, at a more operational level, the construct is informed by three ‘pillars’ of literature – Internal Service Quality, Information Systems Quality and E-Service Quality – in addition to E-Procurement literature and empirical investigation.
Figure 1. Foundation & Pillars of Perceived EPQ
E
-Se
rv
ic
e
Q
u
a
li
ty
In
fo
rm
a
tio
n
S
y
s
te
m
s
Q
u
a
lit
y
In
te
rn
a
l S
e
rv
ic
e
Q
u
a
lit
y
Exploring Perceived EPQ. Alistair Brandon-Jones
1.4 Research Process & Thesis Structure
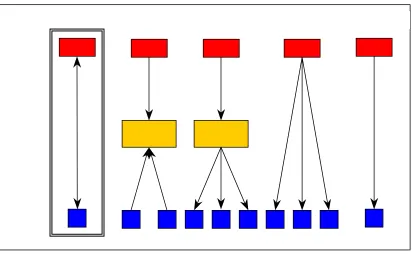
Gill and Johnson (1991) propose a generic framework for conducting research (Figure 2), but note that their linear development sequence is rarely applied in its purest sense. Whilst the process is more strictly used in positivist research, the framework provides a good overview of the key stages in this study.
Figure 2.Generic Research Process
Gill & Johnston, 1991
Chapter 2 begins by reviewing the e-procurement literature that relates to the study. Having explored the financial impact of system implementation and the importance of user compliance in delivering savings, the role of Perceived EPQ is addressed. The second section establishes the theoretical foundations of the construct within the Service Quality literature. It particularly focuses on the efficacy of the widely-used SERVQUAL scale (Parasuraman et al. 1988) at a theoretical and operational level.
Chapter 3 explores the three pillars of literature on which the Perceived EPQ construct is based. Most Service Quality literature considers service as it relates to external customers in an off-line setting. However, Perceived EPQ is grounded in a mixed (on-line/off-line) internal customer context. Internal Service Quality, Information Systems Quality, and E-Service Quality occupy different areas within the literature framework. As such, these areas are particularly relevant in delineating Perceived EPQ, because of their internal focus (Internal Service Quality), on-line focus (E-Service Quality), or both (Information Systems Quality). The chapter finishes by detailing the three research questions.
Chapter 4 reviews the meta-theoretical and methodological assumptions of the study. The first section examines the philosophical options related to ontology, epistemology, human nature, and methodology. The second section examines research design and methods options, considering the level of interference, time horizon, research setting, research approaches, and method options. The third section presents Identify
an area of study
Select the research
topic
Present the findings Analyse
the data Decide
the approach
Collect the data Formulate
Exploring Perceived EPQ. Alistair Brandon-Jones
the decisions made concerning philosophy, research design, and methods for this study. This is followed by more specific detail of the approach selected for the research, considering case selection in the U.K. and Holland, design, collection, preparation, and analysis. Finally, tactics for ensuring quality of research are reviewed.
Chapter 5 presents empirical analysis from Phase 1 and 2 of the study, with the objectives of delineating Perceived EPQ and developing a measurement scale for the construct. The first section presents data from the coding process, with the aim of defining and refining components of Perceived EPQ. The final set of selective codes is presented in the second and third sections. The last section presents analysis which validates these components. Based on this analysis, a measure of Perceived EPQ – the EPQ Scale – is proposed.
Chapter 6 presents empirical analysis from Phase 3 of the study, with the aim of examining the structure of Perceived EPQ¸ validating the proposed EPQ Scale, and assessing alternative ways to operationalise construct measurement. The structure of Perceived EPQ is examined through factor analysis, with the solution then assessed for reliability, content validity, construct validity, and predictive validity. The chapter ends by examining the relative merits of paired-statement and single-statement approaches to operationalising Perceived EPQ measurement.
Chapter 7 presents analysis from a replication study, with the aim of testing findings from the main study. The replication in a Dutch university is focused on assessing the applicability of the EPQ Scale to a different e-procurement context and suggesting any areas for improvement. The chapter presents pre-test analysis prior to factor analysis of data. Validation efforts consider the reliability and validity of three different EPQ Scale options – the original U.K. scale, the Dutch scale, and a ‘robust’ scale comprising only the items that load on the same factors across both studies.
Exploring Perceived EPQ. Alistair Brandon-Jones
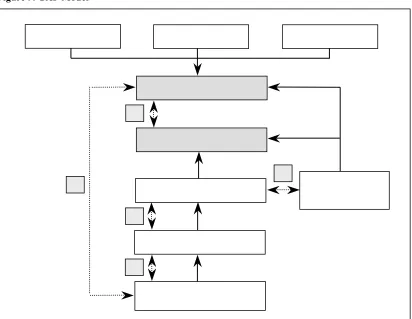
academics and practitioners. Opportunities for further research are then presented and final thoughts are reported to conclude the thesis. Figure 3 shows the structure of the thesis.
Figure 3. Thesis Structure
At the start of each chapter, this figure is shown, to illustrate the position of the reader within the research process. In addition, mini-diagrams are used within chapters, as a visual pointer to what is covered in different sections.
Existing Theory
Research Design & Methods
Scale Development
Scale Refinement & Validation
Scale Replication
Conclusions & Contributions
Exploring Perceived EPQ. Alistair Brandon-Jones
Chapter 2: The Foundations of Perceived EPQ
This chapter begins by reviewing the e-procurement literature that relates to the study. Having explored the financial impact of system implementation and the importance of user compliance in delivering savings, the role of Perceived EPQ is addressed. The second section seeks to establish the theoretical foundations of Perceived EPQ within the Service Quality literature. In particular it examines the use of disconfirmation theory in modelling service quality. Subsequently, the work of Parasuraman, Zeithaml and Berry (1985-1994) is reviewed, including the ongoing debate over the validity of their SERVQUAL methodology and its application to various research contexts.
2.1 E-Procurement & Perceived EPQ
This section explores the e-procurement literature related to the study. Having defined terms, it examines a key agenda for many e-procurement academics – the financial impact of implementation. The affect of compliance in delivering transaction and price savings is then reviewed. The section concludes by exploring the role of Perceived EPQ in driving compliance and ultimately delivering potential financial benefits of e-procurement.
2.1.1 Defining E-Procurement
Harink (2003) refers to e-procurement as the use of various forms of communication technology (usually web-based) at some or all stages of the procurement process. This may include initial need identification and specification, through the search, sourcing and negotiation stage of contracts and order placement, and on to include mechanisms that register receipt, trigger payment and support post-supply evaluation. Of the limited number of authors who distinguish between types of e-procurement, de Boer et al. (2002) and Harink (2003) are perhaps the most useful. de Boer et al. (2002)
Research Design & Methods
Scale Development
Scale Refinement & Validation
Scale Replication
Conclusions & Contributions Existing
Theory
Exploring Perceived EPQ. Alistair Brandon-Jones
suggest that e-procurement can be broken down into sourcing, tendering, e-reverse auctioning, e-MRO, Web-based ERP and e-informing.
E-Sourcing tools are designed to facilitate the process of identifying new suppliers. E-Tendering is concerned with sending requests for quotes to potential suppliers and dealing with responses. E-Reverse Auctioning enables buyers to purchase from a number of suppliers using a reverse auction mechanism. E-MRO and Web-based ERP tools are concerned with the process of creating and approving purchase requisitions using Internet technology. Finally, E-Informing systems are aimed at gathering and distributing information, such as spend analysis and system compliance data, from internal and external parties (de Boer et al. 2002). Harink (2003) posits a similar set of e-procurement types, combining e-MRO and Web-based ERP into ‘E-Ordering’, and re-naming e-Informing ‘Purchasing Intelligence’.
The majority of authors seem to treat e-procurement as a single entity despite the fact that in many cases only certain types are actually being examined. Therefore, it is important to clarify the use of the term in this study. E-sourcing, e-tendering, and e-reverse auctioning systems all focus on purchasing at a strategic level. As such, these activities tend to be carried out by the purchasing department or by senior personnel across an organisation. This study is more concerned with e-procurement at a tactical level – activities that include a much broader set of users, sometimes referred to as internal customers (See Section 3.1 for more discussion on this issue). The term ‘e-procurement’ applied in this research is focused on requisitioning, delivery, invoicing, payment, and basic reporting. As such, it relates to the terms E-MRO, Web-based ERP, and E-Informing used by de Boer et al. (2002).
Types of e-procurement systems
Exploring Perceived EPQ. Alistair Brandon-Jones
[image:23.595.94.506.144.398.2]Brandon-Jones (2005) suggest five contrasting exchange stereotypes employed within e-procurement transactions (Figure 4).
Figure 4. Classifying E-Procurement Transactional Structures
Croom & Brandon-Jones (2005)
An Extranet is a network of Intranets that connect organisations and limit access to individuals within those organisations. They are used primarily for shared and collaborative data – such as delivery scheduling and product design data. Pre-Internet, EDI links represented a type of extranet connection, being dedicated to an individual customer.
Exchange refers to trading sites such as the e-Bay B2C e-commerce auction site and the B2B auction service provider Free Markets and Synerdeal. These sites allow buyers or sellers to bid for contracts, which in the case of e-Bay, simply involves bidding for products offered for sale by private as well as commercial various, whilst B2B exchanges provide reverse auction facilities.
A Marketplace is in essence a multi-supplier/multi-products catalogue often hosted and maintained by a third party and access provided to users via Internet or LAN connection. E-Marketplaces often include directories of buyers, e-catalogues, limited access, and charging of suppliers. As such, they are more like trading communities rather than ‘perfect marketplaces.’ (Segev et al. 1999)
Buyer Seller Extranet Exchange Exchange Company Hub
Exploring Perceived EPQ. Alistair Brandon-Jones
Often also called a ‘buy-side’ solution, a Company Hub is similar to a marketplace. However, the buyer hosts and maintains a multi-supplier/multi-product catalogue, rather than a third party organisation
Public Web allows Internet buyers to identify potential suppliers via standard search engines or specialist trading search engines. On-line search and comparison of list prices are typically used for one-off, specialist or low value purchases. Depending on the nature of the supplier’s website facility, orders may be placed on-line, via email or through the more traditional route of telephone, fax or mail.
2.1.2 The Financial Impact of E-Procurement
Given the high percentage of turnover accounted for by purchasing2, one of the key themes in the existing literature is concerned with the financial impact of implementing e-procurement (McManus, 2002). Procurement expenditure may be influenced by reductions in transaction costs and purchase price (Figure 5). Efficiencies arise through the reduced activity needed to complete the requisition-to-payment process, the increased speed of procurement, and the opportunity to lower prices from suppliers (cf. Min & Galle, 1999; Croom, 2000; Emiliani, 2000; Essig & Arnold, 2001; Neef, 2001; Zsidisin & Ellram, 2001; Cox et al. 2002; de Boer et al, 2002; Wyld, 2002). However, the precise financial impact of such efficiencies remains unclear (Lancioni et al. 2000; Knudsen, 2003). The impact of e-procurement on transaction costs and purchase price is now discussed.
Figure 5. Financial Impact of E-Procurement
2 de Boer and Telgen (1998) estimate that purchasing accounts for 60 to 90 percent of total turnover. Transaction
Costs Purchase
Exploring Perceived EPQ. Alistair Brandon-Jones
2.1.3 Impact on Transaction Costs
Transaction costs reflect the work involved in processing an order (Croom & Johnston, 2003). They include the cost of supplier search and selection, processing the order requisition, authorisation, order generation, receipting, invoicing and payment. Nolan (1999) suggests that the cost of raising an order and paying an invoice prior to e-procurement implementation usually exceeds £100. Research by Croom and Johnston (2003) puts the figure between £97.60 and £147.50. The potential for internal process savings is partly determined by the situation prior to e-procurement (de Boer et al. 2002). Only where the existing procurement processes are inefficient or where there are many purchase orders are significant cost savings likely. A number of studies propose percentage reductions in transaction costs resulting from e-procurement implementation. These include 60% (Croom & Johnston, 2003), 66% (Croom, 2000), and 90% in British Telecom (Woodall, 2000). Others suggest reductions per order, including £100 to £2 (Nolan, 1999) $150 to $10-$20 (National Association of Purchasing Management), $75 to $3 (Smeltzer & Ruzicka, 2000), $40-$200 to $1-$20 (Eisenmann, 2002).
Sources of Transaction Savings
Prior to order placement, the use of e-sourcing reduces the time taken to find suppliers of goods or services, increasing the economies of supplier search (Evans & Wurster, 2001; Cox et al. 2002a, 2002b; de Boer et al. 2002; Narasimhan et al. 2003; Presutti, 2003; Harink, 2003; Subramaniam & Shaw, 2004; Croom & Brandon-Jones, 2005). In addition, e-tendering helps to simplify the tender process (de Boer et al. 2002). E-reverse auctions can significantly reduce processing costs through the reduction in cycle time (Emiliani, 2000; Smeltzer & Carr, 2003; Cox & Watson, 2004; Wagner & Schwab, 2004) and negotiation (Jap, 2002). Post purchase, there is an increase in the speed and accuracy of data collection (Croom, 2000).
Exploring Perceived EPQ. Alistair Brandon-Jones
Robinson, 1999; Croom, 2000; Deeter-Schemelz et al. 2001; Barnes et al. 2002); reduced paperwork and improved accuracy (Rammusson, 1999; Lancioni et al. 2000; Neef, 2001; de Boer et al. 2002); process re-design and elimination of tasks, reduced inventory, consolidated invoices and reduced transmission errors (Croom & Johnston, 2003).
Lancioni et al. (2000) argue that process configuration is significantly affected by the implementation of e-procurement. Croom (2000) suggests that the use of IT in automating data dependant tasks can reduce the number of stages in the purchase process. Furthermore, he contends that databases allow the configuration of the purchase process to be analysed over time and modified based on archiving of purchase data and modelling of alternative configurations.
Most authors appear in agreement that e-procurement implementation results in improvements to order cycle time (Croom, 2000; Turban et al. 2000; Zsidisin & Ellram, 2001; Harink, 2003). Cycle time may be reduced as a result of faster product search, fewer input errors, automatic authorisation within pre-set limits, faster delivery, fewer problems with invoice consolidation, and quicker payment to suppliers (Lancioni et al. 2000). This in turn creates the potential for reducing inventory levels and thus minimising working capital (Martin & Hafer, 2002; Presutti, 2003). However, it is worth noting that savings figures in the literature are generally anecdotal and in some cases costs of implementation may outweigh the potential advantages of e-procurement.
2.1.4 Impact on Price
Exploring Perceived EPQ. Alistair Brandon-Jones
There are a number of studies that report price savings accruing from e-procurement implementation. Croom and Johnston (2003) report a range of savings on the price of invoiced goods and services between 5% and 20%, averaging 17%. Based on data from 200 e-reverse auctions, de Boer et al. (2002) identify price reductions of between 10% and 15% for both direct and non-product related goods and services. Presutti (2003) suggests e-procurement implementation creates material savings of between 5% and 20%. KPMG (2000) report a survey of purchasing managers, indicating an average price saving of 8%, whilst Essex County Council report savings of 53% on a million-pound stationery contract.
Sources of Price Savings
Prior to purchase, e-sourcing enables buyers to identify more potential suppliers, increasing the availability of goods, thus reducing purchase price (Evans & Wurster, 2001; Croom & Brandon-Jones, 2005). For example, General Electric uses e-sourcing to search for potential new suppliers. The increase in supply base has allowed the firm to increase purchase leverage and realise price reductions of between 5% and 20% (Presutti, 2003). E-sourcing may be useful in leverage and bottleneckquadrants of the Kraljic matrix (de Boer et al. 2002), but this remains unproven.
Price savings are an important aspect of performance evaluation for e-reverse auctions. A number of authors discuss their role in reducing purchase price (de Boer et al. 2002; Jap, 2002; Martin & Hefer, 2002; Harink, 2003; Subramanian & Shaw, 2004; Wagner & Schwab 2004). Jap (2002) suggests that a key reason behind the growth of online reverse auctions is the significant price reductions that are often realised. Harink (2003) notes that e-reverse auctions are particularly beneficial to buyers in markets where supply exceeds demand. On-line reverse auctions have been extremely successful in reducing purchase prices – the typical price savings achieved is around 16% and these have been used for products as varied as foodstuffs, engineered components and utilities supplies (Croom & Brandon-Jones, 2005).
Exploring Perceived EPQ. Alistair Brandon-Jones
2003). This view is supported in practitioner and general management literature (Electronic Commerce News, 2003; Hayward, 2003; Moore, 2003; Parker, 2003; Trommer, 2003; Wheatley, 2003).
Finally, e-procurement creates significant opportunities for reductions in purchase prices through aggregation of requirements and economies of scale (Turban et al. 2000; Croom, 2000; Croom & Johnston, 2003). Croom (2000) gives an example of one respondent who reduced variety of office stationery from 235 to 38 items within two months of implementing e-procurement. Table 1 summarises the sources of transaction and price savings that may arise through e-procurement implementation.
Table 1. Sources of Transaction & Price Savings
Area Source
Ka la ko ta & R o b in so n ‘9 9 Cr o o m ‘0 0 Em ili a n i ‘ 0 0 Lanc ioni et al . ‘0 0 Tur ban et al . ‘0 0 De e te r-Sc h m e lz et al . ‘0 1 Ev a n s & W u rs te r ‘0 1 Ne e f ‘0 1 Zs idi si n & E llr am ‘01 At tr a n & At tr a n ‘0 2 Ba rn e s et al ‘0 2 De B o e r et al . ‘0 2 Ja p ‘0 2 Ma rt in & H a fe r ‘0 2 Sa sh i & O ’L e a ry ‘0 2 Cr o o m & J o h n st o n ‘0 3 Da vi la et al . ‘0 3 Ha ri n k ‘0 3 Mi n & G a lle ‘0 3 Na ra si m h a n et al . ‘0 3 Pr e su tt i ‘ 0 3 Sm e ltz e r & C a rr ‘0 3 Ye n & N g ‘0 3 Su b ra m a n ia m & Sh a w ‘0 4 Wa g n e r & S ch w a b ‘0 4 Cr o o m & B ra n d o n -Jo n e s ‘0 5 Tr a n s a c ti o n C o s ts E-Sourcing Economies of supplier
search x x x x x x x
E-Tendering Simplification of tendering x
E-Reverse Auctioning
Reduced
cycle-time x x x x
Reduced
negotiation x x x x
E-MRO E-ERP
Reduced
inventory x x x x x x x x x Reduced
cycle time x x x x x x x x x x x x Task
elimination Invoice
consolidation x
Reduced error
in transmission x x x x x x x Increased
automation x x x x
E-Informing Speed & accuracy of data collection x P ur chase P ri ces
E-Sourcing Increased supply base x x x x
E-Reverse
Auctioning Contract price reduction x x x x x x x x x x
E-MRO E-ERP
Aggregation of
requirements x x x x x x x x x
Exploring Perceived EPQ. Alistair Brandon-Jones
2.1.5 E-Procurement Compliance
Within the literature, a number of authors note the importance of e-procurement compliance. The broad idea posited in these studies is that if compliance / adoption is limited, so too are the financial benefits of e-procurement (cf. Croom. 2000; Neef, 2001; Arbin, 2003, 2006; Croom & Johnston, 2003; Harink, 2003; Subramaniam and Shaw, 2004; Cox et al. 2005; Reunis & van Raaij, 2006).
Arbin (2003, 2006) argues that if the potential value of investment is to be achieved, it is critical to get potential users to adopt e-procurement systems when purchasing goods and services. In examining influence tactics for e-procurement, Reunis and van Raaij (2006) note how attractive business cases ‘evaporate’ when user adoption is limited. They suggest that benefits are only achieved when individuals use systems and their contracts appropriately. Croom and Johnston (2003) argue that e-procurement enables purchasing departments to exert increased control over organisational procurement. In line with Neef (2001), they suggest that systems increase transparency and help to point users to the approved supplier or contract. Subramaniam and Shaw (2004) discuss the issues of increased control in ensuring appropriate use. As such, e-procurement implementation is seen to create the ideal conditions for reducing maverick spending (cf. Neef, 2001; de Boer et al. 2002; Croom & Johnston, 2003; Harink, 2003; Subramaniam & Shaw, 2004). The term incorporates the failure of individuals to use an e-procurement system when placing orders and the failure to use mandated contracts within the system. As such maverick spending is composed of two elements – system compliance and contract compliance.
Exploring Perceived EPQ. Alistair Brandon-Jones
Contract compliance is focused on the extent to which individuals comply with mandated contracts within a system. As such, the term considers how an e-procurement system is used, as opposed to if it is used. Contract compliance affects transaction costs in various ways. The use of e-catalogues can significantly reduce processing times through the use of ‘click boxes’ and order ‘cloning’. Additionally, multiple requisitions, from multiple budgets, but for the same supplier, can be aggregated into a single order. Croom and Johnston (2003) note that this reduces processing during receipt, invoice and payment. Contract compliance plays an even bigger role in price savings. The aggregation of requirements creates significant opportunities for price negotiation (cf. Turban et al. 2000; Croom, 2000). As contract use increases, so may the balance of power between the buyer and supplier. As such, contract compliance also may have a significant impact on pre-ordering activities.
In conclusion, the literature illustrates the importance of system and contract compliance in delivering the potential financial benefits of e-procurement (Figure 6).
Figure 6. The Role of E-Procurement Compliance
2.1.6 The Role of Perceived EPQ
In some of the e-procurement literature, the reduction in maverick spending is taken as a given. However, others note the relationship between user perceptions of e-procurement delivery and the level of e-e-procurement compliance (cf.; Marshall et al. 1998; Kennedy & Deeter-Schmelz, 2001; de Boer et al. 2002; Croom & Johnston, 2003; Harink, 2003). High levels of system compliance may be aided by increased transparency that arises from e-procurement implementation (Neef, 2001; Subramaniam & Shaw, 2004). However, where internal customers have low
Transaction Costs Purchase
Prices Procurement Expenditure System
Exploring Perceived EPQ. Alistair Brandon-Jones
perceptions of e-procurement delivery, they will invariably find ways to circumvent official purchase processes (Oliver, 1993; Croom & Johnston, 2003). In addition, internal customers have a choice of how they do business within e-procurement systems. Contract compliance may be even harder to ‘force’ than system compliance (Marshall et al. 1998).
The motivation of buyers to use the internet as a resource for various elements of the purchasing process is investigated by Kennedy and Deeter-Schmelz (2001), who conclude that organizational characteristics and organizational influences are significant motivators to the use of e-procurement. Training and the relative influence of the purchasing function are both key factors influencing the uptake of e-procurement systems. Liao et al (2003) document the challenges for e-procurement implementation in terms of changing established procurement practices in the Taiwanese military. Their research highlights the significance of ‘human deficiencies and faults (i.e. corruption and inefficiency) in the implementation process. Croom and Johnston (2003) argue that e-procurement compliance is strongly influenced by the general disposition of the organization as a whole to the potential benefits of e-procurement. They conclude that reduction in non-compliant actions by users is critical to the achievement of reductions in total procurement expenditure and thus internal service quality should be a key concern when implementing e-procurement.
Exploring Perceived EPQ. Alistair Brandon-Jones
Figure 7. The Role of Perceived EPQ
2.1.7 The Need to Explore Perceived EPQ
[image:32.595.92.505.574.774.2]A review of e-procurement literature emphasises the financial impact of implementation, considering transaction costs and purchase price. In addition, the role of compliance in delivering these savings has been examined. Within the literature, Perceived EPQ is seen as an important driver of compliance. Empirical evidence for this relationship exists in Information Systems research. However, despite its importance in influencing e-procurement compliance, there has been no concerted effort to model Perceived EPQ. Given the paucity of research in the area, it is necessary to draw on other areas of literature in defining Perceived EPQ(Figure 8). At an operational level, Internal Service Quality, Information Systems Quality and E-Service Quality literature can be seen as the pillars upon which the Perceived EPQ construct is largely based. In service measurement, these areas are all influenced by Service Quality literature, which provides the theoretical foundation for the study.
Figure 8. Literature Related to Perceived EPQ
In te rn a l S e rv ic e Q u a lit y
Service Quality Perceived E-Procurement Quality In fo S y s te m s Q u a lit y E -Se rv ic e Q u a li ty Internal Focus External Focus Online Offline Internal Service Quality Information Systems E-Service Quality Service Quality Transaction Costs Purchase Prices Procurement Expenditure System Compliance Perceived
EPQ Contract
Exploring Perceived EPQ. Alistair Brandon-Jones
2.2 Service Quality
With only around twenty-five years of research, Service Quality is a relatively young academic discipline. As such, there remains much debate over how best to define and measure service quality. According to the ‘product-based’ approach, quality reflects differences in measurable attributes of the product (Deming, 1982; Crosby, 1979). In this view, quality is measured by conformance of the product to a predetermined set of specifications. However, as noted by Parasuraman et al. (1985), the quality of services is difficult to measure objectively and it is perceptions of service quality which determine actions or loyalty. This section examines the difference between satisfaction and service quality, and the use of the disconfirmation paradigm in much service quality research. It then examines how various authors have delineated the construct. Finally, the important work of Parasuraman, Zeithaml and Berry (1985-1994) is discussed, including the ongoing debate over the validity of their SERVQUAL methodology and its application to various research contexts.
2.2.1 Service Quality & Satisfaction: Two Different Constructs
Zeithaml (1987) states that service quality can be defined as a customer’s assessment of an entity’s overall excellence. Whilst service quality is similar to the concept of satisfaction, it is also distinct from it (Parasuraman et al. 1988). The debate regarding the relationship between the two constructs appears to be reaching some form of consensus (Bitner & Hubbert, 1994; Caruana & Pitt, 1997). The distinction that is commonly made between satisfaction and service quality is that the former relates to the outcome of an individual service transaction whereas the latter refers to a long-term assessment of overall service delivery (cf. Oliver, 1981; Parasuraman et al. 1988; Bitner 1990; Carman, 1990; Bolten & Drew, 1991; Boulding et al. 1993; Oliver, 1993; Patterson & Johnson, 1993; Taylor, 1992; Zeithaml et al. 1993, Cronin & Taylor, 1994; Johnston, 1995a, 1995b; Caruana & Pitt, 1997). Satisfaction and service quality are conceptually related in that the accumulation of transaction-specific incidents over time determine overall service quality perceptions (Parasuraman et al. 1988). Carman (1990) suggests that a customer references several
Exploring Perceived EPQ. Alistair Brandon-Jones
‘moments of truth’ in the service encounter when assessing service quality. These transaction-specific moments of truth combine to form service quality perceptions.
2.2.2 Service Quality at a Theoretical Level
The disconfirmation paradigm (Oliver, 1980; Cadotte et al. 1987) states that service perceptions are determined by the gap between previously held expectations and perceptions of performance. Disconfirmation is positive when performance exceeds expectations and negative when it falls short of expectations (Ganesh et al. 2000). Lewis and Booms (1983) are among the first to define service quality as the extent to which service delivery matches customer expectations. However, Grönroos (1982) implicitly adopts disconfirmation theory in the perceptions-minus-expectations view of service quality, referred to as ‘Gap Theory’ (Hill & McCrory, 1997).
Oliver (1997) argues that assimilation and contrast effects significantly influence the disconfirmation process. Assimilation effects relate to the importance of previously held expectations in anchoring performance assessments. Therefore, the extent and nature of customer experience is critical in the disconfirmation process (Cadotte et al. 1987). Additionally, assimilation effects are particularly important when the level of performance is ambiguous (Ganesh et al. 2000). Contrast effects relate to the extent to which customers magnify perceptions ratings in line with the direction of disconfirmation (Oliver, 1997). Customers may over-emphasise positive or negative disconfirmation by indicating extreme performance ratings.
Exploring Perceived EPQ. Alistair Brandon-Jones
Smith, 1995; Brady et al. 2002). In adopting the disconfirmation model, there may be a ‘muddying the waters’ in terms of the difference between satisfaction and service quality. Parasuraman et al. (1994a) reject conceptualising service quality as an attitude rather than a disconfirmation process. They note that customer assessments invariably occur relative to some norm (p112). The disconfirmation paradigm is now the dominant view in service quality literature and is a widely used departure point for many researchers seeking to model the construct (Brooks et al. 1999).
2.2.3 Service Quality at an Operational Level
Whilst the majority of service research is underpinned by disconfirmation theory at a cognitive level, there are a wide variety of approaches in measuring service quality at an operational level. There remains considerable debate over how the best to delineate the service quality construct (Jones & Suh, 2000). Attempts to examine the criteria used by customers in assessing service quality have produced different sets of dimensions in various research settings (Johnston, 1994). Brady and Cronin Jr (2001) posit two broad service quality perspectives – the ‘Nordic’ and the ‘American’.
Exploring Perceived EPQ. Alistair Brandon-Jones
2.2.4 Measuring Service Quality – The ‘American’ Perspective
[image:36.595.93.505.416.735.2]Parasuraman et al. (1985) state that service quality has three distinct properties - search, experience and credence. Search relates to the characteristics of a service, which will entice a consumer to make a purchase. Experience considers elements of service quality delivered during or shortly after the purchase of a service. Credence properties are aspects of service that are difficult to evaluate even post-purchase/experience (e.g. a surgeon’s competence). Similar distinctions are made by Heskett et al. (1990) and Zeithaml (1991). Because services have few search properties and it can be difficult to assess credence properties, Parasuraman et al. (1985) argue that ‘consumers typically rely on experience properties when evaluating service quality’. Parasuraman, Zeithaml, and Berry’s research involves the development of a conceptual model of service quality and the development of SERVQUAL to measure the construct. Based on interviews with executives in four U.S. service organisations and focus groups with customers, they present the gap model of service quality (Figure 9).
Figure 9. GAP Model
(Parasuraman et al. 1985) Word of Mouth Expected Service Service Delivery
Perceived Service
Management Perceptions of
Customer Expectations Service SpecificationsWord of Mouth Word of Mouth 3
2
4
1 5 External
Exploring Perceived EPQ. Alistair Brandon-Jones
• Gap 1: Consumer expectations minus management perceptions. Managers fail
to understand the expectations of their customers.
• Gap 2: Service specification gap. Failure of management to translate their
understanding of customer expectations into appropriate service specifications that could deliver on such expectations.
• Gap 3: Not adhering to service specification. Regardless of whether
appropriate service specifications exist, contact personnel may not actually deliver high levels of service to customers.
• Gap 4: Mismanaging customer expectations. Occurs when external
communications to customer promise more than an organisation is able to deliver.
The four service-provider gaps combine to create a fifth gap – the gap between expected service and perceived service. Parasuraman et al. (1985) propose that service quality is a form of overall evaluation and is a function of the magnitude and direction of gap 5 (SQ = Gap 5 = P-E). In turn, gap 5 is determined by the nature of the service-provider gaps associated with the design, marketing, and delivery of services (GAP 5 = f (GAP 1, 2, 3, 4)).
Exploring Perceived EPQ. Alistair Brandon-Jones
SERVQUAL is the most widely used and tested measurement tool in the Service Quality literature (Buttle, 1996; Davis et al. 1999). The majority of SERVQUAL application has occurred in the for-profit sector. However, the tool has also been used to measure service delivery in public and NPO settings. Whilst SERVQUAL has been extensively applied in a variety of contexts, there remains significant debate over the efficacy of the scale at both a theoretical and operational level. There follows a discussion of theoretical underpinning, content validity, construct validity, and predictive validity of SERVQUAL, based on replications in external service settings.
2.2.5 Theoretical Underpinning of SERVQUAL
In line with most service quality research, the SERVQUAL scale is underpinned by disconfirmation theory. Devlin et al. (1993) argue that measuring service relative to expectations is the most appropriate and least biased approach. Whilst the paradigm is dominant within the literature (Boshoff & Gerhard, 1995; Brooks et al. 1999; Silvestro, 2005), there remain questions over the applicability of disconfirmation theory in modelling service quality (Peter et al. 1993).
A number of authors question the validity of SERVQUAL on the basis of its theoretical underpinnings (Anderson, 1992; Cronin & Taylor, 1992 & 1994; Brown et al. 1993; Peter et al. 1993; Teas 1993 & 1994; Brady et al. 2002;). Some suggest that a direct measure of service quality based on attitudinal theory is more appropriate. For example, Cronin & Taylor (1992, 1994) challenge the validity of the P-E approach, instead positing a performance-based measure of service quality – a view that is supported by Smith (1995). However, Parasuraman et al. (1994a) emphasise the fact that their research provides strong support for defining service quality as the gap between expectations and perceptions (p111). They also note the work of other authors (cf. Grönroos, 1982; Lehtinen & Lehtinenen, 1982) that supports the disconfirmation view of service quality. Clearly, a debate remains over the most appropriate theories on which to model service quality.
Exploring Perceived EPQ. Alistair Brandon-Jones
disconfirmation theory in the study. The diagnostic value of the disconfirmation approach is noted by numerous authors (cf. Parasuraman et al. 1994a; Kettinger, 1994). Therefore, it is argued that Perceived EPQ is best defined as a disconfirmation between expectations and perceptions.
2.2.6 Content Validity of SERVQUAL
Content validity is a qualitativeassessment by experts of how well a scale measures a concept. Content validity is determined by how the scale is developed and how well scale items adequately represent the domain of the concept.
The development of the SERVQUAL scale is based on procedures recommended by Churchill (1979). As such, the authors claim to have followed a rigorous and thorough method in delineating service quality (Parasuraman et al. 1988). Technically, ordinal scales should not be used in interval techniques such as factor analysis and regression (Anderson, 1992), but in reality it is usually impossible to collect interval data regarding customer perceptions. Flynn et al. (1990) and Sekaran (2003) both note the use of Likert scales in all forms of data analysis is widespread.