Overlap between internal and external
spatial attention over longer time intervals
Name: Nick Willems
Student number: 206994
First examiner: Rob van der Lubbe
Second examiner: Simone Borsci
Abstract
The current study focuses on the difference and commonalities in both behavioral and neural activity between internal and external spatial attention. This was done by partially replicating a previous study by Van der Lubbe, Bundt, and Abrahamse (2014), with an extension regarding the robustness of internal spatial attentional process over time. It consisted of three conditions, a pre-cue condition concerning external spatial attention, and two post-pre-cue conditions concerning internal spatial attention. Lateralized power spectra, reflecting both stimuli evoked, and internally induced effects were determined to examine the neural activity. Regarding the robustness of internal spatial attention over longer time intervals no hard evidence was found in behavioral data. Both post-cue conditions did seem to show some effects according to the 95% confidence interval. The lateralized power spectra analyses on the raw EEG data did not show hard evidence of deviations in lateralized alpha power in both post-cue conditions. Visual representations of the EEG data did however show differences, suggesting the possibility there are differences between the two. In the replication, responses were faster when the externally attended location corresponded with the required response side, with results suggesting this might also be the case for internally attended items. The lateralized power spectra analyses on the raw EEG data showed increased ipsilateral alpha power at occipito-temporal sites only for externally attended stimuli. These findings cannot definitively answer if internally induced attentional processes change over time, as there was no hard evidence to support this. It can also not further support the view regarding internal and external spatial attention sharing underlying mechanisms. The current study adds to our knowledge that it is possible neural coding of memory representations regarding internal spatial attention change over time, as visual representations of the EEG data show differences between the two post-cue conditions.
Introduction
attention to him when you expect him to start replying (future goal) to hear what he is saying and react to it. Being able to switch your attention between, for example, memories and the outside world is obviously important as we must do this very often on every single day to make sure important information is processed and interactions between ourselves and the outside world would otherwise be nearly impossible.
Regarding attentional processes Chun, Golomb, & Turk-Brown (2009) proposed a new taxonomy, which is based on what type of information is targeted by the attentional process. They distinguish between internal and external attention processes as these processes may work differently. External attention can be regarded as attention that is focused on current perceptual input (seeing, hearing, feeling, etc.), whilst internal attention can be regarded as attention that is
focused on information that is internally ‘generated’ (for example what you’re thinking about
during the conversation). This also means that for external attention the relevant information is presented outside of the body and comes in via the senses, whereas for internal attention the relevant information is in the short-term memory.
Attention is coupled with other systems in the brain, as this is the case for most processes. One of these systems is the memory system. Studies discovered that attention can be influenced by the content of short-term memory1. (Foerster & Schneider, 2018; Downing, 2000; Hollingworth, 2012; Olivers, Meijer, & Theeuwes, 2006) as the memory system can influence the attention system, these authors suggested that there might be an overlap in neural networks or processes involved between memory and attention. Indeed, Foerster & Schneider (2018) did an experiment where a colored cue depicted a target. This target consisted of both a relevant identity and a color which was irrelevant for their task. Participants then had to make a saccade towards the target opposite of a distractor. Their results showed that when the target and cue matched in both identity (which was search-relevant) but also in color (which was search-irrelevant), saccades to the target were both more frequent and faster than without any color match. In the next experiment a cue-distractor color match was introduced. Now the saccade was most likely if the target and cue matched in search-irrelevant color and least likely if the cue and distractor matched in color. In their last experiment they even found that when the cue and target never had the same color, the
1. As ‘working memory’ and ‘short-term’ memory are often used interchangeably, and this paper does not
cue-colored distractors still captured more saccades than different-colored distractors, despite the color being search-irrelevant. This suggests that there is involuntary top-down control by object-based visual working memory1 on external attention processes.
Working memory can influence spatial attention processes for external spatial (visual) attention as shown above, but also for internal spatial attention. Multiple studies examined behavioral tasks that reflect the operation of attention. One such study (Chen, Ye, Xie, Xia, & Mo, 2017) looking at both an attentional word-color task (external attention) and a working memory word-color task (internal attention) found a Stroop effect in both conditions. The authors then conducted a second experiment using both the classic Simon task and a working memory Simon task to see if holding visuo-spatial information in working memory could also influence perceptual judgment the same way that verbal information interferes with perceptual judgment. The Simon task is a task that examines if reaction times are shorter if a response is given at the same side as the visually presented stimuli, than when the response and stimulus side do not correspond; Simon, (1969). A working memory Simon effect of equivalent magnitude to the classical Simon effect was found. Another study investigating the Simon effect (Hommel, 2002) also found that response times decrease if the stimulus and response side correspond with each other, and increase when the stimulus side differs from the response side. These effects were observed in both pre-cue conditions concerning external spatial attention and post-cue conditions regarding internal spatial attention. Meaning that, when non-spatial information about an object is retrieved, this facilitates responses if the response spatially corresponds to the original object location. The authors found that this is even the case when the object is not visible anymore, suggesting external spatial attention does not play a role anymore. These studies together (Foerster & Schneider, 2018; Chen et al., 2017 and Hommel, 2002) show that both external and internal spatial attention can be influenced by what is in working memory.
location before the stimulus, making them externally attend to a specific location. In the post-cue condition the spatial location cue was presented after the stimulus, hence, subjects had to retrieve the stimulus from memory, directing their attention internally. In the neutral condition subjects did not receive any cueing information. After this stimulus and cue, a probe was presented to which participants had to react. Both the internal and external attention condition showed that valid cueing led to quicker responses than invalid cueing, and that invalid cueing reactions were less accurate. Then a follow up study was performed, which ruled out changes in response criteria as the only explanation. These results suggest that on a behavioral level, internal and external attention are hard to distinguish as their results are very similar. This indicates that the processes involving internal attention and the processes involving external attention might also be similar, showing similar brain activation for internal and external spatial attention.
In a subsequent study using fMRI Nobre et al. (2004) used a variant of the same task done by Griffin and Nobre (2003) to identify the neural systems involved in directing attention both internally and externally. They found extensively overlapping networks in the parietal, frontal, and occipital areas. These overlapping areas were also reported during visual spatial orienting tasks before (e.g. (Corbetta & Shulman, 2002; Corbetta, Kincade, & Shulman, 2002)). There was, however, a difference in brain area activation levels between internal and external attention as well: the right parietal cortex seemed more active for the external attention, whereas frontal lobe regions selectively activated during internal attention tasks. Differences between internal and external attention were also found by Tanoue et al. (2013). They showed that Cathodal transcranial direct current stimulation (tDCS) of the frontoparietal network hindered performance of the internal attention tasks more than the external attention tasks when applied to the frontal cortex. tDCS temporarily decreases local activity in the brain. If a decrease of activity in certain brain areas also hinders performance, this brain area is likely involved in the process needed for the task. As the authors propose, internal attention may rely more heavily on the frontal cortex than external attention. This shows overlap between internal and external attention, both behaviorally and in the brain, but also that they are not the same. This suggests there is partial overlap between internal and external attention in the brain.
visual and memory search tasks proceed through a similar mechanism, showing the same posterior contralateral negativity (PCN, often denoted as N2pc). These PCN potentials showed the same time courses and scalp distributions for both tasks. These findings reinforce the idea that internal and external spatial attention have at least partially overlapping neural networks reinforcing the findings of Nobre et al. (2004) who also found overlapping brain area activity.
A more recent study (Van der Lubbe et al., 2014) questions whether this observed pattern in memory search conditions might be related to repetition suppression, the reduction of neural activity associated with repeated exposure to the same visual stimuli. If repetition suppression was present in earlier studies this might have influenced how strong the activity was, reducing the chance of finding effects. They go even further, indicating that discrepancies between internal and external attention may not have been found because of the setup of the task and the type of analyses used. They propose that earlier used methods only look at stimulus-evoked activity and do not pick up internally induced neural activity that is not time-locked to stimulus onset.
(2014) also found faster responses when the response side corresponded with the internally and externally attended location. This provides further support that internal and external spatial attention share underlying neural networks and mechanisms. As internal and external attention show the same kind of results, this suggests there are similar or the same underlying substrates. The study done by Van der Lubbe et al. (2014) not only collaborates and reinforces the results found by earlier studies, but also introduces a new method that can help in discovering if and how strongly the overlap in the brain is between internal and external spatial attention.
The main goal of the current study is to further examine the relationship between internal and external attention. There are a lot of studies that show that internal and external spatial attention show overlap in the brain. Most studies also show that there are differences between the two and that different brain areas are more strongly involved in either internal or external spatial attention. As the differences and similarities between internal and external attention do not seem to be fully explored the current study will be done. Therefore, this study will try to further explore the relationship between internal and external attention regarding not only stimulus evoked, but also internally induced neural activity by partially replicating an earlier study (Van der Lubbe et al., 2014). The choice to partially replicate an earlier study was made because there is a replication crisis going on in psychology (e.g. Lilienfeld, 2017) that shows that when studies are replicated the results for the replicated study do not correspond with the findings of the replication study. To further explore the working of internal spatial attention an additional task will be added in this study as well to see how robust earlier found results regarding internal attention are over longer time intervals as this has not been examined before. The main questions for this study are if earlier found effects of internal spatial attention representations are robust over longer time intervals of not just one second as was most often tested by earlier studies, but if these effects persist over three seconds or longer. The second question is to examine if part of the effects found by the study of Van der Lubbe et al. (2014) can be replicated, further strengthening findings that internal and external spatial attention show strong similarities and can be regarded as at least partially overlapping mechanisms.
were found in earlier studies regarding the internal attention can be replicated at longer time interval between the target and color cue conditions as well. This would further inform us about the robustness of the system underlying internal spatial attention and if information stays visually represented or is altered to a possibly more abstract representation by the brain. As working memory seems to be closely coupled to attentional selection and is stable over multiple seconds the current study expects that internal attentional effects can be found at longer intervals as well. The current study will only look at the behavioral and the LPS method (Van der Lubbe & Utzerath, 2013; Van der Lubbe et al., 2014) to asses if lateralized activity found in earlier studies is replicable. This is done to also reveal activity that is not visible using ERLs (Van der Lubbe & Utzerath, 2013) and to further assess this method and earlier found results.
For a meaningful interpretation of the data, the brain activity patterns should be associated with the behavioral performance. In line with the previous study (Van der Lubbe et al., 2014) we expect to find a close overlap between the internal and external spatial attention condition in both behavioral and EEG data. We furthermore expect to find increased alpha power ipsilaterally compared to contra-laterally using the LPS in both the pre-cue condition regarding external spatial attention, and both post-cue conditions regarding internal spatial attention. Furthermore, we expect to find a great deal of overlap between the two post conditions for both behavioral and EEG data if the underlying brain mechanisms involved in attentional selection are stable over time.
Method
Participants
sciences at the university of Twente, which was in line with the declaration of Helsinki about research involving human subjects
Stimuli, task and procedure
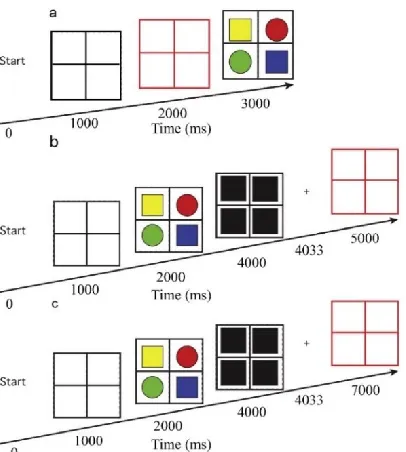
[image:9.612.75.278.128.354.2]Each trial consisted of a sequence of stimuli presented on a black background (see Figure 1). They consisted of a color cue, which was a square frame (Height x Width; 13° x 13°) divided by a vertical and horizontal line in one of four colors (blue, green, red, yellow), a target stimulus consisting of the same square frame in white, with targets appearing in every quadrant of the frame, a fixation cross, and a start frame consisting of the color cue frame in white with a thicker fixation cross. The center of the color cue frame, the target frame and the fixation cross were presented at a to-be fixated fixation point. The four targets in the target stimulus consisted of two squares and two circles (2.5° x 2.5°) that were colored (blue, green, red, yellow), and the center of each target was located 3° from the horizontal and 3° from the vertical midline. Each type of target (left to right: circle square at the top, square circle at the bottom, or exactly opposite) was always presented only once on each side of the frame (see Figure 1). The location and color of the targets varied
pseudo-randomly as shapes had two options (left to right: circle square top, square circle bottom or the other way around) and each target was always one of four colors, whereby no target was colored the same as any other figure in that target stimulus.
There were three different Cue Conditions used, all of which were presented to each participant and the order of presenting was counterbalanced between participants. All conditions started with a short instruction and description of the task before the actual experiment started.
Each trial started with a ‘start’ message in white on a black background for 1000 milliseconds,
followed by a white frame with a fixation cross for 1000 milliseconds. In the pre-cue condition this was followed by the frame changing into one of the four colors for another 1000 milliseconds, after which the four stimuli display was shown with a white frame again. This display stayed on the screen until a response was made. In the two post-cue conditions the four stimuli display was first shown for 2000 milliseconds after which a white frame with white masks at the location of the four stimuli was presented for 33 milliseconds. In the short post-cue condition 967 milliseconds of fixation followed, after which the colored frame was presented until a response was made. In the long post-cue condition this fixation was shown for 2967 milliseconds instead and was also followed by a colored frame until a response was made. Each condition consisted of 32 practice trials and 192 experimental trials for a total of 672 trials. After the practice trials, between conditions, and at the halfway point of each condition there was the possibility for a short break if needed. All experimental trials in a single condition were unique as 4!(stimulus color possibilities) x 4(frame color) x 2(left top/right bottom square, right top/left bottom circle, or left top/right bottom circle, right top/left bottom square) is 24x4x2=192 trials.
In each trial participants had to react as fast and accurately as possible by indicating what stimulus form (square or circle) was cued by the color cue. (For example, if a blue square was presented top left and the colored frame was blue, a button press had to be made indicating it was a square). To prevent effects of differences in visual input because of shape, half the participants had to press the left control for a square and right control for a circle, and the other half had to press the left control for a circle and right control for a square counterbalancing this variable. The trial finished after a response was given, and erroneous responses evoked a short textual feedback
Apparatus and data recording
All participants were first seated in an armchair in front of a HP EliteBook laptop to do the color blindness test, to ensure none of the participants were color blind. For the EEG test participants were seated 60 cm from a 22-inch full HD LED monitor (60 Hz refresh, 1920x1080 pixels). Stimuli were presented using a Desktop PC (Windows Lean mode) using Presentation software (Neurobehavioral Systems, Inc. Version 20.2) and the room was darkened during testing. A mechanical QWERTY keyboard was used to register responses at a refresh rate of 1000 Hz. Reaction times (RT) were measured using event markers that were registered together with the electroencephalogram (EEG), the Electrooculogram (EOG) and other relevant markers using Brainvision Recorder software version 1.22 (BrainVision Analyzer, Brain Products GmbH, Gilching, Germany).
The EEG was recorded using 32 active electrodes attached to an electrode cap (actiCAP, Brain Products Gmbh, Gilching, Germany) in accordance with the extended 10/20 system at locations AFz, F3, F4, F7, F8, Fz, FC5, FC6, T7, T8, C3, C4, Cz, CP5, CP6, P1, P2, P3, P4, P5, P6, P7, P8, Pz, POz, PO3, PO4, PO7, PO8 O1, O2 and Oz. Vertical EOG was recorded using electrodes placed below and above the left eye, whereas horizontal EOG was recorded using electrodes placed at the outer canthi of both eyes. EEG and EOG signals were amplified with an actiCHamp amplifier (actiCHamp Plus, Brain Products GmbH, Gilching, Germany) (72 channels, DC), using position T8 as reference electrode. The impedance was kept below 10 kΩ. Both EEG and EOG were recorded at a sampling rate of 500 Hz.
Behavioral measures
Trials with detectable eye movements (criteria: +/- 12 μV from 0 to 700 ms relative to onset of the color cue in both the post-cue conditions, and relative to the target stimulus display in the pre-cue condition. Criterion based on visual checking for eye movements in the EEG data. +/- 12
x3(pre-cue/short post-cue/long post-cue) x2(up/down)) was used to analyze these results, using a Greenhouse-Geisser εcorrection only when Mauchly’s test of sphericity was significant. This was the case for the ‘Cue Condition’ variable and all interaction effects that included the ‘Cue Condition’ variable for both the reaction time and percentage correct analysis. Separate one tailed paired-sample t-tests was used to further analyze correspondence effects for each condition,
averaging over the Horizon variable. Effect sizes were measured using Cohen’s d.Cohen’s d is an
effect size measure showing how strong an effect is. It is calculated by dividing the difference
between the means by the pooled standard deviation. A Cohen’s d of 0.20 is considered small, 0.50
is a medium effect, 0.80 is considered a large effect and above 1.2 is considered a very large effect size (Cohen, 1988; Sawilowsky, 2009).
EEG measures
The EEG was analyzed with Brain Vision Analyzer 2.1 (Brain Products GmbH, 2019). First the data was partitioned in intervals relative to the markers that signaled the relevant stimulus in each condition. In all three conditions these intervals were from -1500 to 1500 ms coinciding with the onset of the target stimuli in the pre-cue and the color cue stimuli in the two post cue conditions. After a baseline correction from -100 to 0 ms trials with detectable horizontal eye movements and EEG channels with large artifacts (gradient criterion: 50 μV/ms, min-max: 250μV, low activity: 0.5 μV for 100 ms, all between -200 and 200 ms of the event.) were removed using individual channel mode. This was followed by an independent component analysis (ICA) to correct the EEG signal for eye movement-related artifacts. On average 2 to 3 components were excluded due to not representing EEG data or showing strong and obvious artifacts. Then another baseline correction of -100 to 0 was applied, followed by a stricter artifact rejection (gradient criterion: 50 μV/ms, min-max: 150μV, low activity: 0.5 μV for 100 ms, all between -200 and 200 ms of the event.). After that the analyses were performed.
frequency bands were then specified for the experiment: α1 (7.2-10.7 Hz, Gaussian lower and upper band respectively), α2 (9.4-14 Hz) defined as the lower and higher alpha band respectively. The individual averages of these estimates were then computed for all cue conditions, per side (left/right). Next the normalized lateralized indices [ipsilateral – contralateral] / [ipsilateral + contralateral] were calculated for both alpha bands (band 4 and 5) for both relevant sides. These power indices were computed using all symmetrical electrode pairs, after which an average was calculated using the left and right data by adding their activity up and dividing the total by 2. Then the inverse channels were added by hand to make a complete topographical map. This was done by taking -1 * the calculated power indices per electrode and using this calculation for the opposite electrode. For example, if O2 was calculated like shown above, O1=-1*O2 power. This together constructed the LPS (see Van der Lubbe & Utzerath, 2013). These LPS values vary from 1 to -1, whereby a positive sign indicated that the power within a specific frequency band is larger in the ipsilateral hemisphere than in the contralateral hemisphere, whereas a negative sign indicates the opposite pattern. The obtained estimates were then evaluated per frequency band using 10 intervals of 40ms between 200ms and 600ms after the relevant stimulus.
Then t-tests were done for the time windows in which the earlier research (Van der Lubbe et al., 2014) found effects for the alpha wave bands, again calculating Cohen’s d of the effect size. This was done in the pre-cue condition between 320ms and 480ms and in both post-cue conditions between 480ms and 560ms. To see if the found effects from their research were replicable for the pre- and short cue conditions and if the same effect would persist between short and long post-cue condition these time windows were selected. As the analysis was used for replication of earlier found effects in the pre-cue and short post-cue conditions one-tailed p<0.05 criteria were used as significance level for testing all data for both the behavioral and EEG data.
Results
Behavioral measures
Mean reaction times (RT) and proportion correct responses (PC) are shown in Table 1. Analyses on RTs (repeated measures ANOVA) with factors Cue Condition, Correspondence and Position revealed that RTs were faster for corresponding than for non-corresponding trials (664 vs. 685 ms;
F(1,14) =7.45, p=0.016, ηp2 =0.35). An effect of Cue Condition was also observed (F(1.8,28)=5.94,
[SE: 29]), slightly faster responses in the pre-cue Condition (694 ms [23]), and fastest responses in the short post-cue Condition (631 ms [25]) The difference between the pre-cue and long post-cue Condition was not significant (F(1,14)=0.03, p=0.86, ηp2<0.01), but responses were always slower in the pre-cue Condition than in the short post-cue Condition (F(1,14)=8.71, p=0.011, ηp2=0.38). It was also observed that reaction times in trials presented in the higher visual field and the lower visual field might differ from each other, as this effect reached an almost significant value (F(1,14)=3.65, p=0.08) This effect was however small (ηp2=0.21). An interaction effect was observed between Correspondence and Cue Condition (F(1.6,22.9) =4.13, p=0.036, ε=0.82,
ηp2=0.23). But no interaction effects were found between Correspondence and Position (F(1,14) =1.17, p=0.30, ηp2=0.08) and between Cue Condition and Position (F(2,28) =0.28, p=0.74, ε=0.92,
ηp2=0.02). Separate one tailed paired sample t-tests revealed that when averaging across the Position variable, the Correspondence effect was found for the pre-cue Condition (t(16)=-4.39,
[image:14.612.72.507.476.633.2]p<0.001,Cohen’s d=1.06) but not for the short post-cue Condition (t(16)=-1.04, p=0.16, d=0.25) or long post-cue condition (t(14)=-1.00, p=0.17, d=0.26). Both the short post-cue condition and the long post-condition did however show a 95% confidence interval showing greater overlap with the expected side than the non-expected side based on earlier studies (95% confidence interval between -24.1 and 8,2 and between -36.4 and 13.3 respectively).
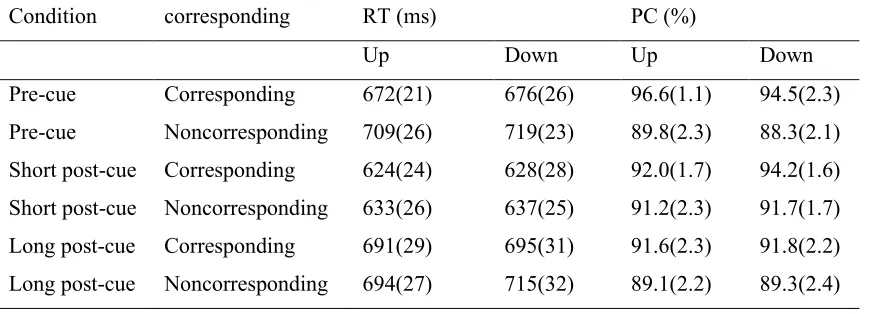
Table 1 mean RTs and PCs as function of cue condition, position and correspondence with standard deviation between brackets
Condition corresponding RT (ms) PC (%)
Up Down Up Down
Pre-cue Corresponding 672(21) 676(26) 96.6(1.1) 94.5(2.3)
Pre-cue Noncorresponding 709(26) 719(23) 89.8(2.3) 88.3(2.1)
Short post-cue Corresponding 624(24) 628(28) 92.0(1.7) 94.2(1.6)
Short post-cue Noncorresponding 633(26) 637(25) 91.2(2.3) 91.7(1.7)
Long post-cue Corresponding 691(29) 695(31) 91.6(2.3) 91.8(2.2)
Analyses on PCs with the factors Cue Condition, Correspondence and Position revealed that more correct responses were made on corresponding than on non-corresponding trials (93.5% [SE: 1.48] vs 89.9% [1.77], F(1,14) =22.17, p=0.000, ηp2=0.61). The effect of Cue Condition was not significant (F(1.9,26.0) =1.7, p=0.20, ε=0.93, ηp2=0.11) and Position was also not significant (F(1,14) <0.02, p=0.91, ηp2<0.01). Separate one-tailed paired sample t-tests revealed that when averaging across the Position variable, the Correspondence effect was present for the pre-cue Condition (t(16)=5.68, p=0.000, d=1.38) but no Correspondence effect was found in the short post-cue Condition (t(16)=1.49, p=0.155, d=0.36) or the long post-cue condition (t(14)=1.52, p=0.15,
[image:15.612.74.579.343.410.2]d=0.39). Yet again the 95% confidence interval of difference shows that in both the short post-cue and the long post-cue condition corresponding trials seemed to be correct more often that non-corresponding trials (95% confidence interval of difference from -0.6 to 3.6 and from -1.0 to 6.0 respectively).
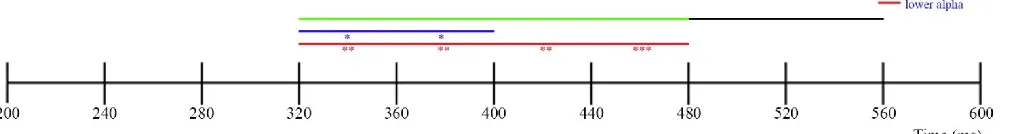
Figure 2 Timeline for significant time windows. the top line shows the expected significant time windows
EEG data
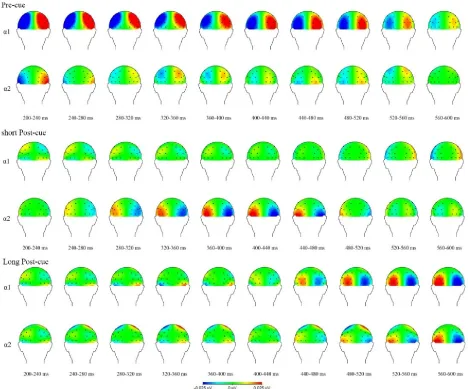
An overview of all significant time windows and electrode pairs is shown in Figure 2, with the corresponding statistical values in Table 2. Separate analyses using one tailed one-sample t-tests for the two different frequency bands (the lower and higher α band) in the pre-cue condition revealed that there was a significant deviation from zero in the lower α band (7.2-10.7 Hz) for all tested time windows, with multiple electrode pairs picking up part of this signal. For an overview see Table 2. This effect reflected increased ipsilateral as compared to contralateral power (See Figure 3). There was also a small significant deviation from zero in the higher α band (9.4-14.0 Hz), but this was only for part of the tested time windows and only 1 electrode pair. In the short post-cue condition, no significant deviation from zero was found in either the lower α or the higher α band for the time windows 480-520 ms and 520-560 ms (for all 3 electrode pairs (P7/P8, PO3/PO4, PO7/PO8) and both time windows in all cases). In the long post-cue condition, no
[image:16.612.72.568.469.599.2]significant deviation from zero was found in either low α or high α band for the time windows 480 -520 ms and -520-560 ms (for all 3 electrode pairs (P7/P8, PO3/PO4, PO7/PO8) and both time windows.
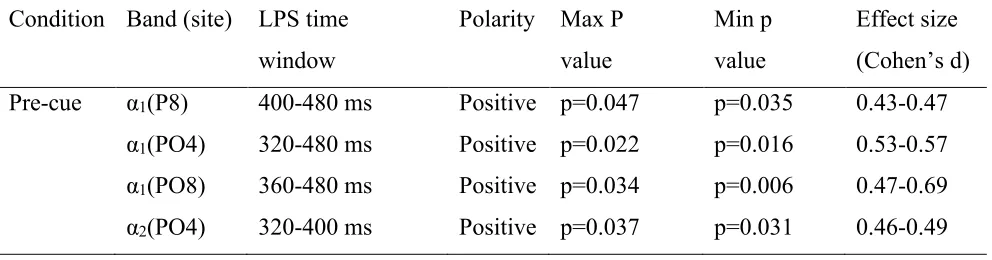
Table 2 LPS results for both alpha frequency bands. LPS = lateralized power spectra. Positive = ipsilateral > contralateral power. Minimum and maximum p value per frequency band and
electrode pair are shown, with their corresponding range of effect size values (Cohen’s d).
Condition Band (site) LPS time window
Polarity Max P value
Min p value
Effect size
(Cohen’s d)
Pre-cue α1(P8) 400-480 ms Positive p=0.047 p=0.035 0.43-0.47
α1(PO4) 320-480 ms Positive p=0.022 p=0.016 0.53-0.57
α1(PO8) 360-480 ms Positive p=0.034 p=0.006 0.47-0.69
Discussion
[image:17.612.72.540.70.459.2]specifically: the study used a new method introduced by Van der Lubbe and Utzerath (2013), called the lateralized power spectra (LPS), to compare internal spatial attention representations at different time intervals, combined with a behavioral measure in the form of the Simon effect for both time intervals. Furthermore, part of an earlier study done by Van der Lubbe et al., (2014) was replicated to test if earlier observed effects can be replicated again using the LPS method and Simon effect. The used LPS method reveals both stimulus-evoked and internally induced effects.
Concerning the robustness of internal spatial attention representations over longer time intervals, behavioral data for both the short post-cue and the long post-cue condition did not find a correspondence effect in either the reaction times or the percentage correct. For both the short post-cue and the long post-post-cue condition however, the effect seemed to be in the right direction according to the 95% confidence intervals and both effect sizes were small but not trivial. The LPS
analyses for both α bands did not deviate in power between the ipsilateral and contralateral side in
the expected direction for the chosen time windows (between 480-560 ms).
Based on the visual representation of the data however (see Figure 3), both the short and the long cue condition seem to show deviations in lateralized alpha power. For the short post-cue condition the time window was shifted with regards to the expected time, and in both the short and long post-cue condition the alpha power seemed to be in the other direction than was expected based on the earlier study done by Van der Lubbe et al. (2014). When comparing the two post-cue conditions it seems that the short post-cue condition might have an earlier deviation in lateralized
α power than the long post-cue condition, and that there seems to be a difference in contribution of
each α band (lower and higher). The short post-cue condition only seems to show effects in the
higher α band, whereas the long post-cue condition seems to show stronger effects for the lower α band than the higher α band, while showing deviations in both frequency bands. It also seems that
There is evidence that earlier suggested interpretations of found effects might deviate from what is happening. According to recent studies (Foster, Sutterer, Serences, Vogel & Ash, 2015; Vissers, Driel & Slagter, 2016; Poch, Valdivia, Capilla, Hinojosa & Campo, 2018) alpha power is not related to inhibitory processes in the form of reactive (post-cue/retro cue) filtering of information. According to Foster, Sutterer, Serences, Vogel and Awh (2015) alpha activity is related to sensory coding of spatial representations. In line with this, Poch et al. (2018) found that alpha activity was lateralized with respect to the locus of attention, but not with tracking post-cue irrelevant load. That is why they propose that retro-cue induced alpha lateralization might not play a role in inhibition of irrelevant information in working memory but reflects a general orientation attentional process. This means that earlier interpretations regarding lateralized alpha power differ from what is found by Poch et al. (2018). Although the likeliness of this changing the direction of the effect is relatively small as similar effects as the previous study have been found before (Van der Lubbe & Utzerath, 2013), even without distractors. These findings further suggest that at least part of the interpretations regarding the function of lateralized alpha power made in the previous study could be incorrect, making the conclusions drawn by them less robust. This is further evidence that there might be small differences in the mechanisms underlying internal spatial attention representations over time.
Concerning the replication, the behavioral results in the pre-cue condition showed a clear Simon effect for both reaction times and percentage correct. Responses were on average faster and more accurate when the stimulus and the response side corresponded with each other than when the stimulus side and response side did not correspond. The LPS analyses also revealed an effect in both the lower α band (320-480 ms), and the higher α band (320-400 ms) with posterior increased ipsilateral vs. contralateral power. Increased ipsilateral and/or decreased contralateral alpha activity is commonly interpreted as active inhibition of distracting information (Van der Lubbe & Utzerath, 2013; Janssens et al., 2016; Van der Lubbe et al., 2014; Jensen and Mazaheri., 2010) when it is about proactive filtering of information (pre-cue conditions).
post-cue condition. visual representations of the data show effects of spatial attention in the alpha bands, but again these did not correspond with earlier results. This suggests that there seems to be a partial overlap between internal and external spatial attention in the current study. According to the stimulus evoked and the internally induced EEG activity, it might be that earlier found effects are not as robust and timebound as the previous study seems to indicate.
It seems odd that the current study did not find the same strong effects that previous studies found. This might be because of a shortcoming of statistical testing in general. In statistical testing there is always a small chance that effects that are present in the data are still not supported by the statistical analysis. This might be the case for the current study, explaining why no effects were found even though there is strong support there is an overlap between internal and external spatial attention.
One of the shortcomings of this research is that, for the most part, it strictly replicates results found by an earlier study, while only looking at a part of the frequency bands. Follow-up research should also consider the theta bands as these may increase our understanding of the underlying mechanisms of internal and external spatial attention. It may also be interesting for future studies to consider other statistical methods, such as Bayesian statistics, as these may inform us about optimal behavior across trials. Moreover, this study made use of only the LPS method for the EEG analysis to see if found results using this new method could be replicated. There are some shortcomings to the use of only one method. Because of this, the LPS method by itself is not to the full extent testing the current questions. To solve most of these problems future research could examine more frequency bands than just the lateralized alpha power when using the LPS method.
Using ERP’s or other methods next to the LPS method to strengthen found results could also greatly improve the robustness of the results. Making use of bigger time windows for exploration purposes, and using more robust statistical analysis, e.g. Bayesian statistics could help to further answer how robust internal spatial attention representations are over time in the brain. These adjustments might also help to further understand the overlap between internal and external spatial attentional processes, and their underlying mechanisms.
Conclusion
References
BrainVision Analyzer (Version 1.22.0) [Computer software]. (2019). Gilching, Germany:
Brain Products GmbH
Chen, K., Ye, Y., Xie, J., Xia, T., & Mo, L. (2017). Working memory operates over the same
representations as attention. PLOS ONE, 12(6), e0179382.
doi:10.1371/journal.pone.0179382
Chun, M. M., Golomb, J. D., & Turk-Browne, N. B. (2011). A taxonomy of external and
internal attention. Annual Review of Psychology, 62(1), 73-101.
doi:10.1146/annurev.psych.093008.100427
Cohen, J. (1988). Statistical Power Analysis for the Behavioral Sciences. London, England:
Routledge.
Corbetta, M., Kincade, J. M., & Shulman, G. L. (2002). Neural systems for visual orienting
and their telationships to spatial working memory. Journal of Cognitive Neuroscience,
14(3), 508-523. doi:10.1162/089892902317362029
Corbetta, M., & Shulman, G. L. (2002). Control of goal-directed and stimulus-driven
attention in the brain. Nature Reviews Neuroscience, 3(3), 201-215.
doi:10.1038/nrn755
Downing, P. E. (2000). Interactions between visual working memory and selective attention.
Psychological Science, 11(6), 467-473. doi:10.1111/1467-9280.00290
Enchroma color blind test. (n.d.)/ Retrieved from https://enchroma.com/pages/test
Foerster, R. M., & Schneider, W. X. (2018). Involuntary top-down control by
search-irrelevant features: Visual working memory biases attention in an object-based
Foster, J. J., Sutterer, D. W., Serences, J. T., Vogel, E. K., & Awh, E. (2015). The topography
of alpha-band activity tracks the content of spatial working memory. Journal of
Neurophysiology, 115(1), 168-177. doi:10.1152/jn.00860.2015
Griffin, I. C., & Nobre, A. C. (2003). Orienting attention to locations in internal
representations. Journal of Cognitive Neuroscience, 15(8), 1176-1194.
doi:10.1162/089892903322598139
Hollingworth, A. (2012). Task specificity and the influence of memory on visual search:
Comment on Võ and Wolfe (2012). Journal of Experimental Psychology: Human
Perception and Performance, 38(6), 1596-1603. doi:10.1037/a0030237
Hommel, B. (2002). Responding to object files: Automatic integration of spatial information
revealed by stimulus-response compatibility effects. The Quarterly Journal of
Experimental Psychology Section A, 55(2), 567-580.
doi:10.1080/02724980143000361
Janssens, C., De Loof, E., Boehler, C. N., Pourtois, G., & Verguts, T. (2017). Occipital alpha
power reveals fast attentional inhibition of incongruent distractors. Psychophysiology,
55(3), e13011. doi:10.1111/psyp.13011
Jensen, O., & Mazaheri, A. (2010). Shaping functional architecture by oscillatory alpha
activity: Gating by inhibition. Frontiers in Human Neuroscience, 4.
doi:10.3389/fnhum.2010.00186
Kuo, B., Rao, A., Lepsien, J., & Nobre, A. C. (2009). Searching for targets within the spatial
layout of visual short-term memory. Journal of Neuroscience, 29(25), 8032-8038.
Lilienfeld, S. O. (2017). Psychology’s replication crisis and the grant culture: Righting the
ship. Perspectives on psychological science, 12(4), 660-664.
Doi:10.1177/1745691616687745
Neurobehavioral systems inc (version 20.2) [Computer software]. Retrieved from
https://www.neurobs.com/menu_presentation/menu_download/current
Nobre, A. C., Coull, J. T., Maquet, P., Frith, C. D., Vandenberghe, R., & Mesulam, M. M.
(2004). Orienting attention to locations in perceptual versus mental representations.
Journal of Cognitive Neuroscience, 16(3), 363-373.
doi:10.1162/089892904322926700
Olivers, C. N., Meijer, F., & Theeuwes, J. (2006). Feature-based memory-driven attentional
capture: Visual working memory content affects visual attention. Journal of
Experimental Psychology: Human Perception and Performance, 32(5), 1243-1265.
doi:10.1037/0096-1523.32.5.1243
Poch, C., Valdivia, M., Capilla, A., Hinojosa, J. A., & Campo, P. (2018). Suppression of
no-longer relevant information in working memory: An alpha-power related mechanism?
Biological Psychology, 135, 112-116. doi:10.1016/j.biopsycho.2018.03.009
Sawilowsky, S. (2009). New effect size rules of thumb. Journal of modern applied statistical
methods, 8(2), 597-599. Doi:10.22237/jmasm/1257035100
Sauseng, P., Klimesch, W., Heise, K. F., Gruber, W. R., Holz, E., Karim, A. A.,
Hummel, F. C. (2009). Brain oscillatory substrates of visual short-term memory
capacity. Current Biology, 19(21), 1846-1852. doi:10.1016/j.cub.2009.08.062
Simon, J. R. (1969). Reactions toward the source of stimulation. Journal of Experimental
Tanoue, R. T., Jones, K. T., Peterson, D. J., & Berryhill, M. E. (2013). Differential frontal
involvement in shifts of internal and perceptual attention. Brain Stimulation, 6(4),
675-682. doi:10.1016/j.brs.2012.11.003
Van der Lubbe, R. H., Bundt, C., & Abrahamse, E. L. (2014). Internal and external spatial
attention examined with lateralized EEG power spectra. Brain Research, 1583,
179-192. doi:10.1016/j.brainres.2014.08.007
Van der Lubbe, R., & Utzerath, C. (2013). Lateralized power spectra of the EEG as an index
of visuospatial attention. Advances in Cognitive Psychology, 9(4), 184-201.
doi:10.5709/acp-0144-7
Vissers, M. E., Van Driel, J., & Slagter, H. A. (2016). Proactive, but not reactive, distractor
filtering relies on local modulation of alpha oscillatory activity. Journal of Cognitive