Why your back hurts
-
Finding an efficient way to measure and evaluate sitting
posture using a combination of body sensors placed on the
body and machine learning
Gijs van Rhijn S1721690 Bachelor assignment Creative Technology University of Twente
July 2019
3
Abstract
The goal of this paper is to test the effectiveness of various wearable sensors, wearable sensor positions, and machine learning for measuring posture quality. Various different seating postures were identified. These where divided into correct and incorrect postures. Measurements of people taking on these different postures where done using a sensor suit containing various stretch sensors, gyroscopes, and accelerometers in different positions. The data gathered during these measuring sessions was used
to train the random forest machine learning algorithm. The variable importance measures of the random forest algorithm where used to identify the most important sensors and sensor positions. Using about 300 lines of data, the random forest algorithm can be trained to have an average accuracy
of about 92 per cent. Adding random rotations to the sitting position (to simulate a real office setting) decreases said accuracy to 84 per cent. The variable importance estimations placed high importance on
5
Acknowledgements
I would like to thank my two supervisors, Angelika Mader and Gwenn Englebienne. Their willingness to have weekly progress meetings, despite their busy schedule, helped me stay focused the past few months. Their advice helped me solve the many problems I encountered while working on my thesis
I would also like to thank my friends and acquaintances for helping me out during the various measuring sessions. They were always willing to take some time out of their day to help me gather the
7
Table of Contents
Abstract ... 3
Acknowledgements ... 5
Table of Contents ... 7
1 Introduction ... 10
1.1 Context ... 10
1.2 Goal of report ... 10
1.3 Research questions ... 10
1.4 Setup of report ... 11
2 State of the art ... 12
2.1 Correct and incorrect posture ... 12
2.1.1 Interview with physio therapist ... 12
2.1.2 Interview with orthopaedic surgeon ... 13
2.1.3 Further studies ... 15
2.1.4 Summary and overview incorrect postures ... 15
2.2 Machine Learning ... 16
2.2.1 Literature research: Machine learning techniques suitable for posture identification ... 17
2.2.2 Literature research: Variable importance ... 18
2.2.3 Literature research: Conclusion ... 18
2.2.4 Random Forests ... 19
2.3 Similar products ... 21
2.4 Conclusion ... 21
3 Ideation ... 22
3.1 Sensors ... 22
3.1.1 Sensors for each type of bad posture ... 22
3.1.2 xSens ... 25
3.1.3 Types of sensors that will be used ... 26
4 Specification ... 28
4.1 Sensors ... 28
4.1.1 Sensor modules that will be used ... 28
4.2 Suit ... 28
4.2.1 First version sensor suit (used in session one and two) ... 28
4.2.2 Second version sensor suit (used in session three) ... 29
4.2.3 Third version sensor suit (used in session four) ... 29
4.3 Machine learning ... 30
8
4.3.2 Machine learning software ... 30
4.4 measurement design ... 30
4.5 Consent form and ethical approval ... 30
5 Realisation. ... 31
5.1 Pilot measuring session. ... 31
5.1.1 Result from the pilot measuring session. ... 31
5.1.2 Improvements made based on the pilot measuring session. ... 31
5.2 First measuring session. ... 31
5.2.1 Improvements based on the first measuring session. ... 32
5.3 Second measuring session. ... 32
5.3.1 Improvements based on the second measuring session. ... 32
5.4 Third measuring session. ... 32
5.4.1 results from the third measuring session. ... 32
5.4.2 improvements based on the third measuring session. ... 33
5.5 Fourth measuring session. ... 33
5.5.1 results from the second measuring session. ... 34
6 Data Analysis ... 35
6.1 Data analysis session one ... 35
6.1.1 Training the random forest model using unprocessed data ... 35
6.1.2 Training the random forest model using data relative to the correct posture ... 36
6.1.3 Analysing variable importance. ... 37
6.2 Data Analysis session two ... 38
6.2.1 Training the random forest model using data relative to the correct posture. ... 38
6.2.2 Analysing variable importance ... 39
6.3 Data Analysis session three ... 40
6.3.1 Training the random forest model using unprocessed data ... 40
6.3.2 Training the random forest model using data relative to correct posture ... 40
6.3.3 Training the random forest model using data relative to the upper back sensor. ... 41
6.3.4 Analysing variable importance ... 42
6.3.5 Simplifying the machine learning model... 43
6.4 Data analysis session four. ... 45
6.4.1 Training the random forest model using unprocessed data. ... 45
6.4.2 Training the random forest model using data relative to the correct posture. ... 45
6.4.3 Analysing variable importance. ... 46
6.4.3 Simplifying the machine learning model... 46
9
7.1 Discussing the results. ... 50
7.1.1 Effects of processing the data. ... 50
7.1.2 Simplifying the sensor suit. ... 50
7.2 Recommendation for further research. ... 51
7.3 Conclusion. ... 52
8 References ... 54
9 Appendix ... 57
Appendix A, python machine learning code. ... 57
Appendix B, Arduino code sensor suit. ... 59
Appendix B-I, first version of the Arduino code. ... 59
Appendix B-II, second version of the Arduino code. ... 67
Appendix B-III, third version of the Arduino code. ... 74
Appendix C, checklist ethical approval ... 82
Appendix D, consent form ... 86
Appendix E, information sheet ... 88
Appendix F, picture of the real sensor suit ... 92
10
1 Introduction
1.1
Context
Many people in the western world are living a sedentary lifestyle [1]–[6]. According to Spittaels et al. [3], people in Belgium spend 55% of their waking time in sedentary behaviour. Spending significant time sitting is associated with back problems [7].A person’s posture while sitting can influence the back problems they have a tendency to experience. Specifically lower back pain is common [8]. Improving one’s posture can have significant effect on the back problems they experience, both now and in the future.
Nowadays, people seem to becoming more and more aware of their health and the
consequences the modern sedentary lifestyle has on their bodies. Health focused smart wearables are becoming more popular each day. These wearables give people access to their activity levels, sleep schedules, heartrate, and more. Posture is a common cause of concern amongst people. Many people have trouble keeping an upright posture during the day. This creates problems like low back pain and neck pain. Posture is also something that can be important for people with specific skeletal deformities or particularly weak backs. For these people keeping track of their posture can be even more important to their wellbeing. To help people keep track of their posture, a wearable measuring device would be welcome. Such a device could give people real time feedback on their posture, but it could also be used by medical professionals to do research about the effect of faulty postures.
Precise posture measurement tends to be a difficult thing to do due to the myriad of ways in which a posture can be incorrect. Machine learning (ML) is a promising tool to solve problems that are as complicated as posture measurement. ML techniques can find patterns in complicated, highly dimensional, data. This might give machine learning an advantage over more traditional programming techniques. Machine learning has one big strength in detecting variable importance. Historically, determining the importance of a specific variable has been quite complicated. The ability of ML techniques to create order in a complicated data set, allows for new possibilities in determining variable importance. Often these techniques are seemingly more accurate that more traditional
techniques. Detecting variable importance can be helpful when trying to minimize the complexity of a posture sensing device, hopefully allowing the cost and complexity of the device to be reduced.
1.2
Goal of report
This GP is about the effectiveness of using machine learning and different wearable sensors to measure sitting posture. The idea is that this could help people keep track of, and improve, their posture. The goal of this paper is to identify suitable machine learning techniques to help identify sitting posture and to help identify what sensors and sensor placement are important.
One or more promising machine learning techniques will be identified, together with various types of wearable sensors the effectiveness at posture measurement will be tested. The importance of individual sensors and sensor placement can be tested using the build in variable important measures of the machine learning techniques. Then the effectiveness of the machine learning techniques without these sensors can be tested in an attempt de declutter the system.
1.3
Research questions
The main research question of this report is as follows:
- How to efficiently measure and evaluate sitting posture using a combination of sensors placed on the body and machine learning?
The sub questions are:
- What constitutes good and bad posture?
- What types of sensors can be used to measure posture problems?
11
- How many sensors are needed, and where on the body do they need to be placed to get reliable and accurate posture measurements?
- How effective is the chosen machine learning algorithm at achieving the goal of measuring posture?
1.4
Setup of report
This report will start with an overview of the theoretical background necessary to design and execute a proper test into posture measurement. This information can be found in chapter 2, “state of the art”. This chapter will explore what makes a sitting posture good or bad, and identify different kinds of bad and good posture. It will also create an overview of different machine learning techniques that might be useful for posture identification. Lastly, it will take a look at commercial posture sensors that are available already and it will explore the advantages and disadvantages of these devices.
in chapter 3, “ideation”, different types of sensors will be discussed and a final list of useful sensors will be constructed. This list is then translated to real life sensor modules in chapter 4, “specification”. The specification chapter also describes the design of the sensor suit and what machine learning software will be used. Lastly, chapter 4 will detail the way the actual tests were executed.
Chapter 5, “realisation”, serves to give the reader a quick overview of the different measuring sessions that have been done and their results. For a more detailed analysis of the data gathered during each testing cycle, see chapter 6, “data analysis”. Chapter 7, “discussion”, acts as a concluding
chapter. In this chapter the most important results from the various tests will be discussed,
12
2 State of the art
2.1 Correct and incorrect posture
Before a posture measuring device can be designed and tested, it is important to know what defines a posture to be good or bad. The exact consequences of different seating postures do not seem to be understood perfectly. Some researches view the connection between posture and back problems as a largely empirical one [9]. Still, research regarding the biomechanics of the human body date back hundreds of years [10]. In an attempt to create an overview of the knowledge available, Empirical and biomechanical knowledge will be combined with data from cross-sectional studies.
Many healthcare professionals have years of experience with treating back and neck problems. This experience can serve as a basis for a proper understanding of postures. According to an interview with a physiotherapist described by Visser [11], posture quality is largely dependent on the position of the pelvis (Figure 1).
2.1.1 Interview with physio therapist
[image:12.595.121.207.377.548.2]To obtain a correct posture, the pelvis needs to be rotated forwards. This allows for the lumbar to develop a Lordosis. The lumbar lordosis results in a kyphosis in the thoracic part of the spine. Finally, the cervical part of the spine will have a lordosis again, this allows for the head to be positioned correctly on top of the spine. This allows the head to balance nicely on top of the spine and for the scapulae to be positioned straight on the back. This shape of the spine allows it to act like a spring, giving it the ability to correctly handle the pressures placed on it.
Figure 1, Cervical, Thoracic and Lumbar part of the spine [11]
Figure 2, correct scapulae posture (A), incorrect scapulae posture (B) [11]
[image:12.595.115.255.591.682.2]13
forwards. This shape of the spine ultimately pushes the head forwards, forcing the chin to rotate upwards to allow the head to look straight.
2.1.2 Interview with orthopaedic surgeon
To expand upon the knowledge acquired by Visser [11], an interview with an orthopaedic surgeon was done. This interview focused on expanding on the information described by Visser. It gives a greater insight into de details of correct and incorrect posture.
[image:13.595.88.386.343.638.2]A correct posture focusses on efficient use of the muscles required to maintain said posture while preventing unnecessary stress on the vertebrae and joints. A posture can be described from three different perspectives: the coronal plane, the sagittal plane, and the transverse plane (Figure 3Error! Reference source not found.). Visser gave an overview of the correct and incorrect posture in the sagittal plane. The straightening of the spine allows the back muscles to efficiently keep the body upright. The natural curve of the spine helps balance the centre of gravity above the pelvis. A slouched forward posture, with the pelvis tilted backwards, puts stress on the vertebrae and joints to keep the body balanced instead of using the muscles. This effect is also described by Corlett and Eklund in their paper how does a backrest work [12]. When sitting straight int the sagittal plane it is important to keep one’s head straight above their shoulders and pelvis, as to not put any unnecessary pressure on it.
Figure 3, the coronal, sagittal and transverse plane. [13]
14
[image:14.595.71.335.104.317.2]rotated. This rotation is also important for the spine. The spine vertebrae should not be angles in relation to each other.
Figure 4, postures in sagittal plane, the leftmost posture is correct. [14]
Figure 5, postures int he coronal plane. [15]
Unnecessary pressure in the body due to improper posture can result in pain. A completely static posture tends to have a negative effect on the body as well as it can put continuous strain on certain parts of the body. One technique that is meant to result in a more dynamic posture is to sit on a chair or stool that is not completely stable. This forces the body to balance itself, creating a more dynamic posture.
[image:14.595.70.420.346.566.2]15
The muscles responsible for keeping the correct posture can be divided into the extrinsic (large) muscles and intrinsic (small) muscles. The extrinsic muscles are responsible for the general shape of the body. The muscles in the back of the body determine position of the pelvis and the shape of the spine. The abdominal muscles can tense to form a ‘hard balloon’ like structure. This helps balance the back. The intrinsic muscles are responsible for the position of the vertebrae relative to each other. They prevent them from shifting or rotating away from each other. Extrinsic muscles are relatively easy to train and measure, while the intrinsic muscles are so small that it becomes very hard to accurately measure and train them.
As mentioned before, the goal of a correct posture is to minimize the amount of problems people experience in their back and neck. Human are unique amongst vertebrates in that they walk on two legs. To facilitate standing and walking upright, humans have the ‘hollow’ lordosis curve in the lumbar part of their spine. Still, the general structure of the spine is not very well suited to an upright posture. Because of this, back and neck pains in humans are common. Nearly everyone will
experience them in their life. Back problems can be acute, but they can also be chronic. Chronis back problems tend to be extremely hard to cure. It is possible for chronic back problems to exist without any direct biological cause, this is called chronic pain syndrome.
Not everybody is the same, this is also true for one’s skeleton. Every person will have a slightly different ‘correct’ posture. Some people have deformed spines. This can be the results of different causes. The deformity can be congenital, but it can also be caused by a growth disturbance later in life. Spinal deformities can also be the result of a traumatic experience. When such a person’s posture is measured the standard rules for good and bad posture cannot be applied. It might be impossible for these people to attain correct posture. Because of this, their posture measurements have to be adapted to their body. The correct posture for people with a non-normal back has to be determined by a medical professional, as this can be quite an intricate task.
2.1.3 Further studies
Various studies have found posture to be a moderate to strong predictor of low-back pain. Adams, Mannion, and Dolan [16] found the amount of lumbar lordosis to be a consistent predictor of low back pain. Christie, Kumar, and Warren found the shape of the spine to be a moderate predictor of low back pain. They state the importance of other, unidentified, predictors of low back pain. The findings of both studies match what was said in the interview done by Visser with the physiotherapist and the interview that expands on this with the orthopaedic surgeon.
Other than low back pain, neck pain is also considered to be a common risk of bad posture. Brink et al. [17] found that increased head flection predicted a higher pain score on upper quadrant musculoskeletal pain. The upper quadrant is a part of the body that includes the neck. Studies by shows that increased flection of the neck increases the gravitational moment on the neck [18]–[20] . This increased neck flection can be a source of potential neck pain.
2.1.4 Summary and overview incorrect postures
16
To aid the development of a posture sensing device, a list of different faulty and correct postures was constructed. These postures can then be used to determine useful sensors for the measuring device. The postures can be seen below in Figure 6 till Figure 8
Figure 6, postures in the coronal plane. A: correct posture. B: neck bend sideward. C: shoulders not straight. D: correct pelvis with bend back. E: pelvis rotated sideways causing scoliosis in the back.
Figure 7, postures in the sagittal plane. A: correct posture. B neck and part of upper back bend downwards. C: pelvis rotated backwards, slouched posture. D: bend forwards, causing neck to be angled upwards.
Figure 8, postures from the transverse plane. A: correct posture, shoulders straight above hips. B shoulders bend forwards. C: shoulders bend backwards. D: shoulders rotated, potentially causing the spine to rotate as well.
2.2 Machine Learning
Before the effectiveness of machine learning at posture measurement can be tested, one or more suitable machine learning techniques need to be identified. Identification of sitting posture is known as a supervised classification problem. Supervised machine learning problems focus on finding
connections between different classes of training data. The training data has been pre-divided into classed before the model is trained. Classification problems focus on categorizing the input data in discrete classes, for example: good posture versus bad posture.
17
array. This allows for the unimportant sensors to be removed. Removing the complexity and the cost of the system.
This paper will first identify relevant supervised classification machine learning algorithms by looking at literature about posture measurement. These machine learning algorithms should be
relatively simple to implement via third party software to make integration with the graduation project as smooth as possible. Then it will try to compare the effectiveness of these algorithms for the
intended goal of posture measurement. Lastly it will compare the accuracy of variable importance measurements. The goal of this literature review is not to create and evaluate an exhaustive list of suitable machine learning algorithms. Rather, the goal is to identify one or more suitable algorithms that can be used during the real live tests. Because of the number of algorithms available, it is beyond the scope of this paper to make the list exhaustive.
2.2.1 Literature research: Machine learning techniques suitable for posture identification
Machine learning techniques can be divided into classification and regression problems.
Supervised machine learning problems focus on finding connections between different classes
of training data. The training data has been pre-divided into classed before the model is
trained. Unsupervised machine learning algorithms on the other hand focus on finding new
classes within data by looking at the underlying structures. Unsupervised algorithms can
potentially identify new useful classes. Classification problems focus on categorizing the
input data in discrete classes, for example: good posture versus bad posture. On the other
hand, regression algorithms have a continuous output. An example of this would be
estimating the price of a house in a specific neighbourhood. Identification of sitting posture is
a supervised classification problem.
Many machine learning techniques exist that can be used for supervised classification problems. To identify promising techniques for posture measurement, a literature review is done concerning research about applying machine learning for similar goals. Various kinds of machine learning where used successfully in combination with sensors worn on the body. One study by Attal et al. [21] compared different machine learning techniques with wearable sensors. They attempted to use these techniques to try to human activities. Four different supervised classification machine learning techniques where used: K-nearest neighbor (K-NN), support vector machines (SVM), gaussian mixture models (GMM), and random forests (RF). Their research found the K-NN model to be the most accurate of the bunch. The SVM and RF models scored very close to K-NN and very similar to each other. The GMM scored significantly lower than the other 3, not even managing to break the 90 percent accuracy in any of the tests. Comparatively, the other 3 methods scored accuracy scores of close to 95 percent or more.
18
there is strong evidence that SVM, K-NN and RF are capable candidates for interpreting data
from body worn sensors. GMM is shown to be effective, but lacking compared to the other
methods. The studies mentioned do not look at sitting posture measurement, instead they try
to identify different types of human activities. For this reason, the results do not apply directly
to the goal of this paper. However, the type of sensors used and the nature of the
measurements is similar enough that the results still seem relevant. Thus, making K-NN,
SVM, and RF promising tools for posture measurement.
2.2.2 Literature research: Variable importance
In the previous segment of this paper 4 different machine learning techniques where discussed. Of these four techniques, GMM performed significantly worse than the rest in tests using sensor setups similar to the ones that will be used in this GP. The other three techniques performed very similarly to each other, with accuracies of over 90%. Of these three techniques only one offers variable importance methods, namely the Random Forest[25], [26]. Random forests variable importance uses four different measures to determine the importance of the variables.
Variable importance is known to be a complicated problem. However, it can be of great help when trying to reduce the complexity of a model. In the case of posture measurement this would ideally reduce the number of sensors necessary. In turn, this would increase the wearability of the device, while decreasing the costs, complexity and power use. Experience with variable importance measures in random forests by Liaw and Wiener[27] has shown that it can be useful for reducing the complexity of a model. Similarly, research by Belgiu and Drăgut[28] showed the usefulness of RF variable importance when trying to reduce the complexity of a model. Still, the measures in random forests give imperfect indications of the variable importance. Research by Strobl et al.[29] using simulated data shows potential problems with the variable importance methods of random forests. According to Strobl et al. “…suboptimal predictor variables may be artificially preferred in variable selection. “(P.1, Abstract).” The problems they found are mostly present in data with datasets that use data with a varying level of categories, for example using categorical and continuous data in the same random forest. The methods are shown to work well with data with a consistent level of categories. To solve the problem of variable importance, Strobl et al. present the cForest algorithm. In the simulations it is shown that the cForest algorithm attains significantly better results at the expense of computation speed. The cForest algorithm is available R[30], a popular programming language designed for statistical purposes.
All ML methods discussed above can be implemented relatively easily using 3rd party software
libraries. Scikit learn[31] is a python Machine Learning library allowing for the implementation of all these algorithms. All algorithms being available in the same environments allows for easy switching between different types of machine learning, making it possible compare the different algorithms. This also makes it possible to easily use different types of machine learning for their individual strengths. For example, it is possible to use the RF algorithm to estimate variable importance and to then use this new, less complicated system with the other types of machine learning to try and get the best results.
2.2.3 Literature research: Conclusion
19
from this simplified system.
The types of measurements done in the literature examined int this paper focused on
determining activity type, like sitting, walking, and running. This is a different type of
measurement than posture measurement. Because of this the results of the found studies do
not relate directly to posture measurement. However, the sensors used for the measurements
where often gyroscopes and accelerometers. These are the main types sensors that are of
interest when measuring posture. The sensors were also worn on the body; this again matches
with the sensors that will be used for the posture measurements. Because of the matching
measuring equipment, the research can be seen as an indication of the effectiveness of the
various machine learning techniques for posture measurement.
The machine learning techniques discussed in this paper are not an exhaustive list of
all the different techniques available, but it does provide a basis for further research into
posture measurements. Further research could focus on identifying more machine learning
techniques and comparing their effectiveness. Further research could also improve on the
accuracy of the effectiveness estimations, giving a better idea of what machine learning
techniques are most useful for posture measurement.
2.2.4 Random Forests
One popular supervised machine learning method that is suitable for classification is Random Forests [32]. Random forests are a machine learning technique developed by Breiman. Random forests are not only known to be good performers in a lot of situations, but also relatively user friendly.
The previous literature research showed great potential for the random forest machine learning algorithm. Radom forests is known to be a robust algorithm able to handle high dimensionality[28]. The ability of random forests to estimate variable importance can be extremely helpful when trying to decrease the complexity of the sensing system. Because of the potential of random forests for posture measuring, a more detailed overview of the technique was written
2.2.4.1 CART decision trees
Random forests are based on CART decision trees [32]. CART stands for classification and regression trees. As the name suggests, CART uses decision trees to perform classification or regression analysis. These decision trees are generated based on a set of labelled test data. Classification and regression trees use a different method to determine the right split for each node. Each node of a classification decision tree is split based on the GINI index. The GINI index is considered to be a greedy approach to splitting. This means that it tries to minimize the cost of running the tree by choosing what seems like the most efficient splits. The GINI index works by predicting the “purity” of a node. It does this by comparing the labels of the training data of each node [33]. If there is a large mix of different labels, the node is considered to be impure. A node of higher purity is considered to be more desirable. Decision trees are known to be prone to overfitting. Overfitting is a problem where the
decision tree fits the training data too well. This causes any unwanted noise present in the training data to be incorporated in the decision model. This decreases the accuracy of the model.
2.2.4.2 Bagging
20
by voting. Each tree in the algorithm “votes” for what it determined to be the right class. The class with the largest number of votes will be the final output of the algorithm. Regression algorithms work by outputting an average of the results of all the trees.
Bagging is closely related to random forests. Liaw and Wiener described random forests as “adding another layer to bagging” [27]. In random forest extra randomness is introduced by choosing random variables for each decision note in each tree made, instead of using all variables for each note. This randomness greatly helps to prevent overfitting [32] and allows for accurate predictions to be made.
2.2.4.3 Out of bag estimation
In his 1996 paper, Breiman introduces what he calls the ‘out of bag estimation’ (OOB) [35]. This is a technique that can be used to calculate an internal error rate when bagging decision trees. The bootstrap sample used for each tree uses about 67 percent of the training data, while leaving the other 33 percent unused. This other 33 percent can then be used to estimate statistics about the data. For example, an internal error rate can be calculated using an OOB estimation. In the real life experience of Liaw and Wiener [27], this estimation tends to be quite accurate. They do note that research by Bylander has shown that the OOB can have a tendency to bias upwards. The benefit of using OOB to calculate the error rate is that there is no need for an extra set of testing data.
2.2.4.4 Variable importance
It is not known yet what the correct sensor placement is to measure posture, nor which data is
necessary. One way to test this is to start off with a large number of sensors and to determine which of these sensors can be eliminated without affecting the quality of the output too much. Breiman
developed four methods to measure the importance of different values. He explains these in his “Manual on setting up, using, and understanding random forests V3.1” [26]
Method one: The first method starts by randomizing the decision notes determined belonging to the value that is being tested, and then comparing the internal error rate. The randomization is done by identifying the decision notes that rely on the variable in question, and making their outcome random. Then internal error rate of this new adjusted forest is compared with the error rate of the original forest. A small increase in the internal error rate indicates a not so important variable, while a large increase in the internal error rate indicates a variable of high importance.
Method two: The second method starts in the same way as method one, by randomizing the notes reliant on the relevant variable. Instead of comparing the internal error rate, this method compares the margin of the output of the new forest to that of the old forest. This is done for one specific case in the data.
Method three: The third method is quite similar to the second one, but instead of comparing the margins of one case directly, this method compares the number of margins gone up versus the number of margins gone down over all test cases.
Method four: The fourth method uses the impact of a variable on the Gini index to estimate its importance. By adding up the total decrease in the Gini index caused by the variable in question, one should get a reasonable idea of the importance of this variable. This number is normalized by the number of trees. A variable that has a lot of influence on the Gini index should theoretically be of higher importance than one that does not.
2.2.4.5 conclusion random forests
21
One big advantage random forests have over other machine learning techniques is their ability to estimate variable importance. Originally, four methods for variable importance estimation where developed. Three of these methods depend on randomizing the decision nodes that are dependent on a specific variable. By testing the model before and after the randomization, the usefulness of a specific variable can be compared to a random 50/50 split. The fourth method calculated the impact a variable has on the Gini index. In theory, a variable that causes a large total decrease in the Gini index should be more important than a variable that has a smaller impact.
2.3 Similar products
There are various products on the market that promise the user real time feedback on the quality of their posture. Two of these are Lumo lift[36] and Upright Go[37]. Both these “smart wearables” use a single sensor placed on the body for their measurements. Lumo Lift uses a clip-on sensor that can be clipped onto the clothing of the wearer. The Go uses a sensor that has to be placed directly on the back of the user. The data that can be gathered from the single sensor module is limited. This is noticeable in the performance of the Lumo Lift and the Go. Visser[11] found in personal tests that the Lumo Lift missed certain bad postures. For example, an incorrect position of the scapulae was not noticed is the rest of the posture was correct.
The sensor in the Lumo Lift can also be used for other measurements. The application provided with the device can estimate the number of steps taken, the estimated distance walked, and the estimated calories burned. This turns the device in a more general fitness tracker instead of just a posture measuring device.
As far as wearable posture sensors go, most of the products on the market seem to take a similar approach as the Lumo Lift and the Upright GO. For example, the Opter Pose[38] is a Kickstarter project proposing a sensor on a necklace. This sensor seems to work similarly to the GO and the Lift. One different way to measure posture is via the seat rest. The Darma[39] is an example of such a device. Of course, this type of device is not wearable. Finding out the accuracy of these posture measuring devices is hard because the companies that produce them do not supply any studies on the effectiveness of their devices. Because of this it is hard to say which device works best.
2.4 Conclusion
Defining the difference between good and bad posture is a complicated problem. Based on a review of the literature, an interview with a physiotherapist done by another bachelor student, and an interview with an orthopaedic surgeon, it was possible to create a general definition sufficient for this project: good posture is posture that allows for efficient use of the muscles required to maintain said posture while avoiding unnecessary stress in the vertebrae and joints, bad posture is posture that is not good posture.
22
3 Ideation
3.1 Sensors
In this part of the report possible sensors and sensor positions will be discussed. First, there will be a diverging part to identify as many possible sensors as possible. Then, there will be a part looking at the xSens MVM suit that incorporates multiple sensors in compact sensor units. Lastly, there will be a diverging part to determine that sensors that will actually be used.
3.1.1 Sensors for each type of bad posture
This part of the report is part of the diverging process. Ideally each bad posture in Figure 6 to Figure 8 should be measurable. To get an overview of what kind of sensor might be helpful, or even needed, a seemingly suitable sensor and sensors placement for each type of bad posture was determined.
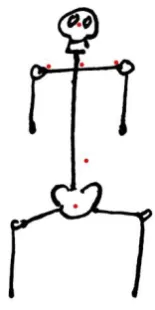
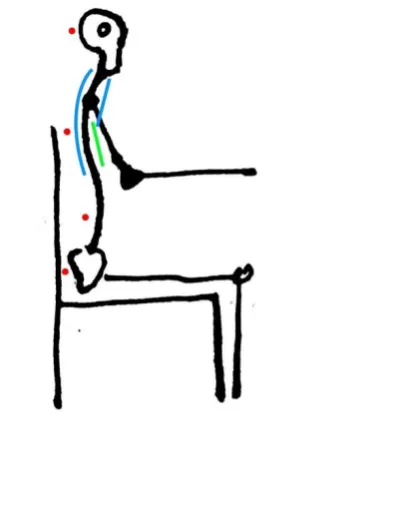
The bad postures in the sagittal plane are a combination of the position of the pelvis, head, and the shape of the spine. To measure these parts of the body in relation to each other, gyroscopes could be placed on the pelvis, along the spine, and on the head, see Figure 9. This would allow for a
[image:22.595.204.404.381.634.2]comparison between the angles of these different parts of the body, allowing for detection of a correct shape of the spine. Another way to keep track angles between these parts of the body is by using stretch and bend sensors. For example, stretch sensors could be placed on the neck to detect a down- or upwards bend. The stretch sensor on the back of the neck could even be extended to cover the upper back. A bend sensor could be placed underneath the sternum to help detect a slouching posture.
Figure 9, posture sensors in the sagittal plane. Red indicates a gyroscope, Green indicates a bend sensor, and blue indicates a stretch sensor.
Sensing Neck-position: There are also more unconventional ways to try and detect posture,
23
them, which would give an indication of the position of the neck. Lastly, the ears could be used as an appropriate place for sensor placement. Firstly, sensors can be attached from the earlobes like
[image:23.595.81.513.205.326.2]jewellery. Secondly, they can be clipped on the ear similar to some hearing aids and earphones. Lastly, they can be placed behind the ear, hiding them form view. The most obvious sensor to place at the ear would be a gyroscope. However other interesting options are possible. One idea would be to attach a magnet to the earlobe, and a hall sensor to the shoulder, allowing for the position of the ear over the head to be measured. Another idea is to attach stretch sensors from the earlobe to the shoulder. A similar idea to that of the hall sensor would be to attach a photodiode to the ear and an LED to the shoulder. See Figure 10 for more information about the placement of the sensors discussed.
Figure 10, Sensors measuring the position of the neck. A: proximity sensors on trunk. B, C: capacitive sensors near neck. D: gyroscope (red) on ear and stretch sensor from ear lobe to shoulder. E: LED with photodiode. F: magnet with Hall sensor.
Similarly, to the sagittal plane, bad postures in the coronal plane can be the result of an incorrect position of the pelvis, head or spine. Additionally, bad posture in the coronal plane can be caused by incorrect positioning of the shoulders. The sensors discussed in the previous section about the sagittal plane and the neck can also be useful for posture measurement in the coronal plane. Seemingly the only thing in the coronal plane that could not be measured this way is the position of the shoulders. To make detection of the shoulder position possible it is likely that extra sensors are needed. On example would be adding gyroscopes to the shoulder. Another option would be to attach a stretch sensor under the armpit to detect the shape of the muscles reacting to the position of the shoulder. Instead of a stretch sensor under the armpit, a pressure sensor might work for similar measurements. Lastly, adding a stretch or bend sensor horizontally along the shoulders could be useful. This sensor could be
24
Figure 11, posture sensors in the coronal plane. Red indicates a gyroscope, Green is a bend sensor, blue indicates a stretch sensor, and brown indicates a pressure sensor.
The last plane to discuss is the transverse plane. Posture in the transverse plane is determined by position of the shoulders and the rotation of the spine. Using the gyroscopes discussed before, it should be possible to measure these things. Specifically, a gyroscope on the lower back and one on the upper back could be useful, see Figure 12.
[image:24.595.244.343.480.695.2]25
One type of sensor that has not been mentioned yet is the accelerometer. Accelerometers are
commonly used on body sensors. There are various potential ways to use accelerometer measurements to try to determine sitting posture. One way would be to replace all gyroscopes discussed previously with accelerometers in the hope that the accelerometer data will be able to fulfil the same function. Another idea would be to only use the pelvis and the head placement in an attempt to track the distance between these two body parts. This type of accelerometer use probably needs some type of calibration of the upright posture and some way to keep track of the movement history as
accelerometers say nothing about their current position, they only measure acceleration.
One seemingly more unconventional way to measure posture quality would be to attach one or more accelerometers to the users’ shoulder or neck. It might be possible to predict the user’s posture based on the small corrections made by the body to keep itself upright. These small corrections might change when one’s posture is changed.
3.1.2 xSens
The xSens MVM Analyze[40] is a product meant for real time capture of movement data. The suit is meant to be usable outside of laboratory conditions. The suit comes with a base unit and various sensor units. It was designed to be an affordable, full body, motion capture suit. The matching
[image:25.595.121.472.390.696.2]software allows for the calculations of joint angles and the centre of mass of the user. Each sensor unit contains a 3D accelerometer, 3D gyroscope, 3D magnetometer (that measures the earth’s magnetic field), and a barometer. The sensor units are placed on nearly all parts of the body, including the hands, feet, and head. They can be attached using either straps or the Lycra suit, see Figure 13.
Figure 13, xSens MVM Analyze suits. A: Lycra suit. B: Straps [41]
26
section 2.2.1. The placement of the sensor on the xSens suit is a little bit different however, making it potentially inconvenient to work with.
3.1.3 Types of sensors that will be used
In part 3.1.1 of this report an overview was made of different sensors that might be useful for posture measurement. Not all of these sensors will be used during the tests. Out of all the sensors listed, the most promising few where chosen. These sensors are: the gyroscope, the accelerometer, and the stretch sensor.
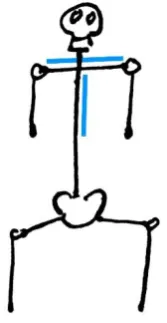
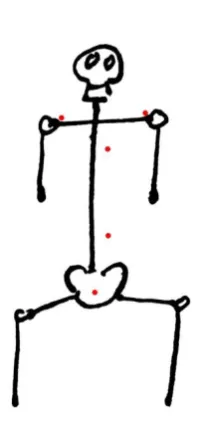
[image:26.595.94.172.385.541.2]The gyroscope was chosen as known to be a reliable sensor for full body tracking. The xSens suit mentioned earlier is an example of a full body tracking suit that uses gyroscopes as part of its measurements. Gyroscopes are also compact. Making them easy to use as wearable sensors. Lastly, gyroscopes measure angles, which seems like an ideal type of measurement for posture recognition as the angles between different parts of the body determine the quality of the posture. The gyroscopes will be placed in a way that allows for a comparison of the angles between the different parts of the body that are important for a correct sitting position. Such positioning of the gyroscopes has been determined in part 3.1.1, see Figure 14. This involves placement on the pelvis, lumbar curve, thoracic curve, shoulders, and head. The sensor placed on the lumbar will be positioned in the “deepest” part of the curve to try to get an accurate measurement of the state of the lumbar. The gyroscope placed on the thoracic spine will be placed slightly higher up in an attempt to pick up more of the neck movement.
Figure 14, red dots indicate the position of a gyroscope.
Just like gyroscopes, accelerometers are often used for full body tracking. In fact, most gyroscopes sensors modules come equipped with an accelerometer as well. Because of this it is relatively simple to not only include accelerometers in the test as well as gyroscopes.
27
[image:27.595.96.180.122.284.2]the same types measurements to be done using only stretch sensors instead of both stretch and bend sensors. For the final position of the stretch sensors see Figure 15.
Figure 15, blue lines indicate the position of a stretch sensor
In chapter 2.2 many more different kinds of sensors are mentioned. Most of these sensors will not be used during the actual tests. Especially many head and neck position sensors are left out of the tests. This is because they are expected to either not work very well, or to stretch the limits of what can be considered wearable. The xSens suit is also left out of the tests. This is because the sensor
28
4 Specification
In chapter 2 the theoretical background of the research was given. This chapter will focus on creating a concrete plan to obtain and analyse the desired data. To do this it will outline what sensors will be used, what machine learning techniques will be used, the way the suit will be constructed and the way the test will be conducted.
4.1 Sensors
4.1.1 Sensor modules that will be used
To implement the gyroscope and the accelerometer, it is most convenient to use a sensor module that combine both. This makes it easier to connect the sensors and it makes sure all the axis line up correctly. There are various modules that provide this functionality. One of these modules is the MPU6050 [42]. The MPU6050 is generally considered to be one of the more precise and reliable gyroscope and accelerometer modules available in the consumer market. Because it is a consumer product, it is widely available and affordable. The MPU 6050 uses a I²C bus the communicate. This allows for reliable communication with an Arduino. Because the I²C bus of each sensor module tries to write to the same I²C address, it is not possible to easily control all 6 MPU6050 modules at the same time. To get over the limitations of the MPU6050 I²C implementation an Adafruit TCA9548A I²C [43] multiplexer will be used.
The stretch sensors that will be used are Adafruit conductive rubber cords[44]. These elastic cords increase in resistance when they are stretched. Integrating one of these cords into a voltage divider allows for an Arduino to measure the amount which the cord is stretched out.
4.2 Suit
The suit housing the sensors will need to provide suitable sensor placement on many different people with different kinds of bodies. It must be able to place the sensors on the correct part of the body, while also holding them tight enough to allow for accurate and consistent measurements. To ensure a properly working suit, the design process will occur in multiple stages. First, a basic suit will be made. This suit will then be tested on 2 to 3 people. The experience gathered during these tests can then be used to improve the suit for the full-scale measuring sessions. In the end, multiple full-scale measuring sessions were held. The suit was changed based on the experience of each new session.
4.2.1 First version sensor suit (used in session one and two)
In order to make the suit as adaptable as possible, a combination of stretchy fabric, elastic bands and Velcro is used. The suit is be based on a stretchy t-shirt. The sleeves are removed of this shirt because they are not necessary for the sensor placement and they might get in the way of the wear ability of the suit. To allow the suit to adapt to different body types, the side seams of the t-shirt are ripped open. These seams can then be closed using elastic bands and safety pins. This allows for the shirt to be fitted exactly to the wearer’s body.
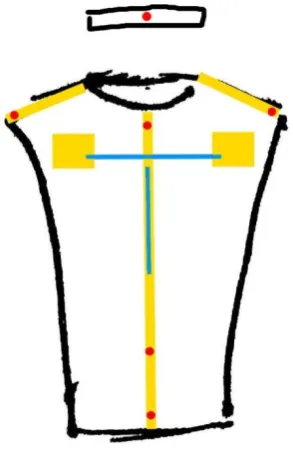
Because every body is different, the sensor position on the suit needs to vary a bit from person to person. To allow for easy repositioning of the sensors, velcro is used. Each sensor is attached to a little strip of velcro that can then be attached to a velcro strip on the suit. This allows for easy and fairly precise adjustment of the sensor placement on the suit to match different bodies. See Figure 16 or the placement of the velcro strips on the suit and the corresponding sensor position. A picture of the real sensor suit can be found in appendix F.
29
[image:29.595.89.236.139.370.2]the gyroscopes and a x, y, and z acceleration for the accelerometers. The accelerometer angles are relative to the “world”. This means that the gyroscope angles are used to compensate for the rotation of the accelerometers, allowing the x, y and z dimensions to remain in the same relative orientation relative to the world at all times. Apart from this, no special processing of the data is done.
Figure 16, velcro and sensor layout on sensor suit. yellow indicates velcro strips. Blue indicates stretch sensors. Red indicates gyroscope/accelerometer modules.
4.2.2 Second version sensor suit (used in session three)
The second version of the sensor suit does not differ much from the first. The physical side is completely the same. The only change comes in the form of code. The first version of the code sends the latest sensor data available to the computer, without any regards of the sensor values that came before it. Because of this, random noise in the sensor values can have a large impact on the data. In the second suit however, the data that is communicated to the computer is an average of the sensor values over a 1 second interval. This averages out the random noise and should produce cleaner data.
4.2.3 Third version sensor suit (used in session four)
The third version of the sensor suit is mostly the same as the previous versions. The Physical suit is exactly the same as before. The only change comes in the form which the accelerometer data is processed. In the previous measuring sessions, the accelerometer data was recorded in Cartesian coordinates. The movement over each of these coordinates was averaged over the moving window, this number was then used to train the machine learning algorithm. In the new system, spherical coordinates are used. These spherical are all normalized to have a length of 1. Meaning that only the angles of the vector are important, and not its size. The average angles are taken over a one second window and used to train the machine learning model. The goal of this new way of storing the
30
4.3 Machine learning
4.3.1 Data processing
The values outputted by the sensors are only really relevant when they can be related to something. This is because the values outputted by the sensors are relative to their own position. For example, a gyroscope indicating an angle of 95 degrees does not mean anything unless you can compare it to some sort of baseline angle. Because of this, it is expected that all sensor data will need to be related to some kind of baseline. One way to process the data is by subtracting a line of correct posture data from it. This way the data shows the difference between the current posture and the correct posture. Another way to relate sensor data to each other is by comparing the different sensors against each other. For example, the difference between the angles of two gyroscopes. Using the different sensors without any kind of baseline will likely result in data that is limited in its use.
4.3.2 Machine learning software
The machine learning model will be trained using the free machine learning library from Scikit Lean[31]. Scikit learn allows for easy implementation of various machine learning algorithms, including the random forest (RF) algorithm. RF is the main machine learning algorithm that will be used as it is able to both perform classification tasks and variable importance estimations. See chapter 2 for more information about different machine learning techniques. One benefit of Scikit learn is that it makes it easy to switch between different machine learning techniques. This allows for
experimentation with different techniques and their accuracy. The python code can be found in appendix A. This code is based on a tutorial by stackabuse.com[48].
4.4 measurement design
The measurement data needs to be gathered in a systematic way to ensure consistent measurement conditions and representative data. For this reason, precise measuring procedures are described in this chapter.
First, the test subject will be asked to read through and sign the consent form and matching information sheet. Any questions asked by the participant need to be properly answered. When the consent form has been signed by both the participant and the researcher, the sensor suit needs to be placed on the test subject. This needs to be done by the researcher. The researched need to ensure the suit is placed tightly around the body of the test subject and that all sensors are positioned correctly, taking extra care that the stretch sensors are being activated when they should.
The actual data will be gathered on the basis of the good and bad postures identified in chapter 2, see Figure 6 till 8. The participant will be asked to sit in all different positions identified in these figures. For each of the postures one or more lines of data will be gathered. During the measuring sessions the Arduino of the sensor suit will be connected to a laptop via USB. To prevent any harm done to the participant by the electronics, the laptop cannot be connected to the power net via a charging cable. Afterwards, the participant will be relieved of the sensor suit and thanked for their cooperation.
4.5 Consent form and ethical approval
31
5 Realisation.
This chapter aims to give an overview of the different iterations of the data gathering sessions and sensor suit. It discusses the changes made in each iteration and the results that were obtained during the data analysis. The suit and measurement design are based on the ones described in the specification chapter. Each iteration of the measurement cycle adds the relevant changes to this design. For the detailed information about the data analysis and results, see chapter 6 “Data Analysis”.
5.1 Pilot measuring session.
5.1.1 Result from the pilot measuring session.
In order to identify any problems with the suit, code, and data analysis, a small pilot study was conducted. This study collected the data from 3 different test subjects. These sessions went well, with the test subjects being able to understand the things they were supposed to do. The suit also did not constrain them too much, allowing them to perform the desired movements without any inhabitations. To increase the amount of data gathered, multiple “lines” of data where gathered for each sitting position. This data was gathered in quick succession, not allowing for much movement in between each line of data. This resulted in data that was very similar to each other, possibly misrepresenting the accuracy of the machine learning model.
The suit performed well most of the time, but every now and then the Arduino program would crash, requiring a restart of the device. The suit had a bigger problem with the stretch sensors not working as expected. Especially the sensor running across the shoulders did not activate as much as expected.
During the data analysis it became clear that the data was not outputted in an efficient format, requiring significant alterations before being used to train the machine learning model. Using the raw data, the random forest algorithm had troubles creating an accurate model. This was likely caused by variations in gyroscope output every time they were reset, causing the data from different
measurements to be almost useless in comparison to each other. To improve the predictive abilities of the model, the data was processed by relating it to data from the correct sitting position. In practice this meant that the sensor values from the correct sitting position where subtracted from all the other values. Making all data relative to the data from the correct posture. This greatly improved the accuracy of the model, making it hit 100 percent accuracy in many situations.
5.1.2 Improvements made based on the pilot measuring session.
To solve most of the problems identified during the pilot session, the suit, code, and way of doing measurements was changed slightly. First of all, a slight alteration in the way the Arduino outputted the data was made. The goal of this was to make the manual data processing less intensive. Secondly, extra elastic straps where added to the suit in an attempt to improve the output of the stretch sensors. Most notably, an elastic band underneath the armpit was added to further tighten the shoulder stretch sensor to the body of the test subject. The measuring protocol was changed as well, instead of gathering multiple lines of data in quick succession for each sitting position, each test subject will be asked to go through all the sitting positions multiple times. This should increase more variance in the data, making it more representative.
The cause of the suit crashing was identified to be a short circuit between a stretch sensor and an MPU 6050 module. By slightly moving the position of these sensors, the crashing was significantly reduced. The crashes where not completely gone however, but infrequent enough to not cause
significant problems. After each crash new baseline needs to be gathered. The new measurements then need to be processed with this new data.
5.2 First measuring session.
32
on each posture in figure 6 till 8 twice to increase the amount of data available. During these measurements, the improvements designed based on the results from the pilot study where
implemented. This resulted in better readings from the stretch sensors, and more variance in the data.
5.2.1 Improvements based on the first measuring session.
During the data analysis it was discovered that a mistake was made in the way the data was gathered. When processing the data, one line of correct posture data is needed to act as a baseline as a baseline. This line of correct posture data can then not be used to train the machine learning model anymore. This resulted in a significant lack of correct posture data. The lack of correct posture data was aggravated by the way the measurements were conducted. Because figure 6 to 8 only contain one “kind” of correct posture and many more kinds of incorrect posture, a disproportionate amount of incorrect posture data was collected in the first place. The lack of correct posture data was visible in the results of the data analysis (see chapter “data analysis”). Most of the wrong guesses made by the random forest model concerned the correct posture data.
5.3
Second measuring session.
The goal of the second measuring session was to expand upon the data from the first sessions. Based on the results of the first session, it was concluded that more correct posture data is needed in order to improve the accuracy of the machine learning model. To do this, three extra test subjects where tested. These sessions focussed mainly on gathering correct posture data, while also adding a bit to the incorrect posture data. The data from the first session was combined with the data from the second session to create an extra-large data set with data from 12 different people.
5.3.1 Improvements based on the second measuring session.
During the data analysis, two extra problems with the data were found. Firstly, almost all of the correct posture data came from only a few test subjects, while most of the incorrect posture data came from the others. This resulted in an unnatural split between the correct posture data and the incorrect posture data. Secondly, there was a problem with the way the data was recorded. The data recorded by the sensor suit was based on a single sensor value, without any processing done to it. resulting in a big influence of random noise and movements on the data. This can be improved by taking an average of the data over a set amount of time.
5.4
Third measuring session.
The third measuring session was designed to improve upon the mistakes made in the first and second session. Firstly, the second session had a division in the data. With most correct posture data coming from the people measured in the second session and most incorrect posture data coming from the first session. This could mean that the data is unrepresentative. To avoid similar problems during this measuring session, an almost equal amount of correct and incorrect posture data was gathered from each test subject in this test.
The second problem with the first and second sessions relates to the way the sensor data was read and stored. The measuring suit in the earlier test recorded the latest values from the sensors without any processing done to them. This approach is very sensitive to random noise and small movements. To make the sensor values more stable, the sensor suit in the third session took the average sensor values over one second.
5.4.1 results from the third measuring session.
33
and the sensor module on the head band where the most important. When training the model using only the data from these modules an accuracy of 85 per cent was attained. Using only the left shoulder sensor instead of both the left and right did not decrease this accuracy. Even using the left shoulder module without the module on the head band did not affect accuracy at all, maintaining an accuracy of 85 per cent.
In real life it is common for people to move throughout the day. For example, when sitting next to a curved desk someone might rotate on their chair to use different parts of said desk. To simulate the effect this might have on a machine learning model, this angle of rotation (the pitch angle) was removed from the gyroscope data. Training the machine learning model using the data without the pitch angle resulted in an accuracy of 84 per cent. For an overview of the accuracies of the different machine learning models that where discussed during this session, please see Table 1. For a more detailed analysis of the data see the next chapter, “Data Analysis”.
Dataset: Accuracy of the random forest model
(%):
Unprocessed data. 86
Data relative to correct posture. 92 Data relative to the upper back modules. 80 Only using the head and both shoulder modules, data relative to correct posture.
85
Only using the head and left shoulder modules, data relative to correct posture.
85
Only using the left shoulder module, data relative to correct posture.
85
Data without pitch angle, relative to correct posture. (all sensors)
84
Table 1, the accuracy of various models trained using different datasets. All data from 3rd measuring session.
5.4.2 improvements based on the third measuring session.
One improvement could be made on the way the data was gathered during this session. The current measuring setup does not take into account that the users of a posture measuring device might move around. For example, the user might sit in an office chair that is able to rotate. This rotation could throw off the measuring device. For further measurements, this rotation should be taken into account.
5.5 Fourth measuring session.
The fourth measurement session was designed not only to improve on the third session while also testing a different approach to the way the data is stored. Two big changes were made compared to the third session. Firstly, this session included the type random position changes that might occur when working at a desk. For example, a user might rotate their chair to access different parts of their desk while they are working or move to a different desk entirely. These changes were simulated by asking the test subject to sit on an office chair and having them rotate in random directions between each sitting position. During the session the test subjects rotated in a 180-degree window.
The second way in which the session differs is in the way it records the accelerometer data. In the previous measuring sessions, the accelerometer data was recorded in Cartesian coordinates. The movement over each of these coordinates was averaged over the moving window, this number was then used to train the machine learning algorithm. In the new system, spherical coordinates are used. These spherical coordinates all have a length on 1. Meaning that only the angles of the vector are important, and not its size. The average angles are taken over a one second window and used to train the machine learning model. The goal of this new way of storing the accelerometer data is to focus more of the angle of the acceleration vectors instead of their magnitude.
34
5.5.1 results from the second measuring session.
Training the random forest model using unprocessed data resulted in an accuracy of 75 per cent. This is much lower than the 86 per cent using the data from the third session. After processing the data to make it relative to the correct posture, the accuracy increased to 84 per cent. Again. This is lower than the 92 per cent achieved during the previous session. Interestingly, this is the same accuracy as the model in the previous sessions that had all data from the pitch angle of the gyroscopes removed. that model was designed to simulate the measuring sessions of this session.
The random forest variable importance measures gave a high score to the gyroscopes on both shoulders, the headband, and the lower back. This is similar to the results of the previous analysis, except for the added importance to the lower back gyroscopes. The spherical coordinates based of the accelerometer data where estimated to be fairly unimportant by the variable importance measures. In an attempt to reduce the complexity of the sensor suit, the random forest model was trained using only the data from the sensor modules on the shoulders, head, and lower back. This model had an accuracy of 83 per cent. Removing the right shoulder from the dataset resulted in an accuracy of 81 per cent. Training this model without the lower back sensor module, so using only the left shoulder and head band, did not result in a decrease in accuracy, retaining the 81 per cent accuracy. Training the model using only the data from the head band and the lower back gave an accuracy of 79 per cent.
Interestingly, the variable importance estimations greatly preferred the gyroscopes over the accelerometers. When training the model using only accelerometer data or only gyroscopes data, these predictions are conformed. The model using only gyroscopes achieves an accuracy of 84 per cent. The same as the model using all sensor modules. The model using only accelerometer data achieves the abysmal accuracy of 39 per cent, worse than would be expected from a random 50/50 guess. Training the model using stretch sensors only results in an accuracy of 56 per cent. Again, confirming that the gyroscope data is by far the most useful for posture detection. For an overview of the accuracies of the different machine learning models that where discussed during this session, please see Table 2. For a more detailed analysis of the data see the next chapter, “Data Analysis”.
Dataset: Accuracy of the random forest model
(%):
Unprocessed data. 75
Data relative to correct posture. 84 Only using the head, lower back, and both shoulder modules, data relative to correct posture.
83
Only using the head, lower back, and left shoulder modules, data relative to correct posture.
81
Only using the left shoulder and head module, data relative to correct posture.
81
Using only the lower back and head module, data relative to correct posture.
79
Using only gyroscopes, data relative to correct posture.
84
Using only accelerometers, data relative to correct posture.
39
Using only stretch sensors, data relative to correct posture.
[image:34.595.73.527.435.674.2]56
35
6
Data Analysis
6.1 Data analysis session one
During the data analysis it was discovered that a mistake was made in the way the data was gathered. Because all the data needed to be processed using the straight posture data, there was no straight posture data left over to train the machine learning model. To solve this problem, extra data had to be gathered. This extra data gathering focussed mainly on gathering straight posture data. Because of a lack of time, the data was gathered by placing the sensor suit on myself. After obtaining the extra correct posture data, and some extra incorrect posture data, the data could be processed properly. However, this meant that the correct posture data available to train the model was relatively limited and all based on one person.
6.1.1 Training the random forest model using unprocessed data
[image:35.595.70.461.395.623.2]To test the need for the baseline correct posture data the random forest model was first trained using the “raw”, original, data. This data does not contain the extra data gathered from the researcher himself. Eighty percent of the data was used to train the model, while the other 20 percent was used to test the model. A model was produced using both twenty estimators and one-hundred estimators to test the difference in accuracy. This model was tested using five different training and testing splits. These training and testing splits where generated using the Scikit learn “train_test_split” function. The average accuracy of the 20-sample model and the 100-sample model was virtually the same, with the 20-sample model having an accuracy of 0.90000 out of 1 and the 100-sample model having an accuracy of 0.90625. See Figure 17 for the accuracies for each testing/training split.
Figure 17, the accuracy of the random forest model using different training and testing splits, “raw” data.
All Figure 20 does show which predictions where wrong and which were right. A confusion matrix shows the spread of the predictions. Adding the confusion matrices from all training splits together results in the confusion matrix in Figure 18. This shows that most incorrect predictions are wrongly classified correct posture data, with only one incorrect prediction being a misclassified as correct posture. This is most likely due to the difference between the amount of data gathered on wrong posture versus the amount of data gathered on correct postures. This difference resulted from gathering data for each of the postures identified in Figure 5 to 6. These figures contain more bad postures then good postures.
0,7 0,75 0,8 0,85 0,9 0,95 1
0 1 2 3 4
accuracy
o
f t
h
e p
re
d
ic
tion
s
random seed used for splitting the testing and training data
![Figure 1, Cervical, Thoracic and Lumbar part of the spine [11]](https://thumb-us.123doks.com/thumbv2/123dok_us/9643622.466654/12.595.115.255.591.682/figure-cervical-thoracic-lumbar-spine.webp)
![Figure 3, the coronal, sagittal and transverse plane. [13]](https://thumb-us.123doks.com/thumbv2/123dok_us/9643622.466654/13.595.88.386.343.638/figure-coronal-sagittal-transverse-plane.webp)
![Figure 5, postures int he coronal plane. [15]](https://thumb-us.123doks.com/thumbv2/123dok_us/9643622.466654/14.595.71.335.104.317/figure-postures-int-he-coronal-plane.webp)

![Figure 13, xSens MVM Analyze suits. A: Lycra suit. B: Straps [41]](https://thumb-us.123doks.com/thumbv2/123dok_us/9643622.466654/25.595.121.472.390.696/figure-xsens-mvm-analyze-suits-lycra-suit-straps.webp)