RESEARCH ARTICLE
Do the relationships between hindlimb anatomy and sprint
speed variation differ between sexes in
Anolis
lizards?
Aurélien Lowie1,2, Elisa Gillet1, Bieke Vanhooydonck3, Duncan J. Irschick4, Jonathan B. Losos5and Anthony Herrel1,2,3,*
ABSTRACT
The ability of an animal to run fast has important consequences on its survival capacity and overall fitness. Previous studies have documented how variation in the morphology of the limbs is related to variation in locomotor performance. Although these studies have suggested direct relations between sprint speed and hindlimb morphology, few quantitative data exist. Consequently, it remains unclear whether selection acts in limb segment lengths, overall muscle mass or muscle architecture (e.g. muscle fiber length and cross-sectional area). Here, we investigate whether muscle architecture (mass, fiber length and physiological cross-sectional area), hindlimb segment dimensions, or both, explain variation in sprint speed across 14 species ofAnolislizards. Moreover, we test whether similar relationships exist between morphology and performance for both sexes, which may not be the case given the known differences in locomotor behavior and habitat use. Our results show that the main driver of sprint speed is the variation in femur length for both males and females. Our results further show sexual dimorphism in the traits studied and, moreover, show differences in the traits that predict maximal sprint speed in males and females. For example, snout vent length and overall muscle mass are also good predictors of sprint speed in males, whereas no relationships between muscle mass and sprint speed was observed in females. Only a few significant relationships were found between muscle architecture (fiber length, cross-sectional area) and sprint speed in male anoles, suggesting that overall muscles size, rather than muscle architecture, appears to be under selection.
KEY WORDS: Ecomorphology, Locomotion, Performance, Muscle, Myology, Lizard
INTRODUCTION
Performance, or the ability of an animal to execute an ecologically relevant task (Huey and Stevenson, 1979; Irschick and Higham, 2016), is a central component of evolutionary studies investigating trait utility. For example, the ability of an animal to run fast has
consequences on its ability to capture prey, defend territories or to escape predators (Hildebrand, 1985; Garland and Losos, 1994) and as such may be under direct selection (Irschick et al., 2008). Given the importance of locomotion in many ecologically relevant contexts, many studies have focused on the morphology of the limbs in relation to performance and habitat use (e.g. Snyder, 1954, 1962; Losos, 1990a,b,c; Irschick and Jayne, 1999; Zaaf et al., 1999, 2001; Zani, 2000; Irschick and Garland, 2001; Herrel et al., 2008; Abdala et al., 2009; Tulli et al., 2011; Foster and Higham, 2012, 2014; Lowie et al., 2018). One recurrent finding in studies assessing the relation between morphology and performance is that variation in body size is often correlated with variation in performance (Losos and Sinervo, 1989; Losos, 1990a,b; Garland and Losos, 1994; Arnold, 1998; Irschick and Jayne, 1998; Bonine and Garland, 1999; Vanhooydonck et al., 2002; Van Damme and Vanhooydonck, 2001). Moreover, longer legs should also provide a performance advantage as they allow an animal to take greater strides (Hildebrand, 1974). Although most studies trying to relate sprint speed and hindlimb morphology used total limb length (e.g. reviewed in Garland and Losos, 1994; Bauwens et al., 1995; Bonine and Garland, 1999), other studies have demonstrated that specific limb segments may be better predictors of sprint speed in lizards (Miles, 1994; Fieler and Jayne, 1998; Irschick and Jayne, 1999; Vanhooydonck et al., 2006a,b).
Previous studies based on myological, kinematic and electromyographic data also suggested an important role of the limb muscles in driving variation in sprint speed (Snyder, 1954; Reilly, 1995; Reilly and Delancey, 1997; Nelson and Jayne, 2001). Specifically, larger muscles may provide more absolute power output and thus increase locomotor performance (James et al., 2007). Moreover, a study investigating sprint speed and acceleration capacity across 16 species ofAnolisshowed that not only the size of the hindlimb segments is correlated with sprint speed but also the mass of the hindlimb muscles (Vanhooydonck et al., 2006a,b). However, in that study, only three muscle groups (knee and ankle extensors, femur retractor) were studied. Consequently, more quantitative data on variation in limb muscles among species, and how it influences variation in sprint speed, are needed. Specifically, whether faster running involves only changes in overall muscle size or whether muscle architecture (e.g. muscle fiber length or muscle cross-sectional area) is also affected remains unknown.
Additionally, sexual dimorphism in size and shape, commonly observed in many lizard species, is known to influence locomotor performance (Butler et al., 2000; Butler and Losos, 2002; Losos et al., 2003; Irschick et al., 2005; Herrel et al., 2006, 2007; Butler, 2007). Given the documented differences in behavior among males and female lizards in terms of territorial defense, such differential evolutionary pressures, may result in differences in limb anatomy and locomotor performance (Perry et al., 2004; Husak et al., 2008; Herrel et al., 2016). Males may, for example, benefit from greater Received 19 July 2018; Accepted 21 January 2019
1UMR 7179 C.N.R.S./M.N.H.N., Département d’Ecologie et de Gestion de la Biodiversité, 57 rue Cuvier, Case postale 55, 75231 Paris Cedex 5, France. 2Ghent University, Department of Biology, Evolutionary Morphology of Vertebrates, K.L. Ledeganckstraat 35, 9000 Gent, Belgium.3Department of Biology, University of Antwerp, Universiteitsplein 1, B-2610 17 Antwerpen, Belgium.4Department of Biology, 221 Morrill Science Center, University of Massachusetts, Amherst, MA 01003, USA.5Department of Organismic and Evolutionary Biology and Museum of Comparative Zoology, Harvard University, 26 Oxford Street, Cambridge, MA 02138, USA.
*Author for correspondence ([email protected])
A.L., 0065-7152; D.J.I., 3433-6576; J.B.L., 0000-0003-4712-8258; A.H., 0000-0003-0991-4434
Journal
of
Experimental
endurance capacity as this performance trait provides some advantage in dyadic encounters (Perry et al., 2004). Female lizards, by contrast, are often more cryptic and run shorter distances when confronted with a predator (Vanhooydonck et al., 2007). Finally, habitat use is also known to differ between male and femaleAnolislizards (Butler et al., 2000), and may consequently put different selective pressures on limb dimensions.
In this study, we investigate the proximate determinants of sprint speed inAnolislizards. We chose this genus because it is species rich and morphologically diverse, and because Anolis lizards occupy a diversity of ecological niches (Williams, 1983; Avila-Pires, 1995; Losos et al., 1998; Jackman et al., 1999; Pinto et al., 2008; Sanger et al., 2008; Nicholson et al., 2012; Pyron et al., 2013; Vitt and Caldwell, 2014). Specifically, we investigated whether muscle properties (mass, fiber length and physiological cross-sectional area) or hindlimb segment dimensions, or both, explain variation in sprint speed across species. We predict that the muscle cross-sectional area of the knee and ankle extensors will be directly related to an increase in sprint speed, as suggested by previous studies (Vanhooydonck et al., 2006a,b). Moreover, we test whether the relationships between morphology and performance are similar in male and female anoles. We predict that males will show stronger relationships between morphology and performance given the stronger selection for locomotor performance in males (Perry et al., 2004; Vanhooydonck et al., 2007; Husak et al., 2008).
MATERIALS AND METHODS Specimens
Dissection and muscle properties
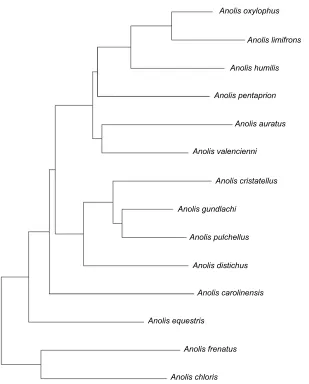
For each of the 14 species included in the analysis (see Fig. 1), we selected three individuals, representing both sexes, based on their availability (except for Anolis pentaprion, for which only one specimen was available for dissection, andAnolis oxylophus, for which only females were available). These specimens were housed at the collections of the Museum of Comparative Zoology at Harvard University (Table S1) and in the personal collection of A.H. (Muséum National d’Histoire Naturelle, Paris). Species were selected to represent a diversity of ecologies and morphologies. As the limb proportions are known to change during ontogeny (Carrier, 1995; Irschick, 2000), only adults were used in this study. Adults were identified as being reproductively active with fully developed gonads. For the analysis, the specimens selected for morphological analyses were stored in a 70% aqueous ethanol solution (see Table S2). Before dissection, each specimen was submerged in water for 15–20 min to rehydrate it. For all muscles, the nomenclature of Herrel et al. (2008) was used. Muscles were removed unilaterally on each specimen under a dissecting microscope (Wild M3Z, Wild Inc., Switzerland). Next, muscles were weighed using a digital microbalance (Mettler type AE100, Mettler-Toledo GmbH, Switzerland; precision: 0.0001 g). Muscle fiber lengths were obtained by submerging the muscles in a 30% nitric acid solution (HNO330%) for 24 h to dissolve all connective tissue. Muscle fibers
Anolis oxylophus
Anolis limifrons
Anolis humilis
Anolis pentaprion
Anolis auratus
Anolis valencienni
Anolis cristatellus
Anolis gundlachi
Anolis pulchellus
Anolis distichus
Anolis carolinensis
Anolis equestris
Anolis frenatus
[image:2.612.49.358.355.739.2]Anolis chloris
Fig. 1. Pruned phylogenetic tree, representing the relationship between the 14 species included in this study. Modified from Pyron et al. (2013) and Poe et al. (2017).
Journal
of
Experimental
were then put in a 50% glycerol solution and the average fiber length of each muscle was determined by drawing at least 10 fibers for every muscle (using a dissecting microscope with camera lucida attachment). Drawings were scanned and fiber lengths were quantified using ImageJ v 1.47 (Wayne Rasband, National Institutes of Health, USA). Next, we calculated the average length of the fibers for each muscle. Finally, the physiological cross-sectional area (PCSA) of each muscle was calculated as follows:
PCSA¼Mass=Muscular density
Fiber length ; ð1Þ
where mass was measured in g and fiber length in cm. A muscular density of 1.06 g cm−3 (Mendez and Keys, 1960) was used. Pennation angles were not included in the calculation of PCSA because they are generally shallow in limb muscles and consequently have only a minor impact on PCSA (Hartstone-Rose et al., 2012).
Limb dimensions
Limb dimensions were taken for 705 specimens belonging to 14 species ofAnolis(Fig. 1). We measured snout–vent length (SVL) as well as all hindlimb segment lengths as described in Herrel et al. (2008) (Fig. 2). SVL was measured from the tip of the snout to the posterior edge of the anal scale; tail length was measured from the posterior edge of the anal scale to the tip of the tail; femur length was measured from the axilla to the tip of the femur; tibia length was measured from the femoro-tibial joint to the tibia-metatarsus joint; metatarsus length was measured from the proximal-most part of the metatarsus to the base of the longest toe; longest toe length was measured from the base to the tip of the toe, not including the claw. All measurements were taken using digital callipers (Mitutoyo
CD-20DC, Japan; precision: 0.01 mm), and were taken on the left side of the specimens.
Sprint speed
In vivosprint speeds were measured in the field for 667 individuals
belonging to 14 species. Data for A. oxylophus Cope 1875,
Anolis humilisPeters 1863 andAnolis limifronsCope 1862 were
obtained at La Selva, Costa Rica, in 2008; data forAnolis frenatus
Cope 1899,Anolis auratusDaudin 1802 andA. pentaprionCope 1863 were obtained in Gamboa, Panama, in 2009; data forAnolis
chlorisBoulenger 1898 were obtained in Otongachi, Ecuador, in
2010; data for Anolis equestrisSchwartz and Garrido 1972 were obtained in Florida, USA, in 2003; data for Anolis carolinensis
Voigt 1832 were obtained near New Orleans, USA, in 2003; data for
Anolis cristatellus Duméril and Bibron 1837, Anolis gundlachi
Schwartz and Henderson 1991 andAnolis pulchellusDuméril and Bibron 1837 were obtained near El Yunque, Puerto Rico, in 2004; data forAnolis valencienniDuméril and Bibron 1837 were obtained at Discovery Bay in Jamaica in 2003; and data forAnolis distichus
(Cope 1861) were obtained near the Barahona peninsula in the Dominican Republic in 2004 (see also Vanhooydonck et al., 2006a, b). Data were collected during the reproductive season for all species. Only data for adult males and females were used so they could be compared to muscle data obtained through dissection for individuals of similar size (see Table S2). Gravid females were eliminated from the data set before calculating mean sprint speeds. We recorded the maximum sprint speeds in a field laboratory setting. Sprint speeds were measured by inducing a lizard to run up a 3 cm wide and 2 m long wooden dowel placed at an angle of 45 deg. For all running trials a similar wooden dowel providing good traction to the lizards was used. Pairs of photocells (Keyence FU12, Osaka, Japan) connected to a controller (Keyence KV 40RW/T2W Programmable logic controller) were set at 25 cm intervals. A portable computer recorded the times at which the lizard passed the cells. The lizard’s velocity over each 25 cm interval was then quantified. Lizards were encouraged to run by tapping the base of their tail. Three trials were conducted for each individual at hourly intervals, and the highest speed recorded over a 25 cm interval was taken as that individual’s maximum sprint speed. Sprint speeds were measured at ambient temperatures corresponding to the air temperatures in the shade at which we saw the lizards active (La Selva, Costa Rica: 27±0.5°C; Gamboa, Panama: 28.5±0.3°C; Otongachi, Ecuador: 23.4±0.3°C; Bogota, Colombia: 21.8±3.4°C; New Orleans, USA: 24.9±2.2°C; El Yunque, Puerto Rico: 24.9±1.1°C; Discovery Bay, Jamaica: 25.9±1.0°C). Only trials in which a lizard appeared to be moving at maximal capacity and scored as‘good’were retained for analysis.
Statistical analyses
All muscular, morphological and performance variables were logarithmically transformed (log10) before the analysis to fulfil assumptions of normality and homoscedasticity. All analyses were performed in R (http://www.R-project.org/). The significance threshold was set atα=0.05. We first grouped the 31 muscles into nine functional groups: femur protractors including the tensor aponeurosis communis, the pubofemoralis pars dorsalis (dorsal part+internus part) and the ischiofemoralis dorsalis anterior; femur retractors including the ischiofemoralis posterior and the caudofemoralis longus; femur adductors including the puboischiotibilais, the pubofibularis, the pubofemoralis pars ventralis, the ischiofemoralis anterior, the flexor tibialis externus, the flexor tibialis internus, the adductor femoris, the 1
2 3
[image:3.612.108.242.410.698.2]5 6 4
Fig. 2. Illustration of the measurements taken on the lizards.1, snout–vent length (SVL); 2, tail length; 3, femur length; 4, tibia length; 5, metatarsus
length; 6, longest toe length. Modified from Herrel et al. (2008).
Journal
of
Experimental
ilioischiofibularis, the iliofiburalis and the ilioischiotibialis; femur abductors including the iliofemoralis; knee extensors including the ambiens pars dorsalis, the ambiens pars ventralis, the femorotibialis ventralis and the femorotibialis dorsalis; the knee flexors including the puboischiotibialis, the flexor tibialis externus, the flexor tibialis internus, the iliofiburalis and the ilioischiotibialis; the ankle extensors including the gastrocnemius pars fibularis (pars major), the gastrocnemius pars fibularis (pars minor), the gastrocnemius pars profundus, the flexor digitorum communis, the extensor ossi metatarsi hallucis, the peroneus brevis and the peroneus longis; the ankle flexors including the tibialis anterior and the extensor digitorum longus; and others including the caudofemoralis brevis and the popliteus. Note that bi-articular muscles may figure in multiple functional groups as their actions impact the movement at several joints.
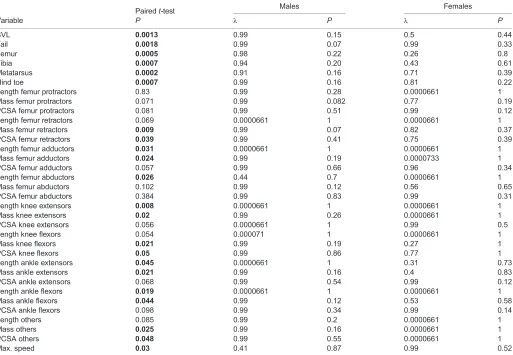
We first tested for dimorphism in these traits using paired-sample
t-tests on the log10-transformed means of the original variables. As sexual dimorphism was significant (Table 1; see also Butler and Losos, 2002; Herrel et al., 2006, 2007), we ran all subsequent analyses for males and females separately.
Species are not independent data points and as such phylogeny needs to be taken into account in the analyses (Felsenstein, 1985). The phylogenetic tree used in our analyses is based on Pyron et al. (2013) as it includes branch lengths. This tree was pruned to include only the species included in our study. AsA. pentaprionwas missing in Pyron et al. (2013) but is closely related toAnolis utilensisaccording to the
phylogeny of Poe et al. (2017), we replaced the A. utilensis by
A. pentaprionin our pruned tree. To estimate the phylogenetic signal
in the data, a univariate Pagel’sλwith the function‘phylosig’in the
‘phytools’library was calculated on the log-transformed means of the raw data for males and females separately (Revell, 2012). The higher theλ, the stronger the phylogenetic signal.
To investigate whether variation in limb dimensions and/or muscle characteristics explained variation in sprint speed, we ran a phylogenetic generalized least squares (PGLS) analysis with log10 sprint speed as the dependent variable and log10SVL, log10limb dimensions and the log10muscle data per functional group as the independent variables. Given that the overall analysis may suffer from low statistical power given the number of variables used, we ran subsequent PGLS analyses on each functional group and limb segment separately.
[image:4.612.52.565.372.727.2]To assess the correlation between the dimensions of proximal relative to distal parts of the limb on one hand, and sprint speed on the other hand, residuals were obtained from the PGLS regression of proximal to distal limb dimensions. Similarly, we calculated the residuals of a PGLS regression of the sum of proximal muscle masses on the sum of distal muscle masses. Next, we ran Pearson’s correlation tests between these residuals and the log10-transformed sprint speed. Finally, using paired-samplet-tests, we tested whether there are differences in the relative contributions of proximal to distal parts (segment lengths and muscles) between males and females.
Table 1. Summary table reporting the results of the analysis of sexual dimorphism (pairedt-test) and the phylogenetic signal (Pagel’s lambda) in the data
Pairedt-test Males Females
Variable P λ P λ P
SVL 0.0013 0.99 0.15 0.5 0.44
Tail 0.0018 0.99 0.07 0.99 0.33
Femur 0.0005 0.98 0.22 0.26 0.8
Tibia 0.0007 0.94 0.20 0.43 0.61
Metatarsus 0.0002 0.91 0.16 0.71 0.39
Hind toe 0.0007 0.99 0.16 0.81 0.22
Length femur protractors 0.83 0.99 0.28 0.0000661 1
Mass femur protractors 0.071 0.99 0.082 0.77 0.19
PCSA femur protractors 0.081 0.99 0.51 0.99 0.12
Length femur retractors 0.069 0.0000661 1 0.0000661 1
Mass femur retractors 0.009 0.99 0.07 0.82 0.37
PCSA femur retractors 0.039 0.99 0.41 0.75 0.39
Length femur adductors 0.031 0.0000661 1 0.0000661 1
Mass femur adductors 0.024 0.99 0.19 0.0000733 1
PCSA femur adductors 0.057 0.99 0.66 0.96 0.34
Length femur abductors 0.026 0.44 0.7 0.0000661 1
Mass femur abductors 0.102 0.99 0.12 0.56 0.65
PCSA femur abductors 0.384 0.99 0.83 0.99 0.31
Length knee extensors 0.008 0.0000661 1 0.0000661 1
Mass knee extensors 0.02 0.99 0.26 0.0000661 1
PCSA knee extensors 0.056 0.0000661 1 0.99 0.5
Length knee flexors 0.054 0.000071 1 0.0000661 1
Mass knee flexors 0.021 0.99 0.19 0.27 1
PCSA knee flexors 0.05 0.99 0.86 0.77 1
Length ankle extensors 0.045 0.0000661 1 0.31 0.73
Mass ankle extensors 0.021 0.99 0.16 0.4 0.83
PCSA ankle extensors 0.068 0.99 0.54 0.99 0.12
Length ankle flexors 0.019 0.0000661 1 0.0000661 1
Mass ankle flexors 0.044 0.99 0.12 0.53 0.58
PCSA ankle flexors 0.098 0.99 0.34 0.99 0.14
Length others 0.085 0.99 0.2 0.0000661 1
Mass others 0.025 0.99 0.16 0.0000661 1
PCSA others 0.048 0.99 0.55 0.0000661 1
Max. speed 0.03 0.41 0.87 0.99 0.52
PCSA, physiological cross-sectional area; SVL, snout–vent length. Bold indicates significant differences between males and females (P≤0.05).
Journal
of
Experimental
As the maximum sprint speed of large anoles could be underestimated on a 3 cm dowel (see Losos and Sinervo, 1989), we regressed the decrease in sprint speed on a 3 cm dowel relative to a 4.6 cm dowel on limb length (based on the data presented in the Losos and Sinervo, 1989 paper) and used it to correct our maximal sprint speeds for males. Note that we ran this analysis for males only as the data in the Losos and Sinervo (1989) paper pertain to males only.
RESULTS
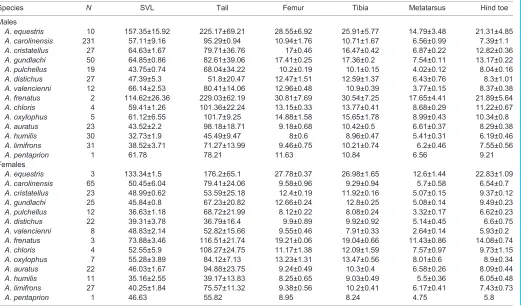
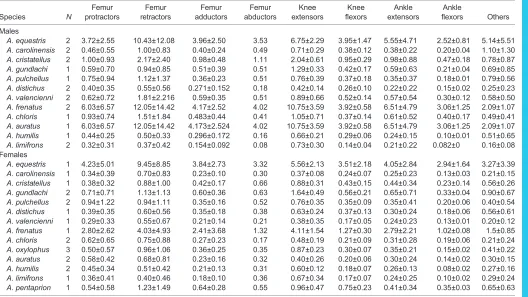
Quantitative data on sprint speeds, limb dimensions, muscle masses, fiber lengths and PCSA for males and females are provided in Tables 2–6. Of the 34 variables examined, 22 were significantly different between males and females (Table 1). Residuals of
regressions of proximal to distal segment lengths and muscle masses were not significantly different between males and females (Table S3). No phylogenetic signal was observed in our data, neither for males nor for females (allP>0.05; Table 1).
Determinants of sprint speed
Males
The PGLS analysis performed on the log10 SVL, log10 limb dimensions and the log10 muscle data showed that variation in overall muscle mass (F1,10=8.97,P=0.018) and SVL (F1,10=9.18,
P=0.014) explains variation in sprint speed in maleAnolis(Table 7). The subsequent analyses performed on the limb segment data and the muscle properties showed that femur length (F1,10=10,
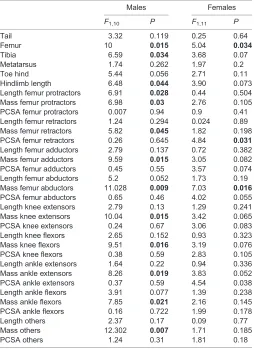
P=0.015), tibia length (F1,10=6.59,P=0.034) and overall hindlimb length (F1,10=6.48,P=0.044) are significant determinants of sprint speed in maleAnolis. In addition, muscle masses and the muscle fiber length of the femur protractors explained variation in sprint speed across males (Table 8). No correlations were found between the ratios of proximal to distal limb dimensions and muscles masses (Table S4). The regression of the decrease in sprint speed on limb length in males based on the data in Losos and Sinervo (1989) was not significant (P=0.11), likely due to the small number of species included in that data set. However, using the regression equation we corrected the maximal speeds in males and reanalyzed our data. When using the correction for speed, tibia length and hindlimb length are no longer significant predictors (Table S5). All other results remained the same.
Females
[image:5.612.48.300.69.236.2]The PGLS analysis performed on the log10 SVL, log10 limb dimensions and the log10 muscle data showed that there are Table 2. Sprint speed (means±s.d. in cm s−1)
Species
Males Females
N Speed N Speed
A. equestris 6 129±10 – –
A. carolinensis 231 141.53±25.77 65 136.96±15.06 A. cristatellus 27 113.09±6.75 23 112.02±6.21
A. gundlachi 50 127.77±6.21 25 81±6.68
A. pulchellus 19 71.59±5.68 12 64.29±8.05 A. distichus 23 51.77±22.38 14 48.48±21.02
A. valencienni 10 94±7 8 46.59±5.64
A. frenatus 2 191.76±50.22 3 135.23±5.17
A. chloris 4 79.56±16.1 4 51.68±11.39
A. oxylophus 5 74.82±19.69 5 67.79±14.85
A. auratus 22 30.97±13.14 21 39.58±16.34
A. humilis 25 62.6±19.12 9 69.02±14.34
A. limifrons 28 47.07±9.01 24 44.45±9.69
[image:5.612.51.572.431.737.2]A. pentaprion 1 73.53 1 52.08
Table 3. Morphometrics of the specimens caught in the field (means±s.d. in mm)
Species N SVL Tail Femur Tibia Metatarsus Hind toe
Males
A. equestris 10 157.35±15.92 225.17±69.21 28.55±6.92 25.91±5.77 14.79±3.48 21.31±4.85 A. carolinensis 231 57.11±9.16 95.29±0.94 10.94±1.76 10.71±1.67 6.56±0.99 7.39±1.1
A. cristatellus 27 64.63±1.67 79.71±36.76 17±0.46 16.47±0.42 6.87±0.22 12.82±0.36
A. gundlachi 50 64.85±0.86 82.61±39.06 17.41±0.25 17.36±0.2 7.54±0.11 13.17±0.22
A. pulchellus 19 43.75±0.74 68.04±34.22 10.2±0.19 10.1±0.15 4.02±0.12 8.04±0.16
A. distichus 27 47.39±5.3 51.8±20.47 12.47±1.51 12.59±1.37 6.43±0.76 8.3±1.01
A. valencienni 12 66.14±2.53 80.41±14.06 12.96±0.48 10.9±0.39 3.77±0.15 8.37±0.38
A. frenatus 2 114.62±26.36 229.03±62.19 30.81±7.69 30.54±7.25 17.65±4.41 21.89±5.64
A. chloris 4 59.41±1.26 101.36±22.24 13.15±0.33 13.77±0.41 8.68±0.29 11.22±0.67
A. oxylophus 5 61.12±6.55 101.7±9.25 14.88±1.58 15.65±1.78 8.99±0.43 10.34±0.8
A. auratus 23 43.52±2.2 98.18±18.71 9.18±0.68 10.42±0.5 6.61±0.37 8.29±0.38
A. humilis 30 32.73±1.9 45.49±9.47 8±0.6 8.96±0.47 5.41±0.31 6.19±0.46
A. limifrons 31 38.52±3.71 71.27±13.99 9.46±0.75 10.21±0.74 6.2±0.46 7.55±0.56
A. pentaprion 1 61.78 78.21 11.63 10.84 6.56 9.21
Females
A. equestris 3 133.34±1.5 176.2±65.1 27.78±0.37 26.98±1.65 12.6±1.44 22.83±1.09
A. carolinensis 65 50.45±6.04 79.41±24.06 9.58±0.96 9.29±0.94 5.7±0.58 6.54±0.7
A. cristatellus 23 48.99±0.62 53.59±25.18 12.4±0.19 11.92±0.16 5.07±0.15 9.37±0.12
A. gundlachi 25 45.84±0.8 67.23±20.82 12.66±0.24 12.8±0.25 5.08±0.14 9.49±0.23
A. pulchellus 12 36.63±1.18 68.72±21.99 8.12±0.22 8.08±0.24 3.32±0.17 6.62±0.23
A. distichus 22 39.31±3.78 36.79±16.4 9.9±0.89 9.92±0.92 5.14±0.45 6.6±0.75
A. valencienni 8 48.83±2.14 52.82±15.66 9.55±0.46 7.91±0.33 2.64±0.14 5.93±0.2
A. frenatus 3 73.88±3.46 116.51±21.74 19.21±0.06 19.04±0.66 11.43±0.86 14.08±0.74
A. chloris 4 52.55±5.9 108.27±24.75 11.17±1.38 12.09±1.59 7.57±0.97 9.73±1.15
A. oxylophus 7 55.28±3.89 84.12±7.13 13.23±1.31 13.47±0.56 8.01±0.6 8.9±0.34
A. auratus 22 46.03±1.67 94.88±23.75 9.24±0.49 10.3±0.4 6.58±0.26 8.09±0.44
A. humilis 11 35.16±2.55 39.17±13.83 8.25±0.65 9.03±0.49 5.5±0.36 6.05±0.48
A. limifrons 27 40.25±1.84 75.57±11.32 9.38±0.56 10.2±0.41 6.17±0.41 7.43±0.73
A. pentaprion 1 46.63 55.82 8.95 8.24 4.75 5.8
Journal
of
Experimental
no significant global determinants of sprint speed. The subsequent analyses performed on limb segments, hindlimb length and the muscle properties separately showed that only
[image:6.612.50.578.69.366.2]femur length, the PCSA of the femur retractors and mass of the femur abductors are significant determinants of sprint speed in females (Table 8). No correlations were found between the ratios Table 4. Muscle fiber length (means±s.d. in mm)
Species N
Femur protractors
Femur retractors
Femur adductors
Femur abductors
Knee extensors
Knee flexors
Ankle extensors
Ankle
flexors Others
Males
A. equestris 2 6.98±3.52 15.42±12.02 16.69±6.33 80.342 11.47±2.36 21.65±3.13 5.87±1.71 15.04±1.52 7.44±4.89 A. carolinensis 2 3.02±1.68 11.52±13.35 9.22±3.63 38.189 5.93±1.66 11.17±1.58 3.79±0.94 7.54±1.52 3.63±2.59 A. cristatellus 2 3.49±2.12 7.16±5.88 8.07±2.99 29.029 6.12±1.08 9.57±2.29 4.30±0.87 7.12±2.14 3.43±1.61 A. gundlachi 1 3.74±2.78 8.85±7.88 11.27±4.71 42.732 7.06±1.84 13.70±3.55 4.10±1.63 9.38±2.80 4.16±3.00 A. pulchellus 1 2.24±1.21 4.68±3.97 3.99±1.33 15.729 2.99±0.71 4.61±1.00 2.29±0.72 3.49±0.10 3.11±2.12 A. distichus 2 2.42±1.42 7.65±6.53 8.35±2.89 31.083 5.81±1.34 10.08±2.21 3.73±1.28 5.93±0.71 3.96±3.5 A. valencienni 2 2.65±1.50 5.32±4.23 5.86±2.02 24.115 4.41±1.93 7.02±1.13 2.19±0.55 4.78±0.58 3.04±2.82 A. frenatus 2 4.77±1.35 10.87±10.66 11.43±4.92 62.636 6.68±1.17 14.10±3.48 3.65±1.26 7.67±1.75 8.37±9.39 A. chloris 1 2.17±1.25 6.13±6.07 6.37±2.57 29.952 3.29±1.11 8.09±1.52 1.85±0.82 3.67±1.09 2.52±2.26 A. auratus 1 2.63±1.48 10.89±11.78 8.70±2.76 26.978 6.17±1.98 10.35±1.96 3.82±0.94 6.65±1.37 3.60±3.72 A. humilis 1 1.43±0.87 4.46±4.79 3.61±1.29 2.327 3.29±0.57 3.86±1.00 2.16±0.69 3.73±0.44 1.19±0.52 A. limifrons 2 1.43±0.80 4.95±5.16 4.02±1.78 24.248 2.62±0.62 4.90±1.38 1.61±0.64 3.16±0.41 1.89±2.03 Females
A. equestris 1 6.50±4.05 13.10±14.75 13.24±5.71 83.17 9.70±2.06 16.93±3.66 5.55±1.22 8.87±2.38 6.80±6.09 A. carolinensis 1 2.25±1.48 4.53±3.87 4.91±1.84 22.148 3.81±0.78 5.89±1.44 2.10±0.81 4.72±0.60 2.53±2.30 A. cristatellus 1 3.62±2.33 6.04±4.81 7.18±2.73 2.416 5.78±1.28 8.30±2.00 3.69±0.92 5.92±1.01 2.42±2.34 A. gundlachi 2 3.96±2.78 8.03±6.90 10.52±4.03 44.832 6.93±1.28 12.80±2.65 5.31±2.12 7.55±0.04 3.45±3.64 A. pulchellus 2 1.88±0.99 5.45±5.12 3.93±1.79 15.477 2.93±0.66 4.86±1.97 2.48±0.85 3.11±0.60 2.67±0.66 A. distichus 1 3.37±2.09 7.69±6.40 8.88±3.62 34.468 6.03±1.35 10.17±3.77 3.44±1.31 6.84±0.93 2.46±1.48 A. valencienni 1 1.97±0.76 5.59±4.32 5.12±2.16 13.382 3.55±0.93 6.71±1.40 1.86±0.55 3.26±0.26 3.77±4.18 A. frenatus 1 2.20±1.04 9.34±9.26 8.30±4.01 40.614 5.40±0.76 11.29±2.01 2.66±0.82 6.05±0.15 3.28±2.85 A. chloris 2 2.61±1.13 5.43±5.55 5.05±2.00 21.842 3.13±0.76 5.87±1.03 1.75±0.80 3.73±0.89 2.60±1.81 A. oxylophus 3 2.93±1.83 5.39±4.87 6.53±2.31 27.778 3.87±0.78 7.61±1.72 2.79±0.66 5.18±0.66 2.63±2.33 A. auratus 2 3.33±1.96 9.19±9.02 7.47±2.33 30.587 5.29±1.12 8.32±1.16 3.05±1.07 5.13±0.26 3.96±3.83 A. humilis 2 2.04±1.33 3.61±2.95 4.14±1.40 15.20 2.89±0.64 4.84±0.84 1.47±0.43 3.22±0.26 1.63±1.67 A. limifrons 1 1.67±1.06 4.69±4.83 3.96±1.68 0.78 2.52±0.25 4.81±1.61 1.54±0.69 3.94±0.76 1.34±1.32 A. pentaprion 1 2.06±1.20 6.32±5.95 4.30±1.52 1.88 3.06±1.00 4.81±1.36 1.99±0.57 3.38±0.44 2.74±2.60
Table 5. Muscle mass (means±s.d. in mg)
Species N
Femur protractors
Femur retractors
Femur adductors
Femur abductors
Knee extensors
Knee flexors
Ankle extensors
Ankle
flexors Others
Males
A. equestris 2 32.9±33.1 247.4±330.3 70±46.8 30.1 80.9±23.6 93.2±45.6 33±23.7 39.5±8.8 54.8±70.1
A. carolinensis 2 2±3 18.1±24.3 3.6±1.9 2 4.4±1.7 4.5±1.9 1.6±1.2 1.5±0 6±8
A. cristatellus 2 4.6±5.3 23.9±31.7 8.2±4.6 3.4 13.4±4.7 9.7±4 4.5±3.7 3.3±0.3 3.6±4.5 A. gundlachi 1 3.6±5.4 12.4±15.8 5.4±3.3 2.3 9.6±3.8 6.3±3.5 2.4±2.1 2.1±0.2 4.4±5.9 A. pulchellus 1 1.7±2.2 8.8±12 1.2±0.6 0.7 2.3±0.8 1.4±0.6 0.8±0.6 0.6±0.1 1.2±1.6
A. distichus 2 1.3±1.6 6.4±8.3 2.2±1.2 0.6 2.6±1.1 2.7±1.2 0.8±0.6 0.9±0 1.5±1.9
A. valencienni 2 2±2.6 15.2±20.6 3.4±1.6 1.3 3.7±1.8 3.9±1.2 1.3±1.2 1.5±0.4 2.6±3.3 A. frenatus 2 36±42.9 220.3±302.3 46.8±24.6 26.7 75.2±23 58.8±17.9 26.1±20.7 23.7±4.5 23.9±30.3 A. chloris 1 2.7±3.1 15.7±21.6 2.8±1.5 1.3 3.4±1.7 3.1±1.4 1.2±1.1 1.5±0.2 1.8±2.3
A. auratus 1 1.9±2 13±17.9 1.9±1 0.9 2.5±1.4 2.2±0.8 1.1±0.8 1±0.1 1.5±1.8
A. humilis 1 0.8±0.9 3.2±4.1 1.1±0.5 0.4 2.4±0.9 1.2±0.5 0.5±0.3 0.4±0 0.8±1.1
A. limifrons 2 0.6±0.7 3.1±4.2 0.6±0.3 0.2 2±1.1 0.7±0.2 0.3±0.3 0.3±0 0.4±0.5
Females
A. equestris 1 28.9±33 200.4±270.6 48.1±31.3 29.3±0 55.8±18.3 60±30.3 23.7±15.9 25.6±8 34.5±45.5 A. carolinensis 1 0.9±1.4 5.1±6.9 1.2±0.7 0.7±0 1.5±0.5 1.5±0.7 0.5±0.5 0.7±0.1 0.8±0.9 A. cristatellus 1 1.9±2.3 8.2±10.9 3.2±1.7 1.7±0 5.3±1.9 3.9±1.7 1.7±1.4 1.4±0.6 1.8±2.1 A. gundlachi 2 4.1±5.7 13.7±17.8 6.5±3.8 3±0 12±4.5 7.8±3.8 3.2±2.8 2.7±0.3 4.6±5.9 A. pulchellus 2 2.1±2.8 8.5±11.5 1.5±0.8 0.9±0 2.3±0.9 1.8±0.7 0.8±0.8 0.7±0.1 1.3±1.8
A. distichus 1 1.8±2.2 6.8±8.6 3.1±1.8 1.4±0 4.1±1.8 3.9±2 1±0.7 1.3±0.3 2±2.5
A. valencienni 1 0.7±0.8 4.8±6.5 1.1±0.6 0.3±0 1.2±0.8 1.2±0.3 0.4±0.3 0.5±0.1 1.1±1.3 A. frenatus 1 8±8.7 64.1±88.3 12.7±6.4 5.7±0 23.2±7.5 15.4±5.3 7.5±5.2 6.6±0.4 6.5±7.5
A. chloris 2 1.9±2 6.9±9.4 1.2±0.7 0.4±0 1.6±0.6 1.3±0.6 0.6±0.5 0.7±0.1 0.8±1.1
A. oxylophus 3 2±2.6 8.2±11 2.2±1.1 1±0 3.6±1.2 2.4±0.7 1.1±0.7 0.8±0 1.4±1.6
A. auratus 2 1.3±1.1 9.8±13.4 1.4±0.8 0.3±0 2.1±1 1.5±0.8 1±0.8 1±0.1 0.8±1.1
A. humilis 2 1±0.9 2.6±3.2 0.9±0.4 0.5±0 1.9±0.7 0.9±0.5 0.4±0.2 0.3±0 0.6±0.8
A. limifrons 1 0.7±0.9 3.2±4.3 0.7±0.3 0.3±0 1.8±1 0.8±0.3 0.3±0.3 0.4±0 0.6±0.7
A. pentaprion 1 1.2±1.3 13±17.7 2.9±1.3 1.1±0 3.2±1.7 3.5±0.3 1±0.9 1.3±0.1 2.8±3.6
Journal
of
Experimental
[image:6.612.57.563.438.737.2]of proximal to distal limb dimensions and muscle masses (Table S4).
DISCUSSION Sexual dimorphism
In accordance with previous studies (e.g. Butler et al., 2000; Butler and Losos, 2002; Losos et al., 2003; Irschick et al., 2005; Herrel et al., 2006, 2007; Butler, 2007), our results demonstrate significant sexual dimorphism across the 14 species ofAnolisincluded in this study. Sexual dimorphism exists for both sprint speed, and for several limb segment lengths and muscle size and architecture. A potential explanation for the larger muscles in male anoles and their higher sprint speeds could be that, in some species such as trunk-ground anoles, males have to defend territories, thus putting stronger selection on sprint speed compared with females (Stamps et al., 1997; Perry et al., 2004; Lailvaux and Irschick, 2007). Male lizards are also more conspicuous than females, which rely more on crypsis than running when confronted with potential predators (Vanhooydonck et al., 2007). Thus, unlike females, males may benefit from a greater power output and greater sprint performance, resulting in the observed differences between sexes. These differences have important implications for comparative and evolutionary studies as male and female lizards appear to be divergent and under different selective pressures. Consequently, the inclusion of both sexes is needed in comparative studies in order to understand the evolution of limb morphology or locomotor performance in Anolis and likely other lizards. Why the morphological drivers of sprint speed are different in males and females remains an open question, however. One possibility is that females were less motivated to run given that they rely less on sprinting for predator escape. If so, this could lead to an underestimate of peak speeds in females, rendering the associations
[image:7.612.49.577.69.366.2]between morphology and speed less clear. However, given that both males and females were actively chased up the race track and that only the single fastest 25 cm run out of the 24 was used, we think this unlikely. As an alternative hypothesis, male lizards may have larger muscles and faster running speeds not as a result of selection on sprint speedper se but as a result of sexual selection on the accelerations and high grappling moments needed when fighting with other males (Pasi and Carrier, 2003; Morris and Carrier, 2016). This would be consistent with the lack of a correlation between sprint speed and the ratio of proximal and distal limb element masses. Indeed, strong distal limb elements can be expected to be beneficial when fighting. Fighting in anoles typically involves head locking followed by an intense phase where males try to push each other of the branch (Lailvaux et al., 2004). During these types of interactions, stability and the ability to hold on to a branch are critical and likely facilitated by strong distal limb elements. The greater sprint speeds observed in males may then only be an Table 6. Physiological cross-sectional area (means±s.d. in mm²)
Species N
Femur protractors
Femur retractors
Femur adductors
Femur abductors
Knee extensors
Knee flexors
Ankle extensors
Ankle
flexors Others
Males
A. equestris 2 3.72±2.55 10.43±12.08 3.96±2.50 3.53 6.75±2.29 3.95±1.47 5.55±4.71 2.52±0.81 5.14±5.51 A. carolinensis 2 0.46±0.55 1.00±0.83 0.40±0.24 0.49 0.71±0.29 0.38±0.12 0.38±0.22 0.20±0.04 1.10±1.30 A. cristatellus 2 1.00±0.93 2.17±2.40 0.98±0.48 1.11 2.04±0.61 0.95±0.29 0.98±0.88 0.47±0.18 0.78±0.87 A. gundlachi 1 0.59±0.70 0.94±0.85 0.51±0.39 0.51 1.29±0.33 0.42±0.17 0.59±0.63 0.21±0.04 0.69±0.85 A. pulchellus 1 0.75±0.94 1.12±1.37 0.36±0.23 0.51 0.76±0.39 0.37±0.18 0.35±0.37 0.18±0.01 0.79±0.56 A. distichus 2 0.40±0.35 0.55±0.56 0.271±0.152 0.18 0.42±0.14 0.26±0.10 0.22±0.22 0.15±0.02 0.25±0.23 A. valencienni 2 0.62±0.72 1.81±2.216 0.59±0.35 0.51 0.89±0.66 0.52±0.14 0.57±0.54 0.30±0.12 0.58±0.50 A. frenatus 2 6.03±6.57 12.05±14.42 4.17±2.52 4.02 10.75±3.59 3.92±0.58 6.51±4.79 3.06±1.25 2.09±1.07 A. chloris 1 0.93±0.74 1.51±1.84 0.483±0.44 0.41 1.05±0.71 0.37±0.14 0.61±0.52 0.40±0.17 0.49±0.41 A. auratus 1 6.03±6.57 12.05±14.42 4.173±2.524 4.02 10.75±3.59 3.92±0.58 6.51±4.79 3.06±1.25 2.09±1.07 A. humilis 1 0.44±0.25 0.50±0.33 0.296±0.172 0.16 0.66±0.21 0.29±0.06 0.24±0.15 0.10±0.01 0.51±0.65 A. limifrons 2 0.32±0.31 0.37±0.42 0.154±0.092 0.08 0.73±0.30 0.14±0.04 0.21±0.22 0.082±0 0.16±0.08 Females
A. equestris 1 4.23±5.01 9.45±8.85 3.84±2.73 3.32 5.56±2.13 3.51±2.18 4.05±2.84 2.94±1.64 3.27±3.39 A. carolinensis 1 0.34±0.39 0.70±0.83 0.23±0.10 0.30 0.37±0.08 0.24±0.07 0.25±0.23 0.13±0.03 0.21±0.15 A. cristatellus 1 0.38±0.32 0.88±1.00 0.42±0.17 0.66 0.88±0.31 0.43±0.15 0.44±0.34 0.23±0.14 0.56±0.26 A. gundlachi 2 0.71±0.71 1.13±1.13 0.60±0.36 0.63 1.64±0.49 0.56±0.21 0.65±0.71 0.33±0.04 0.90±0.67 A. pulchellus 2 0.94±1.22 0.94±1.11 0.35±0.16 0.52 0.76±0.35 0.35±0.09 0.35±0.41 0.20±0.06 0.40±0.54 A. distichus 1 0.39±0.35 0.60±0.56 0.35±0.18 0.38 0.63±0.24 0.37±0.13 0.30±0.24 0.18±0.06 0.56±0.61 A. valencienni 1 0.29±0.33 0.55±0.67 0.21±0.14 0.21 0.38±0.35 0.17±0.05 0.24±0.23 0.13±0.01 0.20±0.12 A. frenatus 1 2.80±2.62 4.03±4.93 2.41±3.68 1.32 4.11±1.54 1.27±0.30 2.79±2.21 1.02±0.08 1.5±0.85 A. chloris 2 0.62±0.65 0.75±0.88 0.27±0.23 0.17 0.48±0.19 0.21±0.09 0.31±0.28 0.19±0.06 0.21±0.24 A. oxylophus 3 0.50±0.57 0.96±1.06 0.36±0.25 0.35 0.87±0.23 0.30±0.07 0.35±0.21 0.15±0.02 0.41±0.22 A. auratus 2 0.58±0.42 0.68±0.81 0.23±0.16 0.32 0.40±0.26 0.20±0.06 0.30±0.24 0.14±0.02 0.30±0.15 A. humilis 2 0.45±0.34 0.51±0.42 0.21±0.13 0.31 0.60±0.12 0.18±0.07 0.26±0.13 0.08±0.02 0.27±0.16 A. limifrons 1 0.36±0.41 0.40±0.46 0.18±0.10 0.36 0.67±0.34 0.17±0.07 0.24±0.25 0.10±0.02 0.29±0.24 A. pentaprion 1 0.54±0.58 1.23±1.49 0.64±0.28 0.55 0.96±0.47 0.75±0.23 0.41±0.34 0.35±0.03 0.65±0.63
Table 7. Results of the phylogenetic generalized least squares (PGLS) analyses performed on the log10-transformed limb segment data
with the log10maximal sprint speed as the dependent variable
Males Females
F1,10 P F1,11 P
SVL 9.18 0.014 4.39 0.052
Limb segments 4.7 0.058 2.15 0.124
Mass 8.97 0.018 3.23 0.071
Muscle fiber length 3.13 0.106 1 0.309
PCSA 0.39 0.59 2.96 0.075
Mass+length+PCSA 3.94 0.059 3.02 0.062
Bold indicates significant differences (P≤0.05).
Journal
of
Experimental
[image:7.612.313.566.638.728.2]epiphenomenon of selection on fighting ability. This remains to be tested, however.
Proximate drivers of sprint speed
Body size (SVL) appears to be a good predictor of maximal sprint speed in males, consistent with prior work on anoles and other lizards (e.g. Garland and Losos, 1994; Irschick and Jayne, 1998; Van Damme and Vanhooydonck, 2001; Vanhooydonck et al., 2002). However, independent of overall size, limb length or limb segment lengths may drive variation in sprint speed. Indeed, as suggested by Hildebrand (1974) (see also Garland and Losos, 1994; Bauwens et al., 1995; Bonine and Garland, 1999), longer legs should allow the animal to take greater strides and increase maximal speed for a given stride frequency. Specific limb segment lengths may also drive variation in sprint speed. As previously shown, the length of the tibia (Vanhooydonck et al., 2006a,b) or the foot (Miles, 1994; Fieler and Jayne, 1998; Irschick and Jayne, 1999) can be important drivers of sprint speed. Our analyses focusing on limb segment lengths show that the femur length is the principal driver of maximal sprint speed for both males and females. These findings corroborate the results of Vanhooydonck and coworkers (2006a,b) in showing that longer limbs enhance sprint speed. Our results also showed that tibia length likely plays an important role in driving variation in sprint speed in males, but not females.
Previous studies on lizards suggested that only specific muscle groups contribute to the generation of force during sprinting.
Indeed, inSceloporus clarkii, only the femur retractors, the knee extensors and the plantar flexors appear to contribute to propulsion (Reilly, 1995). In another comparative study including four iguanid and two agamid lizard species, the femorotibialis, a knee extensor, was suggested to provide the main propulsive force to move the body forward (Snyder, 1954). More recently, Vanhooydonck and coworkers (2006a,b) found that the mass of knee extensors was the best predictor of sprint speed across a sample ofAnolislizards. Our results showed that the overall muscle mass of the nine functional groups is the best predictor of sprint speed in males, yet none of the muscle groups per se were good predictors. As highlighted by James et al. (2007), heavier muscles provide more power output and consequently may provide greater propulsive force. Our results corroborate this hypothesis, as larger muscles are directly linked to an increased sprint performance in male anoles. However, for females, only the mass of the femur abductors appears to drive variation in maximal speed. Although counterintuitive at first, femoral abduction plays an important role in disengaging the limb from the substrate and the initiation of the swing phase. One possible explanation for the fact that this result was specifically observed in females and not males is that females have wider bodies. Consequently, females may need to abduct the femur further in order to initiate the forward movement of the leg without interfering with the body. This hypothesis could be tested by recording and analyzing high-speed videos of locomotion in male and female anoles.
With the exception of the length of the fibers of the femur protractors in males and the PCSA of the femur retractors in females, muscle architecture did not seem to be a good overall predictor of sprint speed. The longer fiber lengths of the limb protractors may provide males with faster limb protraction during the swing phase and thus may result in an increase of stride frequency (Weyand et al., 2000). The greater PCSA of the femur retractors allows for a more forceful limb retraction during the stance phase and thus greater ground reaction forces, often thought to be the principal determinant of running speed (Weyand et al., 2010; Seitz et al., 2014). Interestingly, features of the hindlimb muscles that affect both swing and stance phases are affected, suggesting multiple solutions for the same functional problem.
Limitations of the study
[image:8.612.48.302.79.428.2]One of the possible limitations of the study that may explain the few significant associations between morphology and sprint speed is that we used only a single dowel diameter that was relatively narrow for species with the longest limbs. Indeed, Losos and Sinervo (1989) showed that long-legged species suffer from a reduction in sprint speed on narrow dowels. For species likeA. gundlachi, for example, sprinting on a 3 cm dowel as used in our study reduced its maximal speed to roughly 73±1.5% of its peak sprint speed on the widest dowel tested. A comparison with the published data in Losos and Sinervo (1989) shows that the sprint speeds for the species as reported here match closely the sprint speeds reported in that paper. This would then imply that we may have underestimated the speeds in species with long hindlimbs, reducing the explanatory power of our morphological variables in predicting sprint speed. However, when we corrected our data using the quantitative data presented in the Losos and Sinervo (1989) paper, results remained largely unchanged. The only difference was that tibia length and SVL were no longer predictors of sprint speed. However, clearly, additional quantitative studies on the relation between perch diameter and sprint speed should be performed, allowing us to fine tune the corrections used. Moreover, data on the effect of Table 8. PGLS analyses testing for the effect of the different variables on
maximal sprint speed
Males Females
F1,10 P F1,11 P
Tail 3.32 0.119 0.25 0.64
Femur 10 0.015 5.04 0.034
Tibia 6.59 0.034 3.68 0.07
Metatarsus 1.74 0.262 1.97 0.2
Toe hind 5.44 0.056 2.71 0.11
Hindlimb length 6.48 0.044 3.90 0.073 Length femur protractors 6.91 0.028 0.44 0.504 Mass femur protractors 6.98 0.03 2.76 0.105 PCSA femur protractors 0.007 0.94 0.9 0.41 Length femur retractors 1.24 0.294 0.024 0.89 Mass femur retractors 5.82 0.045 1.82 0.198 PCSA femur retractors 0.26 0.645 4.84 0.031 Length femur adductors 2.79 0.137 0.72 0.382 Mass femur adductors 9.59 0.015 3.05 0.082 PCSA femur adductors 0.45 0.55 3.57 0.074 Length femur abductors 5.2 0.052 1.73 0.19 Mass femur abductors 11.028 0.009 7.03 0.016 PCSA femur abductors 0.65 0.46 4.02 0.055 Length knee extensors 2.79 0.13 1.29 0.241 Mass knee extensors 10.04 0.015 3.42 0.065 PCSA knee extensors 0.24 0.67 3.06 0.083 Length knee flexors 2.65 0.152 0.93 0.323 Mass knee flexors 9.51 0.016 3.19 0.076 PCSA knee flexors 0.38 0.59 2.83 0.105 Length ankle extensors 1.64 0.22 0.94 0.336 Mass ankle extensors 8.26 0.019 3.83 0.052 PCSA ankle extensors 0.37 0.59 4.54 0.038 Length ankle flexors 3.91 0.077 1.39 0.238 Mass ankle flexors 7.85 0.021 2.16 0.145 PCSA ankle flexors 0.16 0.722 1.99 0.178
Length others 2.37 0.17 0.09 0.77
Mass others 12.302 0.007 1.71 0.185
PCSA others 1.24 0.31 1.81 0.18
Bold indicates significant differences (P≤0.05).
Journal
of
Experimental
perch diameter on sprint speed in females are completely lacking and are needed.
Another limitation of the study is that we only investigated sprint speed and did not calculate acceleration capacity. Acceleration capacity has been shown to be an important trait inAnolislizards (Vanhooydonck et al., 2006a,b). However, in a previous study (Vanhooydonck et al., 2006a) it was shown that acceleration and sprint speed are correlated with one another and, moreover, correlated with the same muscles (knee extensors), suggesting that muscular traits driving variation in sprint speed should also drive variation in acceleration capacity. However, limb length segments were shown to be important only in driving variation in sprint speed in that study (Vanhooydonck et al., 2006a).
Conclusion
In accordance with previous studies, sexual dimorphism was observed across the 14 Anolis species included in the present study. In both males and females, femur length appears to be a good predictor of maximal sprint speed. Moreover, in males, SVL and overall muscle mass appear to be good predictors of sprint speed. Few significant differences were found for muscle architecture, which suggests that overall changes in muscles size, rather than in muscle architecture, are selected for to increase sprint speed.
Acknowledgements
We thank Dave Carrier and one anonymous reviewer for providing constructive and helpful comments on previous versions of the manuscript. We thank JoséRosado from the Museum of Comparative Zoology at Harvard University for loaning us specimens and allowing us to dissect them. We thank Raoul Van Damme and Peter Aerts from the FunMorph lab at the University of Antwerp, Belgium for allowing us to use their race track. We thank the staff at La Selva, and the Discovery Bay Marine lab, for their help and for their hospitality during our stay; and M. Sasa, Omar Torres-Carvajal, and the Colombian, Costa Rican, Ecuadorian, Jamaican, Panamanian, Puerto Rican and US governments for expediting our research permits and allowing us to conduct this study. We also thank F. Ayala, E. Boada, S. Campbell-Staton, K. Crandell, K. Fenstermacher, H.-K. Frank, A. Marmol, P. Endera, J. Meyers, S. Montuelle, M. Muñoz and P. Van Middlesworth for help in the field. The authors also thank A-C. Fabre for helpful discussions on the manuscript.
Competing interests
The authors declare no competing or financial interests.
Author contributions
Conceptualization: A.H., J.B.L.; Formal analysis: A.L., A.H.; Investigation: E.G., A.H.; Resources: E.G., B.V., D.J.I., J.B.L., A.H.; Writing - original draft: A.L., A.H.; Writing - review & editing: E.G., B.V., D.J.I., J.B.L.; Visualization: A.L., A.H.; Supervision: A.H., J.B.L.; Project administration: A.H., J.B.L.; Funding acquisition: J.B.L., A.H.
Funding
This study was supported by the Putnam Fund, Museum of Comparative Zoology, Harvard University; the David M. Fite Fund, Harvard University; the David Rockefeller Center for Latin American Studies, Harvard University; and Division of Integrative Organismal Systems National Science Foundation grant IOS-1354620.
Supplementary information
Supplementary information available online at
http://jeb.biologists.org/lookup/doi/10.1242/jeb.188805.supplemental
References
Abdala, V., Manzano, A. S., Tulli, M. J. and Herrel, A.(2009). The tendinous patterns in the palmar surface of the lizard manus: functional consequences for grasping ability.Anat. Rec.292, 842-853.
Arnold, E. N.(1998). Structural niche, limb morphology and locomotion in lacertid lizards (Squamata: Lacertidae), a preliminary survey.Bull. Nat. Hist. Mus. Lond.
Zool.64, 63-89.
Avila-Pires, T. C. S.(1995). Lizards of Brazilian amazonas (Reptilia: Squamata).
Zool. Verh. (Leiden)299, 1-706.
Bauwens, D., Garland, T., Jr, Castilla, A. and Van Damme, R.(1995). Evolution of sprint speed in lacertid lizards: morphological, physiological and behavioral covariation.Evolution49, 848-863.
Bonine, K. E. and Garland, T., Jr.(1999). Sprint performance of phrynosomatid lizards, measured on a high-speed treadmill, correlates with hindlimb length.
J. Zool.248, 255-265.
Butler, M. A.(2007). Vive le difference! Sexual dimorphism and adaptive patterns in lizards of the genusAnolis.Integr. Comp. Biol.47, 272-284.
Butler, M. A. and Losos, J. B.(2002). Multivariate sexual dimorphism, sexual selection, and adaptation in Greater AntilleanAnolislizards.Ecol. Monogr.72, 541-559.
Butler, M. A., Schoener, T. W. and Losos, J. B.(2000). The relationship between sexual size dimorphism and habitat use in Greater AntilleanAnolis lizards.
Evolution54, 259-272.
Carrier, D. R.(1995). Ontogeny of jumping performance in the black tailed jack rabbit, (Lepus californicus).Zoology94, 309-313.
Felsenstein, J. (1985). Phylogenies and the comparative method. Am. Nat. 125, 1-15.
Fieler, C. L. and Jayne, B. C.(1998). Effects of speed on the hindlimb kinematics of the lizardDipsosaurus dorsalis.J. Exp. Biol.201, 609-622.
Foster, K. L. and Higham, T. E. (2012). How forelimb and hindlimb function changes with incline and perch diameter in the green anole,Anolis carolinensis.
J. Exp. Biol.215, 2288-2300.
Foster, K. L. and Higham, T. E.(2014). Context-dependent changes in motor control and kinematics during locomotion: modulation and decoupling.Proc. Biol. Sci.281, 20133331.
Garland, T., Jr. and Losos, J. B.(1994). Ecological morphology of locomotor performance in squamate reptiles. In Ecological Morphology: Integrative
Organismal Biology (ed. P. C. Wainwright and S. M. Reilly), pp. 240-302.
Chicago: University of Chicago Press.
Hartstone-Rose, A., Perry, J. M. G. and Morrow, C. J.(2012). Bite force estimation and the fiber architecture of felid masticatory muscles.Anat. Rec.295, 1336-1351.
Herrel, A., Joachim, R., Vanhooydonck, B. and Irschick, D. J.(2006). Ecological consequences of ontogenetic changes in head shape and bite performance in the Jamaican lizardAnolis lineatopus.Biol. J. Linn. Soc.89, 443-454.
Herrel, A., McBrayer, L. D. and Larson, P. M.(2007). Functional basis for sexual differences in bite force in the lizardAnolis carolinensis.Biol. J. Linn. Soc.91, 111-119.
Herrel, A., Vanhooydonck, B., Porck, J. and Irschick, D. J.(2008). Anatomical basis of differences in locomotor behavior inAnolislizards: a comparison between two ecomorphs.Bull. Museum Comp. Zool.159, 213-238.
Herrel, A., Lopez-Darias, M., Vanhooydonck, B., Cornette, R., Kohlsdorf, T. and Brandt, R. (2016). Do adult phenotypes reflect selection on juvenile performance? A comparative study on performance and morphology in lizards.
Integr. Comp. Biol.56, 469-478.
Hildebrand, M.(1974).Analysis of Vertebrate Structure. New York: John Wiley and Sons.
Hildebrand, M.(1985). Walking and running. InFunctional Vertebrate Morphology
(ed. M. Hildebrand, D. M. Bramble, K. F. Liem and D. B. Wake), pp. 38-57. Cambridge: Belknap Press.
Huey, R. B. and Stevenson, R. D.(1979). Integrating thermal physiology and ecology of ectotherms: a discussion of approaches.Am. Zool.19, 357-366.
Husak, J. F., Fox, S. F. and Van Den Bussche, R. A.(2008). Faster male lizards are better defenders not sneakers.Anim. Behav.75, 1725-1730.
Irschick, D. J. (2000). Effects of behavior and ontogeny on the locomotor performance of a West Indian lizard,Anolis lineatopus.Funct. Ecol.14, 438-444.
Irschick, D. J. and Garland, T., Jr.(2001). Integrating function and ecology in studies of adaptation: investigations of locomotor capacity as a model system.
Annu. Rev. Ecol. Syst.32, 367-396.
Irschick, D. J. and Higham, T. (2016). Animal Athletes: An Ecological and
Evolutionary Approach. Oxford, UK: Oxford University Press.
Irschick, D. J. and Jayne, B. C.(1998). Effects of incline on acceleration, body posture, and hindlimb kinematics in two species of lizard,Callisaurus draconoides
andUma scoparia.J. Exp. Biol.201, 273-287.
Irschick, D. J. and Jayne, B. C.(1999). Comparative three-dimensional kinematics of the hindlimb for high-speed bipedal and quadrupedal locomotion of lizards.
J. Exp. Biol.202, 1047-1065.
Irschick, D. J., Vanhooydonck, B., Herrel, A. and Meyers, J.(2005). Intraspecific correlations among morphology, performance and habitat use within a green anole lizard (Anolis carolinensis) population.Biol. J. Linn. Soc.85, 211-221.
Irschick, D. J., Meyers, J. J., Husak, J. F. and Le Galliard, J. F.(2008). How does selection operate on whole-organism functional performance capacities? A review and synthesis.Evol. Ecol. Res.10, 177-196.
Jackman, T. R., Larson, A., de Queiroz, K. and Losos, J. B.(1999). Phylogenetic relationships and tempo of early diversification inAnolislizards.Syst. Biol.48, 254-285.
James, R. S., Navas, C. A. and Herrel, A.(2007). How important are skeletal muscle mechanics in setting limits on jumping performance?J. Exp. Biol.210,
923-933.
Journal
of
Experimental
Lailvaux, S. P. and Irschick, D. J.(2007). The evolution of performance-based male fighting ability in CaribbeanAnolislizards.Am. Nat.170, 573-586.
Lailvaux, S. P., Herrel, A., Vanhooydonck, B., Meyers, J. J. and Irschick, D. J.
(2004). Performance capacity, fighting tactics and the evolution of life–stage male morphs in the green anole lizard (Anolis carolinensis).Proc. R. Soc. Lond. B.271, 2501-2508.
Losos, J. B.(1990a). Ecomorphology, performance capability, and scaling of West IndianAnolislizards: an evolutionary analysis.Ecol. Monogr.60, 369-388.
Losos, J. B.(1990b). Concordant evolution of locomotor behaviour, display rate and morphology inAnolislizards.Anim. Behav.39, 879-890.
Losos, J. B.(1990c). The evolution of form and function: morphology and locomotor performance in West IndianAnolislizards.Evolution44, 1189-1203.
Losos, J. B. and Sinervo, B.(1989). The effects of morphology and perch diameter on sprint performance ofAnolislizards.J. Exp. Biol.145, 23-30.
Losos, J. B., Jackman, T., Larson, A., de Queiroz, K. and Rodriguez-Schettino, L.
(1998). Contingency and determinism in replicated adaptive radiations of island lizards.Science279, 2115-2118.
Losos, J. B., Butler, M. A. and Schoener, T. W.(2003). Sexual dimorphism in body size and shape in relation to habitat use among species of CaribbeanAnolis
lizards. InLizard social Behavior(ed. S. F. Fox, J. K. McCoy and T. A. Baird), pp. 356-380. Baltimore: Johns Hopkins University Press.
Lowie, A., Herrel, A., Abdala, V., Manzano, A. S. and Fabre, A.-C.(2018). Does the morphology of the forelimb flexor muscles differ between lizards using different habitats?Anat. Rec.301, 424-433.
Mendez, J. and Keys, A.(1960). Density and composition of mammalian muscle.
Metabolism9, 184-188.
Miles, D. B.(1994). Covariation between morphology and locomotor performance in sceloporine lizards. InLizard Ecology: Historical and Experimental Perspectives
(ed. L. J. Vitt and E. R. Pianka), pp. 207-305. Princeton: Princeton University Press.
Morris, J. S. and Carrier, D. R.(2016). Sexual selection on skeletal shape in Carnivora.Evolution70, 767-780.
Nelson, F. E. and Jayne, B. C.(2001). The effects of speed on thein vivoactivity and length of a limb muscle during the locomotion of an iguanian lizard,
Dipsosaurus dorsalis.J. Exp. Biol.204, 3507-3522.
Nicholson, K. E., Crother, B. I., Guyer, C. L. and Savage, J. M.(2012). It is time for a new classification of anoles (Squamata: Dactyloidae).Zootaxa.3477, 1-108.
Pasi, B. M. and Carrier, D. R.(2003). Functional trade-offs in the limb muscles of dogs selected for running vs fighting.J. Evol. Biol.16, 324-332.
Perry, G., LeVering, K., Girard, I. and Garland, T., Jr. (2004). Locomotor performance and social dominance in male Anolis cristatellus.Anim. Behav. 67, 37-47.
Pinto, G., Mahler, D. L., Harmon, L. J. and Losos, J. B.(2008). Testing the island effect in adaptive radiation: rates and patterns of morphological diversification in Caribbean and mainlandAnolislizards.Proc. R. Soc. B275, 2749-2757.
Poe, S., Nieto-montes de Oca, A., Torres-Carvajal, O., de Queiroz, K., Velasco, J. A., Truett, B., Gray, L. N., Ryan, M. J., Köhler, G., Ayala-Varela, F. et al.(2017). A phylogenetic, biogeographic, and taxonomic study of all extant species ofAnolis
(Squamata; Iguanidae).Syst. Biol.66, 663-697.
Pyron, R. A., Burbrink, F. T. and Wiens, J. J.(2013). A phylogeny and revised classification of Squamata, including 4161 species of lizards and snakes.BMC
Evol. Biol.13, 93.
Reilly, S. M.(1995). Quantitative electromyography and muscle function of the hindlimb during locomotion in the lizardSceloporus clarki.Zool. Anal. Complex
Syst.98, 278-297.
Reilly, S. M. and Delancey, M. J.(1997). Sprawling locomotion in the lizard
Sceloporus clarkii: the effects of speed on gait, hindlimb kinematics, and axial
bending during walking.J. Zool. Lond.243, 417-433.
Revell, L. J.(2012). phytools: an R package for phylogenetic comparative biology (and other things).Methods Ecol. Evol.3, 217-223.
Sanger, T. J., Losos, J. B. and Gibson-Brown, J. J.(2008). A developmental staging series for the lizard genusAnolis: a new system for the integration of evolution, development, and ecology.J. Morphol.137, 129-137.
Seitz, L. B., Reyes, A., Tran, T. T., Saez de Villarreal, E. and Haff, G. G.(2014). Increases in lower-body strength transfer positively to sprint performance: a systematic review with meta-analysis.Sports Med.44, 1693-1702.
Snyder, R. C.(1954). The anatomy and function of the pelvic girdle and hindlimb in lizard locomotion.Am. J. Anat.95, 1-45.
Snyder, R. C.(1962). Adaptations for bipedal locomotion of lizards.Am. Zool.2, 191-203.
Stamps, J. A., Losos, J. B. and Andrews, R. M.(1997). A comparative study of population density and sexual size dimorphism in lizards.Am. Nat.149, 64-90.
Tulli, M. J., Abdala, V. and Cruz, F. B.(2011). Relationships among morphology, clinging performance and habitat use in Liolaemini lizards.J. Evol. Biol. 24, 843-855.
Van Damme, R. and Vanhooydonck, B.(2001). Origins of interspecific variation in lizard sprint capacity.Funct. Ecol.15, 186-202.
Vanhooydonck, B., Van Damme, R. and Aerts, P.(2002). Variation in speed, gait characteristics and microhabitat use in lacertid lizards.J. Exp. Biol. 1046, 1037-1046.
Vanhooydonck, B., Herrel, A., Van Damme, R. and Irschick, D. J.(2006a). The quick and the fast: the evolution of acceleration capacity in Anolis lizards.
Evolution60, 2137-2147.
Vanhooydonck, B., Herrel, A. and Irschick, D. J.(2006b). Out on a limb: the differential effect of substrate diameter on acceleration capacity inAnolislizards.
J. Exp. Biol.209, 4515-4523.
Vanhooydonck, B., Herrel, A. and Irschick, D. J.(2007). Determinants of sexual differences in escape behavior in lizards of the genusAnolis: a comparative approach.Integr. Comp. Biol.47, 200-210.
Vitt, L. J. and Caldwell, J. P.(2014). Herpetology: An Introductory Biology of
Amphibians and Reptiles, 4th edn. London, Waltham, San Diego: Academic Press.
Weyand, P. G., Sternlight, D. B., Bellizzi, M. J. and Wright, S.(2000). Faster top running speeds are achieved with greater ground forces not more rapid leg movements.J. Appl. Physiol.89, 1991-1999.
Weyand, P. G., Sandell, R. F., Prime, D. N. L. and Bundle, M. W.(2010). The biological limits to running speed are imposed from the ground up.J. Appl.
Physiol.108, 950-961.
Williams, E. E.(1983). Ecomorphs, faunas, island size, and diverse end points in island radiations ofAnolis. InIsland Radiations of Anolis(ed. R. B. Huey, E. R. Pianka and T. W. Schoener), pp. 326-370. Cambridge: Harvard University Press.
Zaaf, A., Herrel, A., Aerts, P. and De Vree, F. (1999). Morphology and morphometrics of the appendicular musculature in geckoes with different locomotor habits (Lepidosauria).Zoomorphology119, 9-22.
Zaaf, A., Van Damme, R., Herrel, A. and Aerts, P.(2001). Spatio-temporal gait characteristics of level and vertical locomotion in a ground-dwelling and a climbing gecko.J. Exp. Biol.204, 1233-1246.
Zani, F.(2000). The comparative evolution of lizard claw and toe morphology and clinging performance.J. Evol. Biol.13, 316-325.