Abstract—This study introduces a normalized article influence score. The main objective is to show that the article influence score obtained in different categories is not equivalent and it is necessary to normalize it when comparing journals form different categories. Several methods are suggested including a normalization that divides the article influence score by the average and another approach that normalizes the results in [0, 1] inside the same category in order to be able to compare between different fields. The results show that each category have different results and it is necessary to develop a normalization process in order to compare the journals. The article analyses a case study in engineering.
Index Terms— Article influence score, Bibliometrics, Web of Science, journals.
I. INTRODUCTION
The article influence score is an indicator that measures the average influence of the articles of a journal during the first five years of publication. It was developed in 2007 by Carl Bergstrom and Jevin West at the University of Washington [4]. Currently, it is available in the Web of Science (WoS) through the Journal Citation Reports (JCR) as one of the representative bibliometric indicators for measuring the journals quality.
In the literature, there are many different approaches that analyse the journal quality and influence [1,6,12]. However, there is no single method that unifies all the approaches providing one single result. The main problem is that the data can be considered under different perspectives. Therefore, each analyst may give different importance to each of the variables considered so each analyst may interpret the data in different ways. In bibliometrics [5], a very typical example is the comparison between productivity and influence of an author or an institution [11]. Some analysts may give more importance to one of the variables and vice versa, so it is difficult to get a single result. Although there are methods that could partially solve this issue through consensus, still there could be differences because scientific research is dynamic and evolves throughout time.
The aim of this paper is to present a new approach for measuring the article influence score by using a normalization process between categories. The main reason for doing so is because the results obtained in different categories are substantially different [13]. Therefore, when comparing
Manuscript received March 18, 2016. This paper is supported by the Chilean National Science Foundation through the FONDECYT program.
J.M. Merigó, G. Zurita, and S. Link-Chaparro are with the Department of Management Control and Information Systems, School of Economics and Business, University of Chile, Av. Diagonal 257, 8330015 Santiago, Chile (corresponding author: +56-2-29772164; e-mail: [email protected]).
journals from different categories, it is not easy to compare them. This question is a complicated one that may also be considered under different perspectives. However, our objective is to improve the knowledge in this field by providing new approaches for representing this indicator.
First, we analyse the average article influence score by calculating the average of the article influence scores of all the journals of the category. Next, we recalculate the article influence score by dividing it by the average article influence score of the category. The result is the normalized article influence score. This approach permits to compare better the results between categories. However, there are still limitations in the analysis because many other issues could produce deviations including the degree of interdisciplinary of the journals in the category and some journals that do not fit with the usual profile.
The work also analyses other approaches including a normalization of the article influence score in the [0, 1] interval and through a ranking process in [0, 1] inside each category. The results indicate an improvement in the analysis but we see that the comparison between categories may favour different journals depending on the specific approach considered. Some numerical results are presented in order to understand the new approach.
The rest of the paper is organized as follows. Section 2 briefly reviews some basic preliminaries. Section 3 presents the normalized article influence score and some other related extensions. Section 4 develops some numerical examples and Section 5 summarizes the main findings and conclusions of the paper.
II. PRELIMINARIES
All the data is assessed with the WoS database. However, it is also possible to consider other databases including Scopus and Google Scholar. Currently, Web of Science divides scientific research in 251 categories. The journals of each category are studied through the JCR. One of the indicators considered is the article influence score. It is calculated as follows:
X
r EigenFacto Score
Influence
Article =0.01× , (1) where X is the division between the 5-year journal article count and the 5-year article count from all journals. Note that the eigenfactor is calculated based on the number of citations received a specific year from the journals of the JCR by articles published during the last five years in the journal. Additionally, it also considers the current value of the journal so citations from a highly cited journal influences more the results. Note that self-citations are excluded.
Normalization of the Article Influence Score
Between Categories
In this study, in order to calculate the normalization process we use the arithmetic mean which is formulated as follows for a set of arguments (a1, a2, …, an):
∑ =
= n
i i
n a
n a a a AM
1 2
1
1 ) ,..., ,
( , (2) where ai is the ith argument of the set.
Note that in the literature there are many other averaging aggregation operators [19]. For further reading, see for example [2-3].
III. NORMALIZED ARTICLE INFLUENCE SCORE The normalized article influence score measures the influence of a journal considering the results obtained in its WoS research category. This approach is useful in situations where we want to compare journals between different categories because it equilibrates the results from categories with higher results versus categories with lower results. It can be formulated as follows:
category AIS
Average AIS AIS
Normalized = , (3)
where AIS is the article influence score of the journal and it is divided by the average AIS of the category where the journal belongs in WoS.
The average article influence score of the category is calculated as follows:
∑ =
= n
i i a n AIS Average
1 1
, (4) where ai is the ith journal of the category which has a total of n journals.
Note that some journals appear in several categories, so their normalized results may change depending on the category considered. Generally, the assumption is to consider the journal in the category where it fits better in the specific problem considered.
Observe that Eq. (3) calculates the normalization with the arithmetic mean of all the journals of the category. However, the importance of the journals is not the same in the category according to a wide range of assumptions. Therefore, a better approach to calculate the normalization process is through the weighted average. However, the problem here is how to weight each journal because different issues could be considered. For example, we could weigh the journals according to the number of papers published although from a technical point of view we should also consider the number of pages and words. Another alternative would be to weigh the journals according to the number of citations received. And so on. In this case, we could call this indicator the weighted article influence score (WAIS) and formulate it as follows:
∑ =
= n
i i i a w AIS Weighted
1
, (5) where wi is the weight given to the ith journal ai of the category considered.
When we do not know how to weight the journals, an alternative approach may be the use of the ordered weighted average (OWA) [7,15,18]. Thus, we could present the ordered weighted average article influence score (OWAAIS) as follows:
∑ = −
= n
j j j
b w AIS OWA
1
, (6) where bj is the jth largest article influence score of the journal ai according to Eq. (5).
Note that usually, when we do not know the weights, the easiest choice is to use the arithmetic mean which is obtained from the OWA when all the weights: wj = 1/n. However, it is worth noting that there are many other particular types of OWA operators that could be considered including the step-OWA, the olympic-OWA, the window-OWA and the centered OWA [16].
Observe that the OWA operator under or overestimates the data according to a degree of optimism or pessimism which can be represented with the following measure α(W):
∑ − − =
= n
j n j n W
1 1
) (
α . (7)
The closer α to the top, the more optimistic the analyst is in the analysis and vice versa.
Sometimes, the numerical values, may bring additional difficulties in the analysis so the reordering process is more complex. In these cases, an alternative approach is the induced OWA operator [10,17] which generalizes the OWA operator by using order inducing variables in the reordering process of the information. Thus, we get the induced OWA article influence score which is formulated as follows:
∑ = −
= n
j j j
b w AIS IOWA
1
, (8) where bj is the article influence score of the journal ai, ordered according to the values of the order inducing variables ui in the pair [ui, ai] of the set ({u1, a1}, {u2, a2}, …, {un, an}).
Note that many other extensions and generalizations could be developed following the OWA literature [9,14,18]. The objective is to use the aggregation operator [8] that better fits to the specific problem considered.
IV. NORMALIZATION IN [0,1]
The normalized article influence score provides a better equilibrium between categories. However, there are many other issues that should be considered when comparing categories. First, the categories are not equally important. Second, different persons may have different preferences between categories. And third, the publication style regarding productivity, number of words per article and other related issues, is not the same between categories. Additionally, note that we follow WoS approach for classifying the categories but many journals are interdisciplinary and many times a category can be divided and merged with others.
An alternative approach is to evaluate all the journals inside the category and give them a score between 0 and 1 where the score of 1 would be given to the journal with the highest result. In order to do so, there are different alternatives. First, we can normalize in [0, 1] by dividing all the article influence scores of the journals by the maximum one. Thus, the journal with the highest result would get a score of 1 while the other ones would get a score between [0, 1]. It is formulated as follows:
AIS Maximum
AIS AIS
where AIS is the article influence score of the journal x and Maximum AIS is the article influence score of the journal with the highest result in the category.
This alternative is a useful approach in order to identify the top journal of the category. However, it has several important weaknesses. First, if the top journal can be seen as an outlier, it strongly distortions the results of the rest of the journals. And second, the value of each category is not always the same so the top journal in a small category may be less influent than the top journal in a huge category.
The second limitation can be solved by weighting the value of each category. Thus, the formulation would be as follows:
=
AIS Maximum
AIS C
AIS
Normalized [0,1] i x , (10) where Ci is the weight given to each category. Note that in order to use a [0, 1] scale, Ci∈ [0, 1]. However, it is also possible to use a different scale. Eq. (10) could be an alternative for comparing categories but the problem is that different points of view should be considered so the weights may be different according to the person that analyzes the categories. In other words, some people may think physics is more important, but some other may think chemistry, economics, and so on.
The first limitation may bring important differences in the results so an alternative measure is needed. Another approach may be obtained by using the ranking position of the journal in the category. Here we would obtain the ranked normalized article influence score. This is formulated as follows:
n i AIS
normalized
Ranked [0,1]=1−( −1), (11) where i is the ranking position of the journal in the category according to the article influence score (or the impact factor) and n is the total number of journals in the category. Note that we could develop an equivalent indicator for the impact factor and for the 5-year impact factor as follows:
n i IF
normalized
Ranked [0,1]=1−( −1). (12) As we can see, the journal with the highest result obtains a result of 1 while the journal in the last position obtains 0. This approach avoids the problem of outliers and is reasonably useful. However, we could also consider other issues including the distribution of journals in the category. Eq. (10) assumes that all the journals are equally distributed but this is not always the case. For example, if in a set of one hundred journals, there are five top journals well above the rest, these five journals should obtain results substantially higher than the rest. For doing so, we should weight the distribution of the journals. Note that this has many difficulties but from a general perspective, we could formulate it as follows:
n i z AIS
normalized rank
Weighted [0,1]=1−( × −1), (13) where z is a weight that corrects the numerical number of the position when the value of the journals are not equally distributed in the category. Note that many questions may arise in order to understand z, but here let us simplify this with Eq. (13). For example, z should be 1 for the first and last journal if we want to keep the results in [0, 1].
Eq. (11) and Eq. (12) should also be studied taking into account that the value of different categories is not the same.
Therefore, following Eq. (10), we could reformulate Eq. (11) as follows:
−
− =
n i C AIS
normalized
Ranked [0,1] i 1 ( 1) , (14) where Ci is the weight given to each category and in order to use a [0, 1] scale, Ci∈ [0, 1].
Note that these indicators and those developed before by other authors improve our knowledge on how to value journals and may work well in specific situations. The key is to use the method that better fits the specific problem considered. However, there are still many open questions in order to find a final method. The main problem is that we may always consider different perspectives so the interpretations by one analyst may be different than another one. Therefore, the conclusion is that depending on the specific situation we are analyzing, we should select a different approach. In order to find a single method is quite complicated because there should be an agreement between all the specialists regarding how important is each criteria.
V. NUMERICAL EXAMPLE
In order to understand better the equations presented in the previous sections, this section analyses two numerical examples.
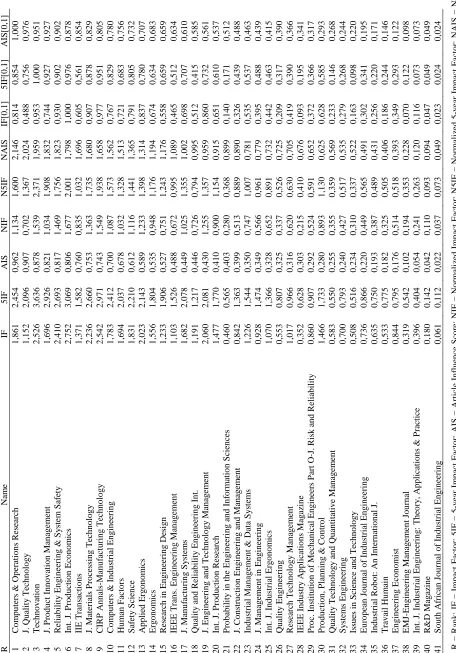
In the first example, let us look into a specific category and see how we can calculate the indicators mentioned in the previous sections. The example focuses on the WoS category of Industrial Engineering. Table 1 presents the results of all the journals in this category.
As we can see, the average article influence score is 0.448. This is a very low result because the average article influence score of all science is 1. Thus, when normalizing the scores of the journals in this category, the results increase significantly. In this context, it is interesting to see that categories with low values may increase they result significantly and vice versa. This issue is useful between categories because the indicator normalizes the results so we can compare better the results.
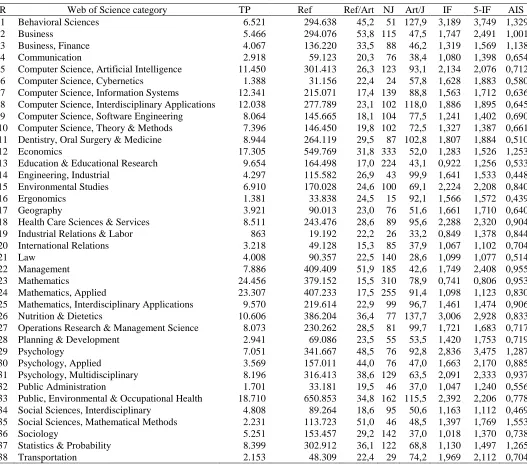
Next, let us look into the results found in different categories in order to see which ones tend to obtain a higher article influence score. Table 2 presents some WoS categories with their average results.
There are significant differences between categories. From the set of categories considered, we see some that obtain an average article influence score around 0.5, while some other categories obtain up to 1.5. Thus, when comparing journals between different categories, it is important to consider this issue in order to make a fair comparison. However, many additional questions may arise about the value of a journal. For example, the value of each category could also be different so the normalization should take into account this issue. And so on. But from a general point of view, the normalized article influence score tends to obtain more representative results because it eliminates significantly the differences between categories.
Table 2. General results of some WoS categories
R Web of Science category TP Ref Ref/Art NJ Art/J IF 5-IF AIS
1 Behavioral Sciences 6.521 294.638 45,2 51 127,9 3,189 3,749 1,329
2 Business 5.466 294.076 53,8 115 47,5 1,747 2,491 1,001
3 Business, Finance 4.067 136.220 33,5 88 46,2 1,319 1,569 1,138
4 Communication 2.918 59.123 20,3 76 38,4 1,080 1,398 0,654
5 Computer Science, Artificial Intelligence 11.450 301.413 26,3 123 93,1 2,134 2,076 0,712 6 Computer Science, Cybernetics 1.388 31.156 22,4 24 57,8 1,628 1,883 0,580 7 Computer Science, Information Systems 12.341 215.071 17,4 139 88,8 1,563 1,712 0,636 8 Computer Science, Interdisciplinary Applications 12.038 277.789 23,1 102 118,0 1,886 1,895 0,645 9 Computer Science, Software Engineering 8.064 145.665 18,1 104 77,5 1,241 1,402 0,690 10 Computer Science, Theory & Methods 7.396 146.450 19,8 102 72,5 1,327 1,387 0,661 11 Dentistry, Oral Surgery & Medicine 8.944 264.119 29,5 87 102,8 1,807 1,884 0,510
12 Economics 17.305 549.769 31,8 333 52,0 1,283 1,526 1,253
13 Education & Educational Research 9.654 164.498 17,0 224 43,1 0,922 1,256 0,533 14 Engineering, Industrial 4.297 115.582 26,9 43 99,9 1,641 1,533 0,448 15 Environmental Studies 6.910 170.028 24,6 100 69,1 2,224 2,208 0,840 16 Ergonomics 1.381 33.838 24,5 15 92,1 1,566 1,572 0,439
17 Geography 3.921 90.013 23,0 76 51,6 1,661 1,710 0,640
18 Health Care Sciences & Services 8.511 243.476 28,6 89 95,6 2,288 2,320 0,904 19 Industrial Relations & Labor 863 19.192 22,2 26 33,2 0,849 1,378 0,844 20 International Relations 3.218 49.128 15,3 85 37,9 1,067 1,102 0,704
21 Law 4.008 90.357 22,5 140 28,6 1,099 1,077 0,514
22 Management 7.886 409.409 51,9 185 42,6 1,749 2,408 0,955
23 Mathematics 24.456 379.152 15,5 310 78,9 0,741 0,806 0,953
24 Mathematics, Applied 23.307 407.233 17,5 255 91,4 1,098 1,123 0,830 25 Mathematics, Interdisciplinary Applications 9.570 219.614 22,9 99 96,7 1,461 1,474 0,906 26 Nutrition & Dietetics 10.606 386.204 36,4 77 137,7 3,006 2,928 0,833 27 Operations Research & Management Science 8.073 230.262 28,5 81 99,7 1,721 1,683 0,717 28 Planning & Development 2.941 69.086 23,5 55 53,5 1,420 1,753 0,719
29 Psychology 7.051 341.667 48,5 76 92,8 2,836 3,475 1,287
30 Psychology, Applied 3.569 157.011 44,0 76 47,0 1,663 2,170 0,885 31 Psychology, Multidisciplinary 8.196 316.413 38,6 129 63,5 2,091 2,333 0,937 32 Public Administration 1.701 33.181 19,5 46 37,0 1,047 1,240 0,556 33 Public, Environmental & Occupational Health 18.710 650.853 34,8 162 115,5 2,392 2,206 0,778 34 Social Sciences, Interdisciplinary 4.808 89.264 18,6 95 50,6 1,163 1,112 0,469 35 Social Sciences, Mathematical Methods 2.231 113.723 51,0 46 48,5 1,397 1,769 1,553
36 Sociology 5.251 153.457 29,2 142 37,0 1,018 1,370 0,738
37 Statistics & Probability 8.399 302.912 36,1 122 68,8 1,130 1,497 1,265 38 Transportation 2.153 48.309 22,4 29 74,2 1,969 2,112 0,704
Abbreviations: TP = Total publications; Ref = Total references; Ref/Art = References per article; NJ = Number of journals; Art/J = Articles per journal.
Note that in Table 1 we also present a normalization scale in [0, 1] which is useful for comparing journals between categories because a value of 1 indicates the best journal in the category and so on. Additionally, if the journal has a result above 0.75, is in the first quartile, between 0.5 and 0.75 in the second quartile, between 0.25 and 0.5 in the third quartile and below 0.25 in the fourth quartile.
VI. CONCLUSION
This article has presented the normalized article influence score. This normalization process has been developed under several perspectives. The main objective is to develop an indicator that can compare journals from different categories. Several approaches have been studied including the normalization through the average influence score of a category and the normalization in the [0, 1] scale inside a
category. The average article influence score has been studied by using a wide range of averaging aggregation operators including the weighted average, the OWA operator and the induced OWA operator. Each of them becomes useful under specific situations. An alternative approach has been suggested by using a [0, 1] scale inside the category. The main reason is that here we can equilibrate the results of different categories because the journal with the highest result always obtain 1. This approach has been considered with the article influence score and with the impact factor.
analysed the general results of some representative categories. We have seen their annual volume of publications and references, and their average results in the impact factor, 5-year impact factor and article influence score. There is huge dispersion between categories having some categories three times higher result than other ones.
This study introduces a new version of the article influence score that provides a better comparison between categories. In future research, we will study further improvements trying to adapt better to the specific necessities that may occur between categories or when comparing other factors. Other aggregation operators will be considered and also other WoS categories. Finally, it is worth noting that this study has focused on the normalization between journals, but it is also interesting to mention that future research should also look into normalization processes between different fields that compare authors, universities and countries.
REFERENCES
[1] S. Alonso, F.J. Cabrerizo, E. Herrera-Viedma, F. Herrera, H-index: A review focused on its variants, computation and standarization for different scientific fields. Journal of Informetrics, 3:273-289, 2009. [2] G. Beliakov, A. Pradera and T. Calvo, Aggregation functions: A guide
for practitioners. Berlin: Springer-Verlag, 2007.
[3] G. Beliakov, H. Bustince, T. Calvo, A practical guide to averaging
functions. Berlin: Springer-Verlag, 2016.
[4] C.T. Bergstrom, Eigenfactor: Measuring the value and prestige of scholarly journals. College & Research Libraries News, 68:314-316, 2007.
[5] R.N. Broadus, Toward a definition of “Bibliometrics”. Scientometrics, 12:373-379, 1987.
[6] Y. Ding, R. Rousseau, D. Wolfram, Measuring scholarly impact:
Methods and practice. Berlin: Springer-Verlag, 2014.
[7] A. Emrouznejad, M. Marra, Ordered weighted averaging operators 1988–2014. A citation based literature survey. International Journal
of Intelligent Systems, 29:994-1014, 2014.
[8] M. Grabisch, J.L. Marichal, R. Mesiar, E. Pap, Aggregation functions: Means. Information Sciences, 181:1-22, 2011.
[9] J.M. Merigó, A unified model between the weighted average and the induced OWA operator. Expert Systems with Applications, 38: 11560-11572, 2011.
[10] J.M. Merigó and A.M. Gil-Lafuente, The induced generalized OWA operator. Information Sciences, 179:729-741, 2009.
[11] J.M. Merigó, A.M. Gil-Lafuente, R.R. Yager, An overview of fuzzy research with bibliometric indicators. Applied Soft Computing, 27: 420-433, 2015.
[12] J.M. Merigó, A. Mas-Tur, N. Roig-Tierno, D. Ribeiro-Soriano, A bibliometric overview of the Journal of Business Research between 1973 and 2014. Journal of Business Research, 68: 2645-2653, 2015. [13] W.H. Walters, Do article influence scores overestimate the citation
impact of social science journals in subfields that are related to higher-impact natural science disciplines? Journal of Informetrics, 8:421-430, 2014.
[14] Z.S. Xu and Q.L. Da, An overview of operators for aggregating information. International Journal of Intelligent Systems, 18:953-968, 2003
[15] R.R. Yager, On ordered weighted averaging aggregation operators in multi-criteria decision making. IEEE Transactions on Systems, Man
and Cybernetics B, 18:183-190, 1988.
[16] R.R. Yager, Families of OWA operators. Fuzzy Sets and Systems, 59:125-148, 1993.
[17] R.R. Yager and D.P. Filev, Induced ordered weighted averaging operators. IEEE Transactions on Systems, Man and Cybernetics B, 29:141-150, 1999.
[18] R.R. Yager, J. Kacprzyk and G. Beliakov, Recent developments on the
ordered weighted averaging operators: Theory and practice. Berlin:
Springer-Verlag, 2011.
[19] D. Yu, A scientometrics review on aggregation operator research.