Abstract— Among many functional structures, the low shear stiffness type shape memory alloy (SMA) honeycomb structure is considered as an ideal candidate for actuator, sensor, and shape control devices. This work extends conventional SMA computational models with essential functions such as consideration of twinned martensite and enhancement for hysteresis behavior model. Using these improved models, we conducted numerical studies related to low shear stiffness type SMA honeycomb structures. Fundamental studies related to tensile and compressive loading behavior were conducted first, followed by simulation of the honeycomb core actuator considering simultaneous changes in temperature and stress level. In the field of simulation, this is the first comprehensive study related to SMA honeycomb structures. Both model validation and new discoveries could be expected from this work.
Index Terms— computational mechanics, shape memory alloy, constitutive equation, honeycomb structure, honeycomb core actuator
I. INTRODUCTION
Owing to complicated behaviors of shape memory alloy (SMA), applications of SMA actuators so far have been limited in relatively simple components, such as SMA bars, wires and beams. As the understanding of SMA's material properties are getting deeper and deeper in SMA research community, SMA applications with further complex structures have been reported from different sources. Among those reports, applications of SMA in honeycomb structures have been attracting attentions recently. Those reports include Hassan et al.[1], Michailidis et al. [2], and Okabe et al. [3]. The research on SMA honeycomb as an actuator is a major topic in this paper. To fully support simulations in SMA honeycomb actuators, we have proposed two improvements on conventional SMA computational models, focusing on SMA behaviors in low temperature environment and hysteresis environment. Implementations of this improved model include a simulation on SMA honeycomb tensile or compressive behavior, and a simulation on SMA honeycomb core actuators.
Manuscript received December 8, 2013; revised January 10, 2014. Y. Toi is with the Institute of Industrial Science, University of Tokyo, 4-6-1 Komaba, Meguro-ku, Tokyo 153-8505, Japan (phone: 03-5452-6178; fax: 03-5452-6180; e-mail: [email protected]).
J. He was with the Institute of Industrial Science, University of Tokyo (e-mail: [email protected])
II. COMPUTATIONAL MODEL
An improved model in this paper is based on the SMA computational model proposed by Brinson [4] and Toi et al. [5]. Incremental form of stress-strain relation and phase transformation mechanism in this paper, as well as units and symbols are identical to Toi et al. [5] model.
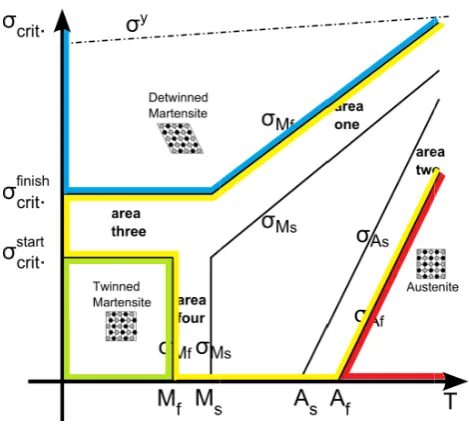
Thermo-mechanical characteristics of SMA can be found in the temperature-stress-phase graph of Fig. 1. Three major phases exist: austenite, twinned martensite, and detwinned martensite. Other than material parameters and strain, stress in SMAs is mainly determined by temperature T and martensite phase fraction . Incremental form of the stress-strain relationship has been developed as follows.
(
se)
seD ε ε
σ= Δ +Δ
Δ (1) where ∆ and ∆ are stress and strain increments. Functions of stiffness and ∆ are as follows:
σ ξ ξ σ ξ ξ ε
σ ξ
ξ ∂
∂ Ω − ∂ ∂ Ω − ∂ ∂ − =
s s se
d dE dE d d
dE
E D
1
(2)
E
T T
T d dE dE d T d
dE s
s
se
Δ ⎥ ⎦ ⎤ ⎢
⎣
⎡ +
∂ ∂ Ω + ∂ ∂ Ω + ∂ ∂
= Δ
θ ξ ξ ξ ξ ε
ξ ξ ε
(3) where E corresponds to the elastic tensor, is the phase transformation tensor, and is associated with the thermoelastic tensor. Martensite phase fraction is divided into two parts: temperature-induced martensite fraction and stress-induced martensite fraction . Detailed descriptions of this model can be found in Brinson [4] and Toi et al. [5].
The temperature-stress-phase diagram of SMA is plotted in Fig. 1. This diagram shows major phase transformations in all temperature range. However, in most conventional models, only phase transformations between detwinned martensite phase and austenite phase are considered. To fill the blank in this diagram, we proposed phase transformation mechanism for phase transformation (crystallographic reorientation process) between detwinned martensite and twinned martensite. This process occurs in the environment when temperature is lower than martensite phase transformation finishing temperature, which is a possible working environment for SMA actuators.
A typical phase transformation route is marked as a vertical arrow in Fig. 1. The proposed irreversible phase transformation mechanism from twinned martensite to detwinned martensite phase is as follows:
(i) When and . .
Computational Modeling of Honeycomb
Structures with Shape Memory Alloys
ph w an m w st of m w w tra te (r m ob st th ho on te hy as str un pr po in di an tra m tw co Fo 10 fo m z z 2 1 D0
D ξ
ξ = −
To demonstr hases, Young'
,
where E is a fu nd detwinned modulus of mar where detwinn
iffness of mar f the detwinn modulus of the
Experimenta with 100% init work1). In t
ansformation emperature
e-orientation) martensite phas
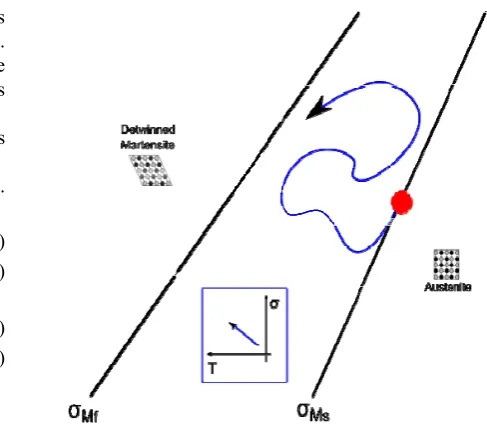
bserved in Fig The second ability in hyst he instability
oneycomb cor n isostress an emperature ysteresis beha s non-conve ress-temperatu npredictable, a rocess. Phase osition in Fig. nstability can b istance from th nd as th
ansformation model in Toi et Following th wo phase tran
ondition. One or the area circ 00% martensi orced to be 100
Another one mathematical e
z Martensite p 3) DP 0 σ σ ≥ 0 T T≤ z Austenite ph
DP 0 σ σ ≤ 0 T T≥ cos . finish crit σ σ π ⎩ ⎨ ⎧ −
rate different m s modulus of unction of the d martensite rtensite phase ned martensite rtensite phase ned martensi twinned mart al result suppo tial martensite this experim finish tempe is 25°C. ) from twinned se occurred in g. 2.
improvemen teresis environ problem we re actuators. C nd isothermal simultaneous avior may gen ergence. As
ure route and SMA pha volume fracti
1, but also the be found in B he phase trans he criterion takes place. t al. [5], it is n he train of thou
nsformation c is to force ph cled by blue li ite. For the ar 0% austenite. is a special ru xpression is a phase transfor DP 0 hase transform DP 0 1 . DP start crit σ β σ σ ⎢⎣
⎡ − +
material prop SMA is as fol
total martensi phase fract e is:
e phase fracti . is the ite phase, tensite phase. orted our mode
e phase was ment, the m
erature is Full phase d martensite p n this test. G nt is focusin nment. This im e met in sim Conventional
simulations. sly changin nerate unpredic we can in phase t ase transform ion is not only
e route history Bekker et al. [6 sformation cri
to determin However, fo no longer appli ught by Bekke conditions in hase volume ine in Fig. 4, S rea circled by ule for phase as follows: rmation (smal mation 2 1 . D finish crit ξ
σ + +
⎭ ⎬ ⎫ ⎥ ⎦ ⎤ erties among llows: ite phase fract tion . Yo ion determine e Young’s mo
is the You el. An SMA ri
tested in Has martensite p
30°C, and e transform phase to detwi Good fitting ca ng on simul mprovement so mulation on
models work But in stress ng environm
ctable results, see in Fig transformation ation is a one y determined b y. Attempt to a 6], who used l itical stress lin ne whether p
or further com icable. er [6], we prop nstead of Bek fraction defin SMA is forced y red line, SM
transformatio ll figure inside
[image:2.595.309.542.51.261.2] [image:2.595.310.541.302.487.2]0 D (4) three (5) tion oung's (6) es the dulus ung’s ibbon ssan’s phase room mation inned an be lation olved SMA k well s and ment, , such g. 3, n is e-way by its avoid linear ne phase mplex posed kker's nition. d to be MA is on. Its e Fig. (7) (8) (9) (10) F Fig. 3 Fig. 1
Fig. 2 Stress-stra
3 Possible stres
Stress-tempera
ain relationship
ss-temperature r phase transf
ature phase diag
p of SMA at low
route of SMAs formation
gram
w temperatures
[image:2.595.288.532.531.745.2]w be B eq G w di sim di va
A. te
ty co lo tra te m pr cy lo ca sim m fo be to de m lo
Fig. 4
Stress-Applications will be discusse
In all simula eam element eam elements qual layers a Gaussian points we can obtain
istribution alo mulations, st istributions us alue in each el
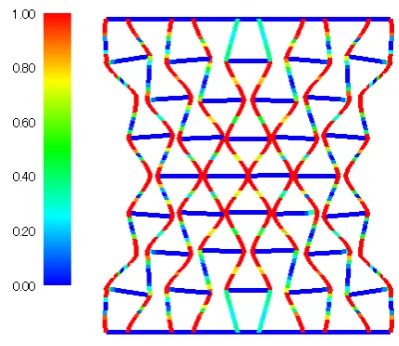
. Simulation ensile loading This simulati ype honeycom ondition (Fig. oading only e
ansformation emperature is martensite phas One-way ph rocess. The av ycle can be f oading process an be consid
mulation. Interesting b maximum disp orce is applie
ehavior (Fig. 8 In unloadin ogether with
eformation. A materials, and
ocalized defor
-temperature-ph transforma
s of the above ed in next sect ations in this p and the beam s in these sim along the vert
s. By using th n very detaile ong the radial tress and mar se the value of
lement. III. NUMER
on SMA hone
ion is about a mb structure.
5) is based o experiment wa finishing tem s 25°C. Init se.
hase transform verage stress-found in Fig. s is very simi dered as a ehavior can b placement in F
ed, honeycom 8) other than t ng process,
further ph After extensive in different rmation behav
hase diagram em ation condition
e-mentioned t tion.
paper, the Eul m layered appr mulations are s tical. Each la he layered bea
ed strain and direction. In rtensite phase f Gaussian po
RICAL STUDIE
eycomb structu
full cycle ten Initial shape on Hassan's re as conducted. mperature is 3 tial phase i mation occur strain relation . 6. Stiffness
lar to that of qualitative v be found durin Fig. 7 when mb shows di that during loa further defor hase transfor e investigation t temperature vior is an int
mphasizing pha
two improvem ler-Bernoulli roach are ado subdivided int ayer contains am approach s d martensite p
plots of follo e volume fra oint with maxi
ES
ure behavior u
nsile loading o with its boun eport [1], in w . Martensite p 30°C. Environ
s 100% twi rs during loa n during the w hardening d experiment, w validation for ng unloading. maximum loa ifferent unloa ading process rmation occu rmation and n for different
e, we found trinsic proper
ase
ments cubic opted. to ten s two stress,
phase owing action imum
under
of OX ndary which phase nment inned ading whole during which r this
After ading ading . urred,
cell SMA d this
rty of SMA X-sh level stiffn defo
Fi
Fi m
A OX type haped stress co
[image:3.595.51.286.58.271.2]l in those area ness weakenin rmation behav
Fig. 5 Initial honeyco
ig. 6 Average st
ig. 7 Shape of O martensite phase
honeycomb oncentration in a induced furt ng, which is th
vior.
l shape and bou omb structure u
tress-strain rela
OX type honeyc fraction distrib loadi
. Tensile lo n the honeyco ther phase tran he key reason
undary condition under tensile loa
ationship under
comb structure bution under ma
ing
oading induc omb. High stre
nsformation a n of the localiz
n of OX type ading
tensile loading
and detwinned aximum tensile
[image:3.595.314.539.554.720.2]Fig. 8 Shape of OX type honeycomb structure and detwinned martensite phase fraction distribution after unloading
B. Simulation on SMA honeycomb structure behavior under compressive loading
A major difference between OX type and auxetic type honeycombs is the cell internal angle. This difference imparts several special features to auxetic-type honeycombs. A negative Poisson ratio is one example. Localized deformation in OX type honeycombs is not obvious either. These behaviors are reproduced in the following simulations.
In compressive behavior simulation, the influences of structural imperfection on structure stiffness and stability have been considered. Based on random dislocation of cell joints, the following three variants of the auxetic type structure have been generated: perfect, 1% imperfect, and 10% imperfect. The initial shapes and boundary conditions of the auxetic type honeycomb structures are shown in Fig. 9 [2]. The bottom layer of the structure is fixed in all directions. Compression forces are applied on the top layer. The whole process involves a full loading and unloading cycle.
[image:4.595.315.545.126.284.2]According to the average stress-strain simulation results shown in Fig. 10, no obvious instability was observed in imperfect honeycombs. However, stiffness weakening was observed for the 1% imperfect and the 10% imperfect honeycombs.
Fig. 9 Initial shape of auxetic type honeycomb structure: perfect (left), 1
Fig. 11 contains the shape and martensite phase fraction graph under maximum loading.
[image:4.595.328.528.335.508.2]Fig. 12 shows the shape and martensite phase fraction graph after unloading. Owing to superelasticity, the martensite phase recovered back to the austenite phase after unloading, with minor residual martensite phase.
[image:4.595.333.532.562.734.2]Fig. 10 Auxetic type honeycomb structure compressive behavior: average stress-strain curve
Fig. 11 Auxetic type honeycomb structure’s martensite phase distribution (unit: 1) under maximum loading: perfect honeycomb structure (left),
[image:4.595.93.248.573.748.2]C
th sim ex fo D di en m ph de di m
F
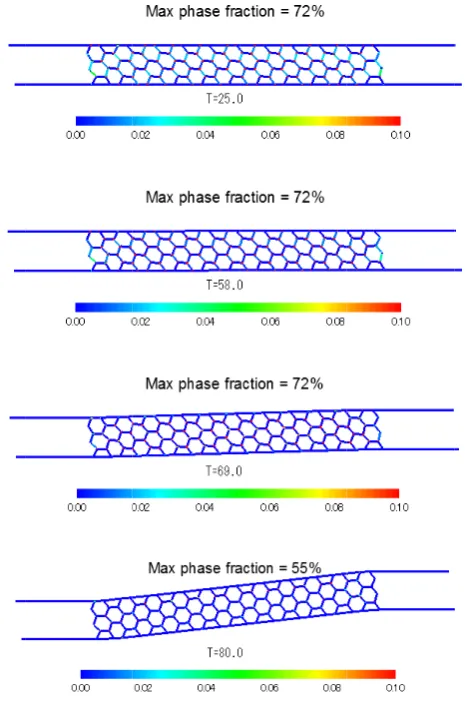
C. Simulation Simulation o he SMA actu mulation use xperiment.
The actuatin orced deforma etails are plot
[image:5.595.310.543.185.539.2]In step one, th isplacement i nvironment t martensite phas hase transform eformation a istribution ar martensite volu
[image:5.595.56.286.498.725.2]Fig. 13 Actuatio
Fig. 14 M deformation (
on SMA hone on SMA honey uator propose s identical se ng process in ation process tted in Fig. 13 he lower CFR is applied on temperature se transformat
mation finish and martens e plotted in ume fraction is
on process for h step 1
Martensite phase (unit: 1): displa
eycomb core a ycomb core ac ed by Okabe et of material ncludes two s s, step two is
.
RP layer is fixe n the upper is 25°C, w tion start temp h temperature site phase Fig. 14. M s generated in
honeycomb core 1 -> step 2
e distribution un acement at 0.0,
actuator ctuators is bas e et al. [3]. l parameters
steps: step o s heating pro ed. Leftward fo
CFRP layer. which is bet erature and re e. Detailed s
volume fra Maximum 72%
n this step.
e actuator: step
nder shear force 1.25, and 2.5 m
ed on This as in ne is ocess. forced The tween everse shape action % of
0 ->
e mm
In fixat Tem High whic Fig. volu when been has b
Fig. 1
F
n step two, fixa tion on two en mperature rises
her temperatu ch becomes th 15, which is ume fraction d n temperature n transformed been achieved
15 Martensite p
Fig. 16 Honeyc curve
ation on lower nds of this act s from 25°C ure induced re he key factor o s shape deform distribution gra
reaches 80°C back to austen d.
phase fraction di (unit:
comb core struc e: experimental
r CFRP layer tuator in horiz
to 80°C durin everse phase of actuating. A mation and m aphs in differe C, most marten
nite phase. Ve
istribution durin : 1)
cture temperatur l [3] vs. simulat
was replaced zontal directio ng this proce
transformatio As we can see martensite pha
ent temperatu nsite phases ha ertical Actuati
ng heating proc
re-displacemen ted
by on. ess. on, e in ase ure, ave ing
ess
[image:5.595.316.549.593.750.2]In Fig. 16, comparison between simulation and experimental result has been provided. By using special treatment in phase transformation condition, we successfully avoided instability during SMA actuator simulation. This simulation proved the validity of this new model.
IV. CONCLUSION
Two improvements to conventional SMA computational models have been introduced in this paper. One is twinned martensite phase support for SMA simulation in low temperature. Another is special treatment in phase transformation condition for SMA simulation in hysteresis environment. Both improvements are essential for SMA actuator simulations. Three successful numerical examples including SMA honeycomb structure tensile/compressive behavior and SMA honeycomb core actuator proved the validity of those improvements with additional physical findings. Further implementations of the new model are expected.
REFERENCES
[1] M. R. Hassan et al., “In-plane tensile behavior of shape memory alloy honeycombs with positive and negative Poisson’s ratio”. Journal of Intelligent Material Systems and Structures, vol.20, no.8, pp. 897-905, 2009..
[2] P. A. Michailidis et al., “Superelasticity and stability of a shape memory alloy hexagonal honeycomb under in-plane compression”,
International Journal of Solids and Structures, vol.46, no.13, pp. 2724-2738, 2009.
[3] Y. Okabe. et al., “Lightweight actuator structure with SMA honeycomb core and CFRP skins”, Journal of Mechanical Design, vol.133, pp. 011006, 2011.
[4] L. Brinson, “One-dimensional constitutive behavior of shape memory alloys: thermomechanical derivation with non-constant material functions and redefined martensite internal variable”, Journal of intelligent material systems and structures, vol.4, no.2, pp.229-242, 1993.
[5] Y. Toi et al., “Finite element analysis of superelastic, large deformation behavior of shape memory alloy helical spring”, Computers and Structures, vol.82, no.20, pp. 1685-1693, 2004.