Online Full Text
6
0
0
Full text
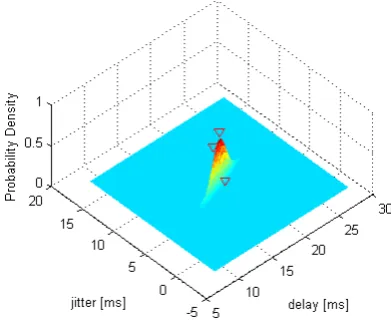
(2) Proceedings of the World Congress on Engineering 2013 Vol II, WCE 2013, July 3 - 5, 2013, London, U.K.. ... Fig. 2 – MPLS class-based tunnel (LSP) selection. Fig. 1 - CUBE model with two links. Two sets of parameters were gathered (delay and jitter) and then fed into the CUBE model, which has 3-dimensions. Delay is plotted on the X axis, jitter on the Y axis and a probability distribution function is plotted on the Z axis. This model enabled us to make assumptions about the distribution of network performance parameter values over time. If gathered correctly over a statistically significant period of time [13], this model can generalize the behavior of network performance parameters on the link. We take advantage of this property and segment the model into areas, to which weights (for IGP protocols) can be assigned. The output of this modeling is therefore a set of weights applicable to links in the network and these weights are used by our modification of Dijkstra’s and Kruskal’s algorithm [14] to determine a coherent overlay network to be used by a specific type of traffic. In our original proposal, we only focused on VoIP traffic. Two important network performance parameters for VoIP traffic are network delay and jitter [9], [10]. Other types of traffic (and possible future applications) may have different requirements and expectations. In our original concept we establish a VoIP backbone suitable for routing VoIP traffic and connecting IP telephony components. In this paper we extend this approach and generalize our methods of traffic flow optimization.. The CUBE model is also extended with support of any number of parameters modeled at any time. Originally we modeled two parameters by using a bivariate normal distribution. In n-CUBE however, the number of parameters can be n so the n-CUBE thus becomes an n-dimensional hypercube. Every dimension except one is used to plot one parameter and the final dimension is used for the multivariate normal distribution – probability density function. The general idea however, doesn’t change. The ndimensional hypercube is segmented into user-configurable areas and links are assigned weights just as in the original CUBE model. The most important extension however, is the ability to find a shortest path for a particular type of network traffic. This path can be represented by an LSP in MPLS networks and set up using an explicitly defined MPLS traffic-engineering tunnel. For this feature we use the, now well-known, class-based tunnel selection [15]. Class-based tunnel selection allows us to specify up to 8 different LSPs (the limitation is due to the number of bits in the MPLS EXP field) for forwarding traffic inside our transit network, see Fig. 2. The final extension present in the n-CUBE model is the model memory, represented by the parameter Y. The nCUBE model is designed for a continuous data feed and its optimization function as defined in [1] is triggered on a set parameters determined by the memory parameter. The memory parameter has an impact on the resulting probability density function of the multivariate normal distribution, as depicted in Fig. 3 and Fig. 4.. III. N-CUBE EXTENSION The CUBE model is extended with support of any type of network performance parameters. The type of parameter is completely abstracted and the decision of which network performance parameters to model is left on the user. Originally we modeled time parameters – delay and jitter because from our point of view these parameters were crucial for VoIP traffic. However, different types of traffic may have different requirements so the focus can be shifted to other variables if desired. For instance data (file) transmissions are adversely affected by packet loss and throughput. If those parameters can be gathered in a network, they can be fed into the n-CUBE model (regardless of type). In theory, any network parameter can be modeled (e.g. MOS, etc.). ISBN: 978-988-19252-8-2 ISSN: 2078-0958 (Print); ISSN: 2078-0966 (Online). Fig. 3 – One link modeled in n-CUBE with the memory parameter Y=3. WCE 2013.
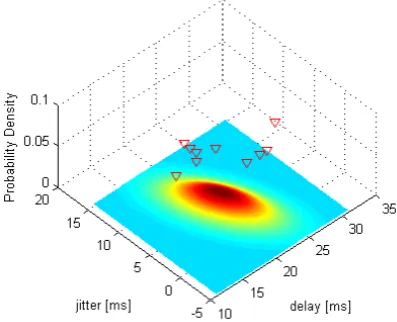
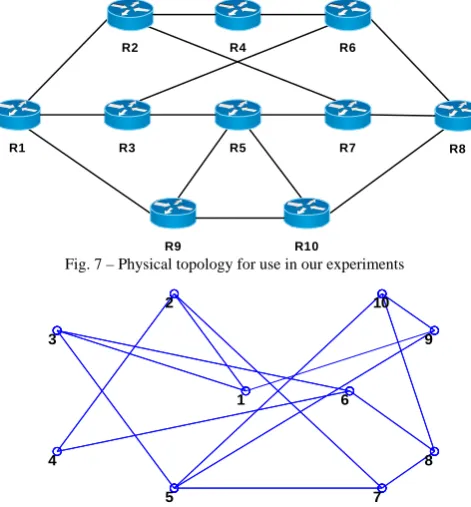
(3) Proceedings of the World Congress on Engineering 2013 Vol II, WCE 2013, July 3 - 5, 2013, London, U.K.. Data interface process. Polling process. router. common repository. Update process. n-CUBE modeling. Fig. 4 – One link modeled in n-CUBE with the memory parameter Y=10. While in the original model – CUBE, we only tested our solution on a set of randomly generated graphs to determine performance and validate its correct function; in n-CUBE we have implemented a working solution for use in a real network environment. In the following section we describe the implementation details of our system.. Fig. 5 – Functional elements of our implementation TABLE I DESCRIPTION OF IMPLEMENTATION PARAMETERS Parameter. Description. t1. defines a period of time after which data retrieval from the network takes place, in seconds Defines a period of time after which and action is triggered, in seconds (zero is instantaneous) Defines a period of time after which new data is fed into the n-CUBE for modeling , in seconds Defines a period of time after which new metrics are fed back into the network, in seconds. t2. IV. IMPLEMENTATION In this section we describe the implementation of our proposed n-CUBE model. For implementation purposes we have decided to break up functional elements into blocks. The blocks will function as separate entities with possible multiple instances per block. Blocks are defined as depicted in Fig. 5 and described below: 1) Application in the NMC – this application leverages a common existing infrastructure of the network management center which has access to all managed routers from a set of centralized jump servers. The application will feature three autonomous processes working asynchronously and achieving: a) Polling – fetching runtime variables from routers via SNMPv3 (mostly IP SLA statistics) b) Update – pushing updated configurations to routers via SSH (modification of link weights as a result of n-CUBE model weight assignment) c) Data interface – storing the fetched runtime variables into a common repository, which is accessible to all (e.g.: file, SQL database, etc.) 2) Common repository – this should be a universally, but securely accessible resource which enables fast data storage and retrieval. Consistency of data and shared access is guaranteed by underlying methods (operating system or data base). 3) n-CUBE modeling – this application will retrieve runtime data stored in the common repository and model link weights based on multivariate normal distribution of desired network performance parameters. This will be achieved by a Matlab application.. ISBN: 978-988-19252-8-2 ISSN: 2078-0958 (Print); ISSN: 2078-0966 (Online). Visualization. t3. t4. For verification purposes, the entire solution will be deployed in a network laboratory environment, depicted in Fig. 7. Our design supports clustering and segmentation and thus enables scalability for long-term use. A more detailed design diagram can be seen in Fig. 6 where functional blocks are interconnected with managed routing areas (under common control). Polling and Update processes are periodically managing their designated area (all routers within an area) at specified intervals. The interval value is configurable and it is advised to synchronize this interval to the IP SLA object frequency. The Polling process periodically sends SNMP GET messages to managed routers inside a common area to retrieve latest measurement details (IP SLA statistics) and stores each new value inside the data interface. The Update process maintains a last-known copy of the data interface (file or SQL database table) and only applies configuration changes to managed network area in case of a change and only to routers which are affected by the change. The configuration change is done by an automated agent who logs into the managed router via a secure SSH channel and applies a change configuration. Compute-servers are running a Matlab application instance accessing a particular section of the data interface (e.g. file or SQL database table). Modeling the n-CUBE is done in real-time and the data is periodically updated in configurable time intervals. Link weight updates are being fed back to the data interface at these intervals whenever a change is determined by the n-CUBE model.. WCE 2013.
(4) Proceedings of the World Congress on Engineering 2013 Vol II, WCE 2013, July 3 - 5, 2013, London, U.K.. Fig. 6 – Data flow in the logical design. Having described our implementation and all of its details, we will now proceed to experiments where we introduce artificially generated traffic into a measurement topology (see Fig. 7) and evaluate the effectiveness and correctness of our system.. We have generated traffic and IP SLA probes (end-to-end) with different markings, but prior to optimization only the routing protocol was used to determine the shortest path to the destination. This means that all traffic was forwarded along the same path, regardless of its marking. Once the optimization function was triggered, the IP SLA traffic (with a different marking, MPLS EXP=2) was suddenly being routed over a different path. Thus the measured end-to-end delay and jitter fell dramatically. In this way we optimized EXP=2 traffic and offloaded it from a congested path, thereby improving the overall perceived quality of service in that traffic class. In the following figures, we provide visualization, which is part of our optimization implementation. Prior to optimization, the default path (as chosen by the routing protocol) was 1 -> 3 -> 6 -> 8. And this was the path that all traffic was forwarded along; see Fig. 8 (no optimization path) and Fig. 9 where the optimization path is visualized. Measurement results after optimization can be seen in Fig. 10.. V. EXPERIMENTS. TABLE II TIMELINE OF EXPERIMENT 1. With our implementation we performed two sets of experiments to determine its preliminary traffic-engineering capabilities on artificially generated traffic. A. Experiment 1 In the first experiment we will generate traffic artificially as described in the previous section. During the course of the experiment, IP SLA measurement probes will be sent (in addition to being sent on every link as part of data gathering) end-to-end to quantify end-to-end performance parameters between communicating parties. All generated traffic except the IP SLA probes will be part of the same class and bears the same marking (in the MPLS domain it will be EXP=1). The IP SLA probes will be sent with a different marking (in the MPLS domain it will be EXP=2). Traffic optimization will be done for all IP SLA traffic (EXP=2). One-time optimization option was used.. R1. R2. R4. R6. R3. R5. R7. R9. R8. R10. Fig. 7 – Physical topology for use in our experiments 2. All generators start generating traffic at maximum possible rate. 10:00. Traffic optimization is triggered. B. Experiment 2 In the second experiment we will generate traffic artificially as described in the previous section. During the course of the experiment, in addition to sending IP SLA probes on each link as part of data gathering, we will send two distinct IP SLA measurement probes. One probe will be marked as EXP=4 in the MPLS domain and the other as EXP=5. Traffic generated from the first generator will be marked as EXP=5 in the MPLS domain and all other generated traffic will be marked as EXP=4. Traffic optimization will be done for traffic marked with EXP=5 and a class-based tunnel will be created to transmit all traffic marked as such. All other traffic will be sent over the original path (before or after optimization). Once the optimization was triggered, traffic marked as EXP=5 in the MPLS domain was forwarded along a new, traffic-engineered path. Thus we have redirected the flow of traffic away from the congested path. As can be seen in Fig. 11, once EXP=5 traffic was redirected to a new path toward its destination, the throughput improved also for the rest of traffic (marked EXP=4). 2. 9. 1. Action. 0:00. 10. 3. 10. 3. 9. 6. 1. 4. 8 5. Time. 7. Fig. 8 – Experiment 1 network visualization (prior to optimization). ISBN: 978-988-19252-8-2 ISSN: 2078-0958 (Print); ISSN: 2078-0966 (Online). 6. 4. 8 5. 7. Fig. 9 – Experiment 1 network visualization (after optimization). WCE 2013.
(5) Proceedings of the World Congress on Engineering 2013 Vol II, WCE 2013, July 3 - 5, 2013, London, U.K.. Fig. 11- Experiment 1 - measured round-trip time in ms (top figure) and jitter in ms (bottom figure). Fig. 10- Experiment 2 - measured throughput in kb/s (top figure) round-trip time for EXP=4 traffic in ms (middle figure) and round-trip time for EXP=5 traffic in ms (bottom figure). VI. CONCLUSION TABLE III TIMELINE OF EXPERIMENT 2 Time 2:00. Action. 10:20. two generators start generating traffic marked as EXP=4 at maximum possible rate third generator starts generating traffic marked as EXP=5 at maximum possible rate Traffic optimization is triggered. 17:00. all generators stop generating traffic. 6:00. ISBN: 978-988-19252-8-2 ISSN: 2078-0958 (Print); ISSN: 2078-0966 (Online). In this paper we proposed an extension to our model for traffic flow optimization, n-CUBE. This model enables discovery and modeling of any number and type of network performance parameters. The model now features a memory parameter which allows the user to specify the number of measurements which are taken into account. Our model assigns weights to logical network links by segmenting the n-CUBE into a finite number of areas based on statistical distributions and probabilities. Such weights can then be WCE 2013.
(6) Proceedings of the World Congress on Engineering 2013 Vol II, WCE 2013, July 3 - 5, 2013, London, U.K.. used by well-known algorithms (e.g. Dijkstra’s algorithm) to find a shortest path. We have implemented the n-CUBE model in a real environment and performed two sets of experiments so far on which we prove the trafficengineering capabilities. The traffic-engineering path can be created as an explicitly defined LSP by our implementation. In our experiments we have generated artificial network traffic into a measurement topology and then triggered network optimization by allowing our model to feed new configurations into the network. Traffic optimization can be triggered either for the entire traffic transmitted over our network or for a particular traffic class. The results of our experiments were listed in graphical output form (see Fig. 11 and Fig. 10).. [8]. [9]. [10]. [11]. [12]. VII. FUTURE WORK Our results have shown that the model, as currently implemented, is able to dynamically react to changes in the network and optimize the flow of traffic, while taking in mind the class into which the traffic belongs. Future work will involve experimentation with some parameters of our model, as described in section IV – Implementation, focusing on t3 and t4 parameters. In our experiments we have only experimented with one-time optimization. In future work, we will perform experimentation with continuous and progressive optimization options, which require long-term experiments and were not yet done. Particularly the progressive option where the t4 parameter is subject to change after successive optimization cycles is still under research.. [13]. [14]. [15]. [16]. International Workshop on Machine Learning for Signal Processing (MLSP), 2011, pp.1-6, 18-21 Sept. 2011 Wang, X.; Wan, S.; Li, L.: “Robust Traffic Engineering Using MultiTopology Routing”, In Global Telecommunications Conference, 2009, pp.1–6 Hyeongu Son; Youngseok Lee: “Detecting Anomaly Traffic using Flow Data in the real VoIP network” In 10th IEEE/IPSJ International Symposium on Applications and the Internet (SAINT), 2010, 19-23 July 2010, pp.253-256 Narayan, S.; Yhi Shi: “Application layer network performance evaluation of VoIP traffic on a test-bed with IPv4 and IPv6 LAN infrastructure” In International Conference on Computational Technologies in Electrical and Electronics Engineering (SIBIRCON), 2010, 11-15 July 2010, pp.215-219 Xu, K.; Liu, H.; Liu, J.; Shen, M.: “One More Weight is Enough: Toward the Optimal Traffic Engineering with OSPF” In Proceedings of the 2011 31st International Conference on Distributed Computing Systems (ICDCS); 20-24 June 2011; pp.836-846 Awduche, D. O.; Jabbari, B.: “Internet traffic engineering using multi-protocol label switching (MPLS)” In Computer Networks: The International Journal of Computer and Telecommunications Networking, vol. 40, no. 1; September 16, 2002; ISSN: 1389-1286; pp.111-129 Guang Cheng: ”Real-time inferring network traffic patterns” In Consumer Communications and Networking Conference (CCNC), 2011 IEEE , vol., no., pp.457-461, 9-12 Jan. 2011 Hruby, M; Olsovsky, M; Kotocova, M.: “Solving VoIP QoS and Scalability Issues in Backbone Networks” In IAENG Transactions on Engineering Technologies - Special Issue of the World Congress on Engineering 2012, Lecture Notes in Electrical Engineering, Vol. 229, ISBN 978-94-007-6189-6 Hongyun Man; Linying Xu; Zijian Li; Lianfang Zhang, “End-to-end QoS implement by DiffServ and MPLS” In Proceedings of the 2004 Canadian Conference on Electrical and Computer Engineering, vol.2, no., pp.641,644 Vol.2, 2-5 May 2004 Cisco Systems: “IP Service Level Agreement (IP SLA)”, white paper, C11-425882-00, Cisco Systems, Inc., September 2007. ACKNOWLEDGMENT We would like to thank the Institute of Computer Systems and Networks at the Faculty of Informatics and Information Technologies in Bratislava, for granting access into their network laboratories were our experiments were carried out.. REFERENCES [1]. [2]. [3]. [4]. [5]. [6]. [7]. Hruby, M., Olsovsky, M., Kotocova, M.: “Routing VoIP Traffic in Large Networks” In Proceedings of the World Congress on Engineering (WCE 2012), 4-6 July, 2012 Imperial College London, London, U.K, Vol. II. Hong Kong: International Association of Engineers, 2012, ISBN 978-988-19252-1-3, pp. 798—803 Zoric, S.; Bolic, M.: “Fairness of scheduling algorithms for real-time traffic in DiffServ based networks”. In Proceedings of 2010 IEEE 15th Mediterranean Electrotechnical Conference (MELECON); 2628 April 2010; pp.1591-1596 Vallat, W.; Ganti, S.: “Aggregation of traffic classes in MPLS networks” In 24th Canadian Conference on Electrical and Computer Engineering (CCECE), 2011, pp.1260-1263, 8-11 May 2011 Garcia-Dorado, J.L.; Finamore, A.; Mellia, M.; Meo, M.; Munafo, M.: “Characterization of ISP Traffic: Trends, User Habits, and Access Technology Impact”. In IEEE Transactions on Network and Service Management, vol.9, no.2, pp.142-155, June 2012 Haoxiang, W.: “From a Mess to Graphic Maps: Visualization of Large-Scale Heterogeneous Networks“. In Second International Conference on Computer Modeling and Simulation 2010 (ICCMS '10), vol.1, pp.531-535, 22-24 Jan. 2010 Kun-chan Lan; Tsung-hsun Wu: “Evaluating the perceived quality of infrastructure-less VoIP” In IEEE International Conference on Multimedia and Expo (ICME), 2011, 11-15 July 2011, pp.1-6 Hansen, T.J.; Morup, M.; Hansen, L.K.: “Non-parametric clustering of large scale sparse bipartite networks on the GPU” in IEEE. ISBN: 978-988-19252-8-2 ISSN: 2078-0958 (Print); ISSN: 2078-0966 (Online). WCE 2013.
(7)
Figure

Related documents
หลักการและเหตุผล มหาวิทยาลัยศิลปากร
There a lot of studies concerning the price linkage and asymmetric price transmission between the same commodities in the foreign and domestic market (see Meyer and
Mechanical loading from forces generated by body weight stimulates bone formation
This paper presents a summary of the evidence review group’s critical review of the evidence for the clinical effectiveness and cost-effectiveness of rituximab for the treatment
Further, the results of SmartPLS path model analysis showed that the relationship between workplace career programme (i.e., career planning and career management) and perceived
BIGresearch and the National Retail Federation (➔) found that toys proved a popular category among adults as well, although not as popular as the leading categories such as cloth-
Its aim is to develop a more general under- standing of the characteristics of the governance pressures and processes that are likely to be important in fl uences on
In absolute terms, given ways of living and comparing pre-industrial, industrializing and contemporary societies, the amount of personal information that is potentially knowable
