doi:10.4236/cn.2011.33016 Published Online August 2011 (http://www.SciRP.org/journal/cn)
Enterprise Service Bus: A Performance Evaluation
Sanjay P. Ahuja, Amit Patel
School of Computing, University of North Florida, Jacksonville, United States E-mail:{sahuja, n00168553}@unf.edu
Received May 31, 2011; revised June 26, 2011; accepted July 5, 2011
Abstract
The flexibility offered by an Enterprise Service Bus (ESB) in enabling various applications to exchange data makes it a very important middleware layer that is responsible for transporting data in a Service-Oriented Architecture (SOA). The popularity of the ESB has given rise to a number of commercial off the shelf (COTS) products as well as open source ESBs. In this study, we evaluated three open source ESBs and compared them both qualitatively and quantitatively. The empirical results were statistically tested to deter- mine the statistical significance of the results.
Keywords: Enterprise Service Bus, Service Oriented Architecture, Web Service, Mule, WSO2, Apache
ServiceMix, Performance
1. Introduction
The complexity of application integration for a point to
point model (Figure 1) rises substantially with every
new application that needs to communicate and share data with it. Every new application needs to have custom code written to ‘glue’ it to the existing network, and thus, increasing maintenance costs.
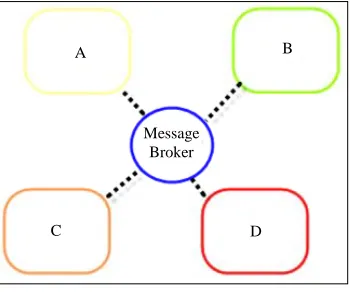
This inefficient model gave rise to a new ‘spoke and
wheel’ paradigm (Figure 2) called the Enterprise Appli-
cation Integration (EAI). In this architecture, all commu- nication is facilitated by the message broker. The mes- sage broker was designed not just for routing, but often used for data transformation as well. However, this ar- chitecture has scalability issues and introduces a single point of failure in the network.
A B
[image:1.595.82.262.563.718.2]C D
Figure 1. Point-to-point.
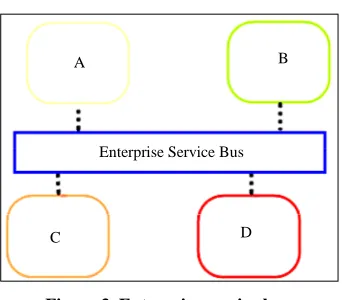
The Enterprise Service Bus (Figure 3) is an improve-
ment over these two architectures and plays a critical role in connecting heterogeneous applications and services in a Service-Oriented Architecture [1,2]. This middleware layer is responsible for not only transporting data, but also serves as a ‘transformation’ layer. This ‘transforma- tion’ of data allows legacy systems to communicate and share data with newer applications. The ESB takes on the responsibility and the burden of ensuring the data sent by the service consumers match the format requirements of the service providers. This core functionality of an ESB is a very important feature for any organization develop- ing applications with an eye towards scalability.
Routing of consumer requests and messages is another important role of the ESB. This functionality of the ESB helps simplify the integration efforts of disparate appli-
C D
B A
[image:1.595.337.512.564.710.2]Message Broker
C D B A
[image:2.595.87.258.72.222.2]Enterprise Service Bus
Figure 3. Enterprise service bus.
that need to communicate with each other. The routing decisions made by the ESB can be based upon a number of factors, such as message content, message header, and transport type. Thus, the ESB takes on the role of trans- porting the data, transforming it, and routing it to the appropriate service providers [1,3]. The ESB simplifies the task of both service consumers and service providers by adding a layer of abstraction that shields the consum- ers and the providers from having to worry about the specifics of message format or message transport.
Virtualization, or proxying, is another role that an ESB can play. In this role, the ESB acts as a proxy for the service provider and handles the requests of the service consumer. The ESB can handle authentication, authori- zation, and auditing, so the service provider can focus solely on the business logic.
Contrary to common belief, an ESB is not based solely on Web Services. Based on the Enterprise Application Integration (EAI) pattern, an ESB is a flexible and stan- dards based architecture that supports a wide array of transport mediums. Thus, an ESB is a standards-based integration platform that combines:
1) Messaging 2) Web services 3) Data transformation 4) Intelligent routing
Each ESB selected for study for this paper offers a wide array of features and enhancements like support for ‘Java Business Integration’ and ‘Business Process Exe- cution Language’. However, documenting and compre- hensively evaluating every feature of the ESB was be- yond the scope of this study. The intention was to evalu- ate the core features of the ESB, according to the metrics listed in Chapter 5. The open source ESBs selected for study and evaluation were Mule, WSO2 ESB, and Ser- viceMix.
2. ESB Core Functionality
Virtualization, Content Based Routing and Mediation are
often referred to as the three core features of an ESB. For our study, we captured metrics to evaluate the ESBs on each of these core features. To test load-handling and scalability for each scenario, we ran two sets of tests. They included:
1) Multiple clients sending a fixed payload of 100 KB. The number of clients tested was 1, 20, 40, 80, and 160.
2) A single client sending an increasing payload. The payloads tested were 1 KB, 10 KB, 50 KB, 100 KB, 500 KB, and 1 M.
2.1. Virtualization
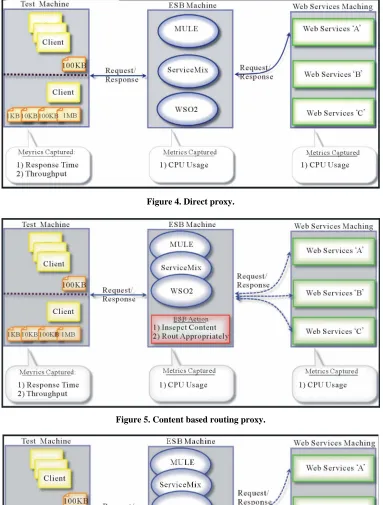
Virtualization, or proxying, is one of the core capabilities of an ESB. In this test scenario, the ESB received an in- coming request and forwarded it the real WebService, as
shown in Figure 4. There was no other processing done
by the ESB in this scenario.
The ESB received the request from the client and for- warded it to the WebService. The web service received the payload, appended a string to the payload, and sent it back to the ESB. The ESB, in turn, returned this payload to the client.
2.2. Content Based Routing
The ESB has the capability to route the incoming re- quests on a single endpoint to the appropriate service. The ESB can look at a wide array of things like the mes- sage content or the message header to determine where the request should be routed.
In this scenario, the ESB received the request from the client and inspected the payload for a keyword to deter- mine the WebService to which the request should be sent. The WebService received the payload, appended a string to the payload, and sent it back to the ESB. The ESB, in
turn, returned the payload to the client as shown in Fig-
ure 5.
2.3. Mediation
Mediation, or message transformation, is another core feature of an ESB. The ESB has the capability to take an incoming request and transform the message payload before sending it to the end WebService [4,5].
In this scenario, the ESB got a request from the client and transformed the message payload using XSLT. It then forwarded the message to the WebService as shown in Figure 6.
3. Evaluation Metrics
Figure 4. Direct proxy.
Figure 5. Content based routing proxy.
open source ESBs in this project. The metrics are used to determine performance and efficiency [6,7]. This section explains these metrics.
3.1. Mean Response Time
We calculated the Mean Response Time as the amount of time elapsed from the moment the request was sent to the time a reply was received.
3.2. Throughput
We calculated Throughput, as measured in transactions per second. A transaction was counted as successful, if it matched the expected response for the given request.
4. Statistical Analysis Methods
After retrieving the test data to compare the perfor mances, we need a method to analyze the results. Simply cal- culating the throughput or the mean response times and generating graphs is not sufficient for the analysis.
4.1. Student’s Paired T-Test
For our tests, we used Student’s Paired T-Test to validate our null hypothesis that all three ESBs would have a similar performance. Thus, the mean difference between any two ESBs compared over a set of matched pairs of data points would be zero [8].
The P-Value threshold chosen for statistical signify- cance for our tests was 0.05. Thus, if the calculated P- Value was below 0.05, the null hypothesis was rejected.
For each test, a P-Value was calculated for the metric collected: transactions per second, mean response time, ESB CPU usage, and the CPU usage of the WebServices machine. The P-Value was calculated when comparing the performance was:
1) Mule [9-11] vs. WSO2 2) Mule vs. ServiceMix [12-14] 3) WSO2 [15] vs. ServiceMix
This P-Value helped us analyze the test results by al- lowing us to focus on P-Values below the set threshold, and thus, of significance. This also helped us prove whether or not the performance of an ESB was equal to its peer, for a particular testing scenario.
5. Results and Analysis
In order to obtain the best results, each test was run a minimum of 10 times each. Testing was done using Grinder, an open source stress testing tool.
To test scalability of the 3 core scenarios for each ESB,
we configured the Grinder script file to simulate 1, 20, 40, 80 and 160 Clients. For this test, we had a fixed pay-load of 100 KB.
To test load-handling of the 3 core scenarios for each ESB, we configured the Grinder script file to simulate a single client sending varying payloads of 1 KB, 50 KB, 100 KB, 500 KB and 1MB.
5.1. Direct Proxy Scenario
The ESBs were configured to act as a proxy and forward all incoming requests to the end WebService. There was no other processing done by the ESB in this scenario.
5.1.1. Scalability Test
Each ESB had the best throughput when the number of
clients was 40, as shown in Figure 7. For 40 clients,
ServiceMix had the best throughput of 15.78TPS; while Mule had a throughput of 14.69TPS.
Mean Response times of all three ESBs increased dramatically when the number of clients exceeded 80, as
shown in Figure 8.
5.1.2. Load Handling Test
The throughputs for all three ESBs (Figure 9) were
similar, with a higher throughput when the payload was in the range of 10 KB to 100 KB. There was a drop in throughput when the payload was 1 MB. The throughput for WSO2 and ServiceMix was higher than that of Mule, regardless of the payload.
The mean response time (Figure 10) was similar for
all three ESBs for payloads up to 100 KB. The response time increased as the payloads increased. There was a rise in response times for all three ESBs once the pay- loads exceeded 100 KB. ServiceMix had a better re- sponse time than WSO2 for payloads ranging from 10 K
Scenario 1 : Direct Proxy Test 1
Fixed Payload (100K) vs Increasing # of Clients
0 5 10 15 20
# of Clients Transactions Per Second
(TPS)
Mule WSO2 ServiceMix
0.85 8.44 7.29 1.12
[image:4.595.309.537.534.701.2]1 20 40 80 160
Scenario 1 : Direct Proxy Test 1
Fixed Payload (100K) vs Increasing # of Clients
0 10000 20000 30000 40000 50000 60000
# of Clients Mean Response Time
(msec)
Mule WSO2 ServiceMix
[image:5.595.66.279.81.247.2]1 20 40 80 160
Figure 8. Mean response time for direct proxy.
Scenario 1 : Direct Proxy Test 2 Increasing Payload vs Single Client
0 0.5 1 1.5 2 2.5 3 3.5
Payload (KB) Transactions Per Second
(TPS)
Mule WSO2 ServiceMix
[image:5.595.66.278.270.628.2]1 10 25 50 100 500 1000
Figure 9. TPS for direct proxy.
Scenario 1 : Direct Proxy Test 2 Increasing Payload vs Single Client
0 2000 4000 6000 8000 10000
Payload (KB) Mean Response Time
(msec) Mule
WSO2 ServiceMix
[image:5.595.314.534.333.500.2]1 10 25 50 100 500 1000
Figure 10. Mean response time for direct proxy.
to 1 M. Mule had the highest response time when the payload exceeded 100 KB.
5.2. Content-Based Routing Proxy Scenario
The ESBs were configured to act as a proxy and forward
all incoming client requests to the appropriate end web service. The ESBs looked for a keyword in the message payload that determined the appropriate web service for the given client request.
5.2.1. Scalability Test
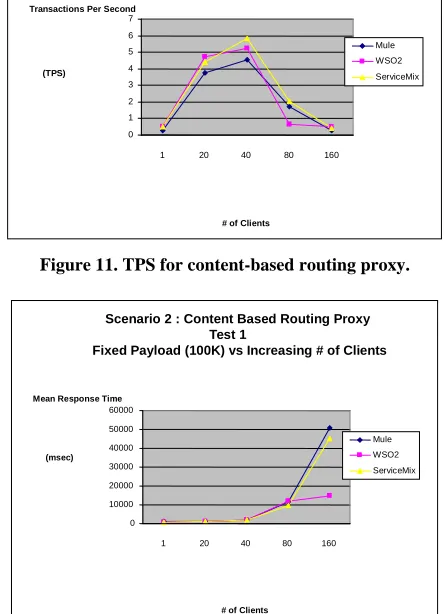
The throughput for all three ESBs (Figure 11) was
simi-lar in this test. The highest throughput achieved was by ServiceMix at 40 clients. Mule had the lowest throughput at 160 clients.
The trend of the mean response time (Figure 12) was
similar for all three ESBs. The response time increased as the number of clients increased. There was an increase in response times for all three ESBs once the number of clients exceeded 80.
5.2.2. Load Handling Test
The throughputs for all three ESBs (Figure 13) were
similar with a higher throughput when the payload was in the range of 1 KB to 100 KB. There was a drop in
Scenario 2 : Content Based Routing Proxy Test 1
Fixed Payload (100K) vs Increasing # of Clients
0 1 2 3 4 5 6 7
# of Clients Transactions Per Second
(TPS)
Mule WSO2 ServiceMix
[image:5.595.311.533.379.686.2]1 20 40 80 160
Figure 11. TPS for content-based routing proxy.
Scenario 2 : Content Based Routing Proxy Test 1
Fixed Payload (100K) vs Increasing # of Clients
0 10000 20000 30000 40000 50000 60000
# of Clients Mean Response Time
(msec)
Mule WSO2 ServiceMix
1 20 40 80 160
Scenario 2 : Content Based Routing Proxy Test 2
Increasing Payload vs Single Client
0 0.2 0.4 0.6 0.8 1 1.2
Payload (KB) Transactions Per Second
(TPS) Mule
WSO2 ServiceMix
[image:6.595.314.531.77.242.2]1 10 25 50 100 500 1000
Figure 13. TPS for content-based routing proxy.
throughput when the payload was 1 MB. ServiceMix had a better throughput than Mule, regardless of the payload size.
The mean response time (Figure 14) was similar for
all three ESBs for payloads up to 100 KB. The response time increased as the payloads increased. There was an increase in response times for all three ESBs once the number of payloads exceeded 100 KB.
5.3. Transformation Routing Proxy Scenario
The ESBs were configured to act as a proxy and forward all incoming client requests to the appropriate end Web- Service. Before the request is forwarded to the WebSer- vice, the ESBs transform the message payload using XSLT. XSLT is a very powerful tool that can be used to transform the layout and the content of the message pay- load to suit the requirements of the end application.
5.3.1. Scalability Test
The throughput for all three ESBs (Figure 15) was
simi-lar in this test. The highest throughput achieved was by ServiceMix at 40 clients. WSO2 had the lowest through- put at 160 clients.
The trend of the mean response time (Figure 16) was
similar for all three ESBs. The response time increased as the number of clients increased. There was a dramatic rise in response times for all three ESBs once the number of clients exceeded 80.
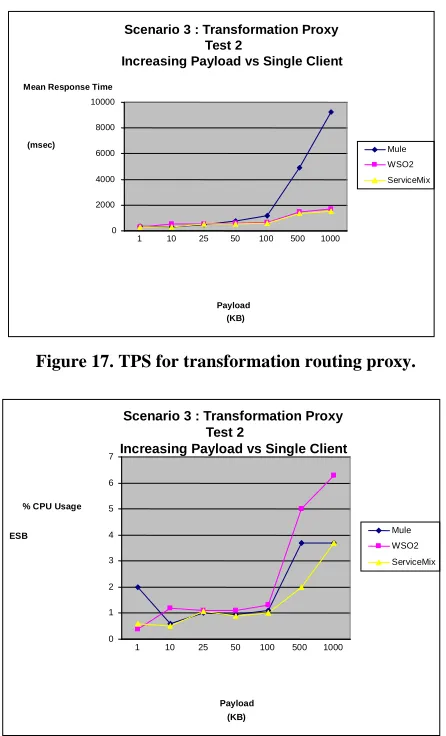
5.3.2. Load Handling Test
The throughputs for all three ESBs (Figure 17) were
similar with a higher throughput when the payload was in the range of 10 KB to 100 KB. There was a drop in throughput when the payload was 1 MB. The throughput for WSO2 and ServiceMix was similar for payloads of 25 KB and higher.
Scenario 2 : Content Based Routing Proxy Test 2
Increasing Payload vs Single Client
0 5000 10000
Payload (KB) Mean Response Time
(msec)
Mule WSO2 ServiceMix
[image:6.595.61.283.79.249.2]1 10 25 50 100 500 1000
Figure 14. Mean response time for content-based routing proxy.
Scenario 3 : Transformation Proxy Test 1
Fixed Payload (100K) vs Increasing # of Clients
0 5000 10000 15000 20000 25000 30000 35000 40000 45000
# of Clients Mean Response Time
(msec) Mule
WSO2 ServiceMix
1 20 40 80 160
Figure 15. TPS for transformation routing proxy.
Scenario 3 : Transformation Proxy Test 1
Fixed Payload (100K) vs Increasing # of Clients
0 5 10 15 20 25 30 35 40 45
# of Clients ESB
% CPU Usage
Mule WSO2 ServiceMix
1 20 40 80 160
Figure 16. Mean response time for transformation routing proxy.
The mean response time (Figure 18) was similar for
[image:6.595.320.523.283.445.2] [image:6.595.320.529.427.616.2]Scenario 3 : Transformation Proxy Test 2
Increasing Payload vs Single Client
0 2000 4000 6000 8000 10000
Payload (KB) Mean Response Time
(msec) Mule
WSO2 ServiceMix
[image:7.595.59.282.76.444.2]1 10 25 50 100 500 1000
Figure 17. TPS for transformation routing proxy.
Scenario 3 : Transformation Proxy Test 2
Increasing Payload vs Single Client
0 1 2 3 4 5 6 7
Payload (KB) ESB
% CPU Usage
Mule WSO2 ServiceMix
[image:7.595.311.538.92.234.2]1 10 25 50 100 500 1000
Figure 18. Mean response time for transformation routing proxy.
time than WSO2 for payloads between 10 K and 1 M. Mule had the highest response time when the payload exceeded 100 KB.
5.4. Subjective Observations
We established a set of criteria for our subjective as- sessment of the ESBs. We created a three point scale, with ‘A’ being the best and ‘C’ being the worst. The ESBs were assigned a score based on this scale for each criterion and the results were recorded, as illustrated in
Table 1.
6. Conclusions
Although the graphs give us visual representation how the ESB performs for a given metric, a statistical analysis is needed to give meaning to the data collected. As stated earlier, we ran ‘Student’s T-Test’ on each metric collected and looked for P-Values that were below the
Table 1. Subjective assessment.
Mule WSO2 ServiceMix
Installation A A B
Code base / Examples B A B
Ease of Development B A C
Features A B A
API / Documentation A A A
Online Help B B B
Community / Forums A A A
set threshold of 0.05. We tested our null hypothesis that all ESBs would have comparable numbers against this threshold.
Looking at the direct proxy P-Values for load handling in Table 2, throughput was comparable for all three ESBs. When we look at the direct proxy P-Values for scalability, we see a difference in throughput, when comparing Mule to ServiceMix and WSO2. The com- puted average throughput for Mule in our scalability test for direct proxy was 0.29 TPS, while the computed average throughput for ServiceMix and WSO2 were 1.79 and 1.57 TPS respectively. Thus, looking at the com- puted average throughput for the statistically significant data, we can conclude ServiceMix and WSO2 handled scalability better than Mule.
Looking at the content based routing proxy P-Values for loading handling and scalability; we saw a difference in throughput when comparing Mule to WSO2. The average throughput computed for Mule in load handling and scalability was 2.11 TPS and .46 TPS respectively. The average throughput computed for WSO2 in load handling and scalability was 2.33 TPS and 0.57 TPS respectively. Thus, looking at the computed average throughput for the statistically significant data, we can conclude that WSO2 performed better than Mule in the content-based routing scenario.
Looking at the P-Values table (Table 3) for mean
response times, we see that the only statistically signi- ficant data is for the scalability test in the direct proxy scenario and the transformation proxy scenario, com- paring WSO2 and ServiceMix.
In the scalability test of the direct proxy scenario, the computed average of the mean response times for WSO2 was 772.27 ms, whereas the computed average of the mean response times for ServiceMix was 704.36 ms. Thus, looking at the computed average response times for the statistically significant data, we can conclude that ServiceMix handled scalability better than WSO2.
Table 2. P-Values for throughput.
Direct Proxy Content Based Routing Proxy Transformation Proxy TPS
Increasing Clients
Increasing Payloads
Increasing Clients
Increasing Payloads
Increasing Clients
Increasing Payloads
Mule vs. ServiceMix 0.1485 0.0016 0.2819 0.0844 0.2595 0.3103
Mule vs. WSO2 0.3196 0.0015 0.0286 0.0015 0.4004 0.0158
[image:8.595.60.540.221.312.2]WSO2 vs. ServiceMix 0.2864 0.0859 0.1858 0.1341 0.1983 0.0835
Table 3. P-values for mean response time.
Direct Proxy Content Based Routing Proxy Transformation Proxy Mean Response Time Increasing
Clients
Increasing Payloads
Increasing Clients
Increasing Payloads
Increasing Clients
Increasing Payloads
Mule vs. ServiceMix 0.4363 0.0939 0.1853 0.0897 0.2531 0.0933
Mule vs. WSO2 0.1645 0.0860 0.0972 0.0827 0.4523 0.0851
WSO2 vs. ServiceMix 0.1899 0.0210 0.2079 0.4369 0.2535 0.0118
average of the mean response times for WSO2 was 821.12 ms, whereas the computed average response times for ServiceMix was 730.20 ms. Thus, looking at the computed average of the mean response times for the statistically significant data, we can conclude ServiceMix handled scalability better than WSO2.
7. References
[1] G. Ziyaeva, E. Choi and D. Min, “Content-Based Intelli-gent Routing and Message Processing in Enterprise Ser-vice Bus,” 2008 International Conference on Conver-gence and Hybrid Information Technology, Washington, 28-29 August 2008.doi:10.1109/ICHIT.2008.267 [2] K. Ueno and M. Tatsubori, “Early Capacity Testing of an
Enterprise Service Bus,” IEEE International Conference on Web Services, Chicago, 18-22 September 2006, pp. 709-716. doi:10.1109/ICWS.2006.57
[3] M. Luo, B. Goldshlager and L.-J. Zhang, “Designing and Implementing Enterprise Service Bus (ESB) and SOA Solutions,” IEEE International Conference on Web Ser-vices, Washington, 11-15 July 2005.
doi:10.1109/SCC.2005.43
[4] N. Fu, X. S. Zhou, K. B. Wang and T. Zhan, “Distributed Enterprise Service Bus Based on JBI,” The 3rd Interna-tional Conference on Grid and Pervasive Computing -
Workshops, Washington, May 2008, pp. 292-297. doi:10.1109/GPC.WORKSHOPS.2008.32
[5] S. Ortiz Jr., “Getting on Board the Enterprise Service Bus,” Computer Archive, Vol. 40, No. 4, pp. 15-17. doi:10.1109/MC.2007.127
[6] R. Woolley, “Enterprise Service Bus (ESB) Product Evaluation Comparisons,” Department of Technology Services, Utah Department of Technology Services, Salt Lake City, 2006.
[7] Y. Liu, I. Gordon and L. M. Zhu, “Performance Predic-tion of Service-Oriented ApplicaPredic-tions based on an Enter-prise Service Bus,” 31st Annual International Computer Software and Applications Conference, Vol. 1, 2007, pp. 327-334.doi:10.1109/COMPSAC.2007.166
[8] D. W. Zimmerman, “A Note on Interpretation of the Paired-Samples t-Test,” Journal of Educational and Be- havioral Statistics, Vol. 22, No. 3, 1997, pp. 349-360. [9] P. Aston and C. Fitzgerald, “Getting Started,” 2009.
http://grinder.sourceforge.net/g3/getting-started.html [10] J. Dirksen and T. Rademakers, “Pattern Based Devel-
opment with Mule 2.0,” 2009.
http://architects.dzone.com/articles/pattern-based-develop ment-with
[11] J. Wheeler, “What Is Mule,” 2009.
http://www.mulesoft.org/display/MULE2INTRO/What+i s+Mule,
[12] ServiceMix Overview, 2009.
http://servicemix.apache.org/home.html,
[13] J. Dutton, “Comparing Enterprise Service Bus Options for System z,” 2007.
http://www.ibm.com/developerworks/websphere/library/t echarticles/0707_dutton/0707_dutton.html
[14] Wheeler, J., “Understanding the Messaging Framework,” 2009.
http://www.mulesoft.org/display/MULE2INTRO/Underst anding+the+Messaging+Framework, last revision 2009, last accessed September 31, 2009.
[15] WSO2 ESB Documentation.