AN ECONOMIC ANALYSIS
CUDDALORE
*
Amirthalingam,
Department of Agricultural Economics,
ARTICLE INFO ABSTRACT
The growth sector clearly brought environment better augmenting objective growth clearly decreased and sugarcane
Copyright © 2018, Amirthalingam and Sita Devi. This unrestricted use, distribution, and reproduction in any medium,
INTRODUCTION
Agriculture continues to be the backbone of
in spite of the concerted efforts towards industrialization recent decades. Agriculture sector contributes
gross domestic product by sectors in India. India per cent of world’s total land area supports around of human and 15 per cent of livestock population The growth of agriculture depends on the resource use and technological progress in the appropriate cropping pattern. Cropping pattern concept as no cropping pattern can be said times to a particular region. It changes in space view to meet requirements and is governed physical as well as cultural and technological changes in cropping pattern in particular span indicate the changes that have taken place development. These changes are brought socio-economic factors and in most of the physical environment reduces the choice
altogether or by reducing their level. Agriculture important sector in Tamil Nadu state economy.
*Corresponding author: Amirthalingam, N.,
Department of Agricultural Economics, Annamalai Chidambaram, Tamil Nadu- 608 002.
DOI: https://doi.org/10.24941/ijcr.31602.08.2018
ISSN: 0975-833X
Article History:
Received 29th May, 2018 Received in revised form 25th June, 2018
Accepted 5th July, 2018
Published online 30th August, 2018
Citation: Amirthalingam and Dr. Sita Devi. 2018
International Journal of Current Research, 10, (08), 72131
Key Words:
Cropping Pattern, Growth Rate.
RESEARCH ARTICLE
ANALYSIS OF CHANGES IN THE CROPPING PATTERN
CUDDALORE DISTRICT, TAMIL NADU
Amirthalingam, N. and Dr. Sita Devi, K.
Economics, Annamalai University, Chidambaram, Tamil
ABSTRACT
growth of agriculture depends on the efficiency of resource use with an appropriate cropping pattern. The changes in cropping clearly indicate the changes that have taken place in the agricultural brought about mostly by socio-economic influence and in most environment reduces the choice of certain crops altogether or by reducing
cropping pattern optimally suited to the technological changes augmenting growth in agriculture. Keeping this view, this study has objective of analysing the trend in cropping pattern changes in Cuddalore growth rate was worked out to estimate the changes in the cropping clearly revealed that the share of major crop categories like cereals, decreased over the years in Cuddalore district. However, the share
sugarcane increased over the years, which shows the crop diversification
This is an open access article distributed under the Creative Commons medium, provided the original work is properly cited.
of Indian economy, industrialization in the contributes a high share of India with only 2.3 around 18 per cent population in the world. the efficiency of the sector with an pattern a dynamic to be ideal for all space and time with a governed largely by the technological factors. The span of time clearly in the agricultural about mostly by the situations, the of certain crops Agriculture is an economy.
Annamalai University,
.2018
Both land use pattern and cropping considerably in Tamil Nadu state. state, the share of net sown area been continuously declined from around 36 per cent in 2013-14. had declined from 79.57 lakh ha 2013-14, nearly 26 per cent of the five decades. Among the major has also registered a declining in the state, as the crop occupies cropped area. It is assumed technological factors are crucial pattern as well as cropping pattern. Nadu, specifically delta region, pattern due to inadequate rainfall Cuddalore, Villupuram, Nagapattinam, Thanjavur are the major delta
undergone many structural changes technological factors (Paramasivam studies related to agricultural information for future planning output. The adoption of better suited to the technological changes for augmenting growth of agriculture this background this study has specific objective of analysing changes in the study area. International Journal of Current Research
Vol. 10, Issue, 08, pp.72131-72136, August, 2018
8. “An economic analysis of changes in the cropping pattern in 72131-72136.
PATTERN IN
Tamil Nadu- 608 002
use and technological progress in the cropping pattern in particular span of time agricultural development. These changes are most of the situations, the physical reducing their level. The adoption of changes is an important factor for has been carried out with the specific Cuddalore district of Tamil Nadu. The cropping pattern in the district. The results cereals, oilseeds and millets has been share of pulses, plantation crops, fruits diversification in the study area.
Commons Attribution License, which permits
cropping pattern have been changed state. Though it is an agrarian area to total geographical area had from 45 per cent in 1960-61 to 14. Also, the gross cropped area ha in 1960-61 to 58.97 lakh ha in of the area has been reduced over major crops, the area under rice share to the gross cropped area occupies more than 30 per cent of total assumed that both climatic and crucial in determining land use pattern. Many regions of Tamil region, have changed the cropping rainfall and heavy downpour. Nagapattinam, Thiruvarur and delta districts which are frequently changes due to climatic and
(Paramasivam et al., 2017). Analytical
growth would provide valuable planning and projections of agricultural better cropping pattern optimally changes is also an important factor
agriculture (Gore et al., 2015). With
has been carried out with the analysing the trends in cropping pattern
INTERNATIONAL JOURNAL OF CURRENT RESEARCH
MATERIALS AND METHODS
This study has been confined to Cuddalore district of Tamil Nadu. For the present study, the major crop categories namely cereals, millets, pulses, oil seeds, fibres, fruits, plantation crops, sugar and tapioca have been selected. The study was completely based on secondary data. Area under major crops in Cuddalore district for the last 46 years i.e. from 1970 to 2016 has been collected from the Government of Tamil Nadu publications.
Tools of Analysis
Growth Rate Analysis: Compound growth rates of area under
major crop categories were estimated to capture the changes in the cropping pattern in the district. The major crop categories
considered for the analysis were cereals, millets, pulses, oil
seeds, fibres, fruits, plantation crops, sugar and tapioca. Exponential function of the following form was used to estimate the growth rate for the area under major crops (Gujarati 2012).
Yit=Ai (l+ri)t (1)
Where,
Yit - Area of ith crop at time t (ha)
r - Compound growth rate of Yi
Ai - Initial year area of i th
crop t - time in years
By taking natural logarithm of (1),
In Yit = In Ai + t In (l+ri ) (2)
Now letting
αi = In Ai
βi = In(1+ri )
Equation (2) can be written as
In Yit = α i + βi t (3)
Adding the disturbance term to (3), it can be written as
In Yit = α i + βi t + Ut
Yit = Area of ith crop at time t (ha)
t = time in years α. = constant term β = regression co-efficient
This log linear function was fitted by using ordinary least square (OLS) method. The compound growth rate (r) was obtained using the formula.
ri = (Antilog βi - 1) × 100
Analysis of Changes in Cropping Pattern: Cropping pattern
refers to the proportion of area under different crops at any given point of time in a unit area, or the yearly sequence or
spatial arrangement of crops on a given area.
In simple words, cropping pattern means the area under various crops at a point of time. The data on cropping pattern at different points of time was collected from the office of the Joint Directorate of Agriculture (JDA).
The entire study was split up in to six sub periods and is furnished below.
Period I: 1970 – 1971 Period II: 1980-1981 Period III: 1990 – 1991 Period IV: 2000 - 2001 Period V: 2010-2011 Period VI: 2015-2016
RESULTS AND DISCUSSION
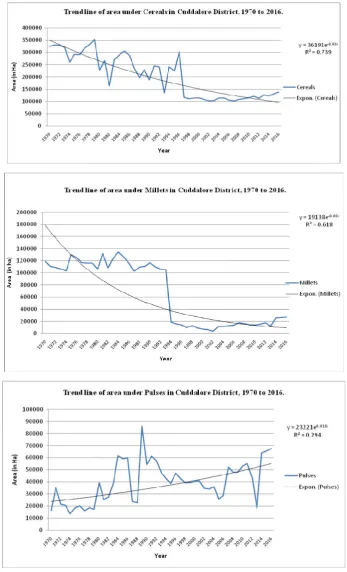
Growth rate of area under major crops in Cuddalore
district: Cropping pattern of major crops in Cuddalore district
can be ascertained through studying the growth rate of area under different crops. Hence, the compound growth rate of area under major crop categories in Cuddalore District were worked out for the period from 1970 to 2016 and the results are presented in Table 1. It could be seen from Table 1 that the area under Pulses (1.81), Fruits (3.04), Plantation Crops (8.98) and Sugar (0.70) had a positive growth rate, while the area under Cereals (-1.98), Millets (-6.12), Oil Seeds (-5.82) and Fibres (-1.98) had a negative growth rate. The area under Tapioca (0.00) had neutral growth rate. The results would indicate the shift in the cropping pattern towards the high remunerative crops from the traditional crops in Cuddalore district.
Changes in Cropping Pattern in Cuddalore district: The
area under selected major crop categories and the relative share of each crop category in the gross cropped area at different points of time have been used to study the changes in cropping pattern. The changes in cropping pattern in Cuddalore district were estimated for the period 1970-2016 and are presented in Table 2. It could be seen from Table 2 that the share of cereals in the total cropped area accounted for 48.09 per cent in 1970-71, and it has been reduced to 40.39 per cent in 2015-16. The percentage change over for area under cereal crops from 1970-71 to 1980-81 was -29.41 per cent, the percentage change over from 1970-71 to 1990-91 was -41.79 per cent, the percentage change over from 1970-71 to 2000-01 was -64.76 per cent, the percentage change over from 1970-71 to 2010-11 was -64.30 per cent, the percentage change over from 1970-71 to 2015-16 was -59.26 per cent, respectively.
The proportion of millets area accounted for 17.73 per cent in 1970-71 and has been reduced to 8.11 per cent in 2015-16. The percentage change over for the area under millets from 1970-71, to the periods 1980-81, 1990-91, 2000-01, 2010-11 and 2015-16, were -10.71, -2.12, -93.87, -88.18 and 77.81 per cent, respectively. The share of pulses area was 2.45 per cent in 1970-71, which has been increased to 20.11 per cent in 2015-16. The percentage change over from 1970-71 to 1980-81 was 138.75 per cent, the percentage change over from 1970-71 to 1990-91 was 228.83 per cent, the percentage change over from 1970-71 to 2000-01 was 145.05 per cent, the percentage change over from 1970-71 to 2010-11 was 221.88 per cent, the percentage change over from 1970-71 to 2015-16 was 298.42 per cent, respectively. The proportion of area under oil seeds accounted for 27.45 per cent in 1970-71 and has been reduced to 9.56 per cent in 2015-16. The percentage change over for the area under oilseeds from 1970-71, to the periods 1980-81, 199091, 200001, 201011 and 201516, were 10.56, 1.32, -79.88, -92.82 and -83.11 per cent, respectively.
Table 1. The compound growth rates of area under major crops in Cuddalore district, 1970-2016.
S.No Major Crop Categories Area (in Ha)
1. Cereals -1.98*
2. Millets -6.12**
3. Pulses 1.81*
4. Oil Seeds -5.82**
5. Fibres -1.98 6. Fruits 3.04*
7. Plantation Crops 8.98**
8. Sugar 0.70
9. Tapioca 0.00
Table 2. Changes in Cropping Pattern in Cuddalore District, 1970-2016
S.No Major Crops
Period I Period II Period III Period IV Period V Period VI 1980-81 1990-91 1990-91 2000-01 2000-01 2010-11 2010-11 2015-16 2015-16
1970-71 1980-81
Percentage Change over 1970-71 Percentage Change over 1970-71 Percentage Change over 1970-71 Percentage Change over 1970-71 Percentage Change over 1970-71
1. Cereals 324395 (48.09)
228990
(38.81) -29.41
188836
(29.92) -41.79
114315
(41.30) -64.76
115815
(41.90) -64.30
132145
(40.39) -59.26
2. Millets 119608 (17.73)
106795
(18.10) -10.71
117070
(18.54) -2.12
7332
(2.65) -93.87
14143
(5.12) -88.18
26541
(8.11) -77.81
3. Pulses 16511 (2.45)
39421
(6.68) 138.75
54293
(8.60) 228.83
40461
(14.62) 145.05
53146
(19.23) 221.88
65783
(20.11) 298.42
4. Oil Seeds 185145 (27.45)
165579
(28.06) -10.56
182698
(28.94) -1.32
37237
(13.65) -79.88
13288
(4.81) -92.82
31276
(9.56) -83.11
5. Fibres 2352 (0.35)
8266
(1.40) 251.44
7587
(1.20) 222.58
1807
(0.65) -23.17
6242
(2.26) 165.39
8028
(2.45) 241.33
6. Fruits 1559 (0.23)
2218
(0.38) 42.27
3656
(0.58) 134.51
4729
(1.71) 203.33
6402
(2.32) 310.65
4875
(1.49) 212.70
7. Plantation Crops
1669 (0.25)
1688
(0.29) 1.13
2360
(0.37) 41.40
29110
(10.52) 1644.15
31994
(11.58) 1816.96
31879
(9.74) 1810.07
8. Sugar 21270 (3.15)
28681
(4.86) 34.84
58219
(9.22) 173.71
36995
(13.37) 73.93
31064
(11.24) 46.05
23567
(7.20) 10.80
9. Tapioca 1985 (0.30)
8392
(1.42) 322.77
16560
(2.62) 734.26
4788
(1.73) 141.20
4282
(1.55) 115.72
3084
(0.94) 55.37
Total (1to9)
674494
(100.00) 590030
(100.00) -12.52
631279
(100.00) -6.40
276774
(100.00) -58.96
276376
(100.00) -59.02
327178
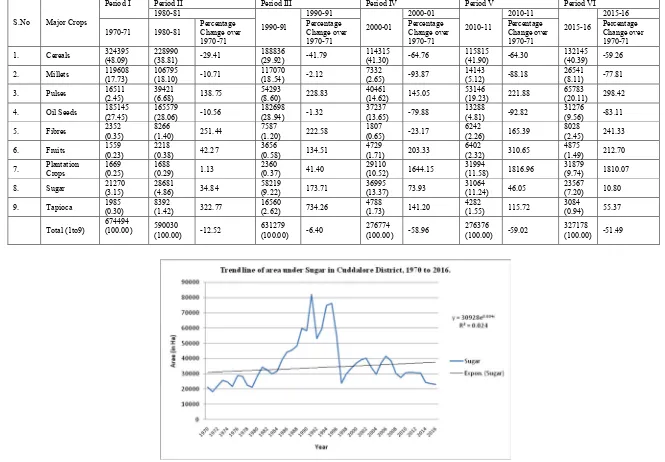
The share of fibre crops area was 0.35 per cent in 1970-71, which has been increased to a small extent, 2.45 per cent in 2015-16. The percentage change over from 1970-71 to 1980-81 was 251.44 per cent, the percentage change over from 1970-71 to 1990-91 was 222.58 per cent, the percentage change over from 1970-71 to 2000-01 was -23.17 per cent, the percentage change over from 1970-71 to 2010-11 was 165.39 per cent, the percentage change over from 1970-71 to 2015-16 was 241.33 per cent, respectively. The proportion of area under fruit crops accounted for 0.23 per cent in 1970-71 and has been increased to 1.49 per cent in 2015-16. The percentage change over for the area under fruit crops from 1970-71, to the periods 1980-81, 1990-91, 2000-01, 2010-11 and 2015-16, were 42.27, 134.51, 203.33, 310.65 and 212.70 per cent, respectively. The proportion of area under plantation crops was 0.25 per cent in 1970-71, which has been increased to a larger extent, 9.74 per cent in 2015-16. The percentage change over from 1970-71 to 1980-81 was 1.13 per cent, the percentage change over from 1970-71 to 1990-91 was 41.40 per cent, the percentage change over from 1970-71 to 2000-01 was 1644.15 per cent, the percentage change over from 1970-71 to 2010-11 was 1816.96 per cent, the percentage change over from 1970-71 to 2015-16 was 1810.07 per cent, respectively. The proportion of area under sugar crop accounted for 3.15 per cent in 1970-71 and has been to increased 7.20 per cent in 2015-16. The percentage change over for the area under sugar crop from 1970-71, to the periods 1980-81, 1990-91, 2000-01, 2010-11 and 2015-16, were 34.84, 173.71, 73.93, 46.05 and 10.80 per cent, respectively. The share of tapioca area was 0.30 per cent in 1970-71, which has been increased to 0.94 per cent in 2015-16. The percentage change over from 1970-71 to 1980-81 was 322.77 per cent, the percentage change over from 1970-71 to 1990-91 was 734.26 per cent, the percentage change over from 1970-71 to 2000-01 was 141.20 per cent, the percentage change over from 1970-71 to 2010-11 was 115.72 per cent, the percentage change over from 1970-71 to 2015-16 was 55.37 per cent, respectively.
Conclusion
The foregoing discussion clearly revealed that the share of major crop categories like cereals, oilseeds and millets has been decreased over the years in Cuddalore district. However, the share of pulses, plantation crops, fruits and sugarcane increased over the years. This shows that the district is moving towards the crop diversification by growing high remunerative crops rather than specialisation. For effective planning and implementation, agricultural development plans may be designed appropriately based on the nature and extent of crop diversification.
REFERENCES
District Statistical Office, Cuddalore District.
Gore, N.H, J.V. Lembhe and P.L. Kolekar 2015. “Performance of major crops and changes in cropping pattern in Akola
district”. International Research Journal of Agricultural
Economics and Statistics., vol. 6, issues 2, 382-385.
Gujarati, Damoder. N. 2012. “Basic Econometrics”,McGraw
Book Company, New York, p.169. https://www.indiastat.com
Paramasivam, R, M. Umanath, V. kavitha, A. Kuzhandhaivel Pillai and R. Vasanthi 2017. “Dynamics of Land Use Pattern and Cropping Pattern in Cuddalore district of Tamil
Nadu”. Asian Journal of Agricultural Extension,
Economics and Sociology., 19(3): 1-10.
Season and Crop Report (SCR), Department of Economics and Statistics, Chennai.