Copyright © 2010 SciRes. ENG
Colloidal silica can be prepared by various methods and starting materials including ion exchange of aqueous silicates, hydrolysis and condensation of silicon compounds, direct oxidation of silicon, and milling and pep-tization of silica powder. Various silica sols having particle sizes of 10-60 nm prepared by these methods and the preparation methods have been compared on the basis of their shape, size uniformity, sphericity, stability against pH variation, cation concentration, and price, etc. Silica sol prepared from tetraethoxysilane affords uniform size control and growth, and high purity, despite the relatively high costs. Silica sol prepared from liquid silicates affords relatively easy size and shape control; however, it is difficult to lower the alkali con-tent to a level that is appropriate for carrying out semiconductor chemical mechanical polishing processes; in addition, the waste water treatment carried out for recovering the ion exchange resin gives rise environmen-tal consideration. The properties of colloidal silica prepared from fumed silica powder by milling and disper-sion depend on the starting silica source and it is relatively difficult to obtain monodispersed particles using this method. Colloidal silica prepared from silicon by direct oxidation has a monodispersed spherical shape and purity control with reasonable prices. It generates less waste water because it can be directly produced in relatively high concentrations. The cation fraction located in the particle relative to the free cation in the fluid is relatively lower in the silica sol prepared by the direct oxidation than others. A careful comparison of col-loidal silica and the preparation methods may help in choosing the proper colcol-loidal silica that is the most ap-propriate for the application being considered.
Keywords: Colloidal Silica, Comparison, Preparation Methods, Shape, Cation Location
1. Introduction
Colloidal silica is a stable dispersion of solid silica parti- cles. It has found various applications such as investment casting, semiconductor wafer polishing, coating, and tex-tiles, and it has also been used as an inorganic binder, a nano-size filler, and as a catalyst precursor [1,2]. Colloi- dal silica can be prepared by various methods and starting materials, as listed in Table 1 [2]. These methods include ion exchange [3-5], neutralization or electrodialysis of aqueous silicates, hydrolysis and condensation of silane [6], peptization or milling of silica gel or powder [7], and direct oxidation of silicon [8-10].
Silicon is the second most abundant element on earth, and it commonly exists in the form of silica ore. It is dif- ficult to ensure high purity and size control of silica; the
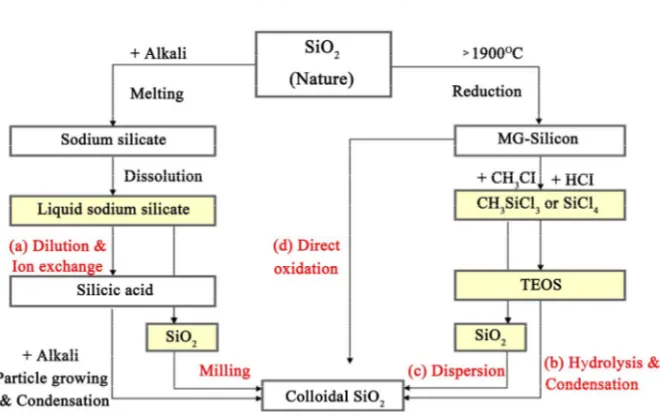
Copyright © 2010 SciRes. ENG Figure 1. Various preparation methods for colloidal silica: (a) Ion exchange from sodium silicate; (b) Hydrolysis and con-densation from TEOS; (c) Milling or dispersion from fumed silica; (d) Direct oxidation from silicon.
Table 1. Starting materials and preparation methods for colloidal silica.
Starting material Preparation method
Sodium silicate
Ion exchange Neutralization Electrodialysis
Silica gel Peptization Milling
Silicon compound Hydrolysis & Condensation
Silicon Direct oxidation
Electrolysis
kali solution to form a silica seed, which is then used to grow silica particles. The product is concentrated to 30 wt% to obtain the commercial product. The second me-thod for preparing colloidal silica is from tetraethox- ysilane (TEOS), which is well known as the Stöber me-thod [6]. TEOS is a silane monomer prepared from te-trachlorosilane, which in turn is derived from metallur-gical-grade silicon. The silicon itself is obtained by the reduction of naturally occurring silica ore at temperature over 1900°C in the presence of carbon. The third method is that of direct oxidation of silicon wherein colloidal silica is prepared by the direct oxidation of metallurgical grade silicon without using TEOS. The silicon is treated with water in the presence of alkali catalysts to produce silica along with the evolution of hydrogen and heat. Finally, the fourth method for preparing colloidal silica is by milling and peptization of silica that can be found either in the form of silica gel or fumed silica, which consists of preferentially coaccervated or aggregated primary silica particles. The properties of the colloidal silica prepared by this route largely depend not only on the milling and peptization process but also on the prop-
erties of the starting silica source such as purity, shape, and aggregation.
Colloidal silica is often defined by its solid content, counter ion type and concentration, pH, and particle size of silica. However, when we used colloidal silica in var-ious applications, we observed a few differences in the results, and therefore, we compared the characteri- stics of colloidal silica on the basis of the preparation method employed and starting materials used. A careful compar-ison of colloidal silica and the preparation meth- ods may help in choosing the method that is the most appropriate for the application being considered.
2. Experimental
2.1. Colloidal Silica Prepared from Various Preparation Methods
Seven colloidal silica samples having different particle sizes and preparation methods are listed in Table 2. They were prepared by ion exchange of sodium silicate, hy-drolysis and condensation of TEOS, milling and disper- sion of fumed silica, and direct oxidation of silicon. The nominal size of their particles is 10, 30, and 60 nm and their concentration was adjusted to 10 wt% with pH ~10 for the sake of comparison.
The colloidal silica prepared from sodium silicate by ion exchange has been described in detail in previous reports [3-5]. Samples with a nominal particle size of 10 nm and 60 nm (IE-10 and IE-60, respectively) were pre- pared by controlling the concentration, alkali source, and the particle growing step.
[image:2.595.63.283.344.439.2]Copyright © 2010 SciRes. ENG
materials (TEOS, water, alcohol cosolvent, and alkali cata-lyst), temperature, reaction time, etc. The base fluid ob-tained after the synthesis of colloidal silica is a mixture of water and ethanol. Therefore, the base fluid is replaced with water through centrifugation three times at 10000 rpm for 60 min. Subsequently, its pH was adjusted to result in an alkaline solution.
The colloidal silica obtained from fumed silica was prepared by the dispersion of fumed silica (150 G, To-kuyama, Japan) using KOH such that the pH of the slurry was adjusted to ~10. The average silica particle size of the first dispersed phase obtained by means of ultrasonic- fication is approximately 250 nm; therefore, it was fur- ther milled in the presence of 0.5-mm-diameter zirconia beads using a sand mill (ALESCO) or nanofluidizer (M-110P, Microfluidics) to obtain an average particle size that is half the starting value, as measured by the dynamic light scattering method. The primary particle size obtained from fumed silica, as measured by a trans- mission electron microscope (TEM), is much smaller than the final average particle size obtained after milling, as measured by the light scattering method; therefore, the aggregated primary particles were not separated further. The primary particle size obtained from fumed silica was approximately 30 nm, as measured by a TEM, and hence, the sample is called MD-30.
Colloidal silicas having two different average particle sizes, 10 nm and 60 nm (DO-10 and DO-60, respect- tively) were prepared by the direct oxidation of silicon. The preparation method of direct oxidation has been de- scribed in detail in previous reports [8,9].
2.2. Characterization
The primary particle size and shape of colloidal silica particles was examined by a TEM (2000EX, JEOL) at 200 kV. The 10 wt% sol was diluted to 0.5 wt% using distilled water along with NaOH so that the pH of the diluent was adjusted to 9.5. The diluted sol was subjected
dynamic light scattering method. The sample was diluted to 0.5 wt% to measure the zeta potential using a dynamic light scattering spectrometer (ELS-8000, Photal, Otsuka). The zeta potential curve, which shows the pH vs. the zeta potential, is obtained by preparing the colloidal silica and by varying its pH using HNO3 and KOH.
The stability of the colloid is very important from the viewpoint of practical applications. It was measured by observing the aggregation or agglomeration at various pH conditions, and the turbidity was measured using Turbiscan (Turbiscan Lab, Formulation).
The cation concentrations of colloidal silica were de- termined by inductively coupled plasma optical emission spectroscopy (ICP-OES, OPTIMA 5300 DV, Perkin- Elmer). The cation concentrations of the base fluid were also checked by ICP-OES with the base fluids being se-parated out from the silica colloid by high-speed cen- trifugation.
The template is used to format your paper and style the text. All margins, column widths, line spaces, and text fonts are prescribed; please do not alter them. You may note peculiarities. For example, the head margin in this template measures proportionately more than is customa-ry. This measurement and others are deliberate, using specifications that anticipate your paper as one part of the entire proceedings, and not as an independent document. Please do not revise any of the current designations.
3. Results and Discussion
[image:3.595.76.518.94.183.2]whe-Copyright © 2010 SciRes. ENG
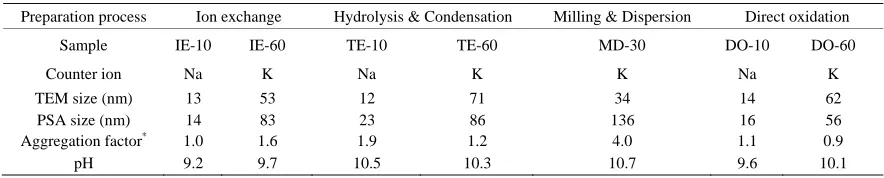
reas colloidal silicas having a primary particle size of 30 nm were prepared by the dispersion of fumed silica. For some samples, the average particle size measured by TEM image analysis matches the nominal size and the average particle size measured by the dynamic light scattering method is larger than the primary particle size measured by TEM. The aggregation factor is defined by the ratio of the PSA size to the TEM size, and it serves as an indication of the extent of the aggregation of primary particles to form secondary particles. In the case of si-lica sols having a nominal particle size of 10 nm, the sample prepared by hydrolysis and condensation of TEOS (TE-10) has an aggregation factor that is higher than that of the samples prepared by other methods (IE-10 and DO-10), whereas for 60 nm silica sols, the sample pre-pared by the ion exchange of sodium silicate (IE-60) has a higher aggregation factor than that of the samples pre-pared by other methods (TE-60 and DO-60). The MD-30 sample has the highest aggregation factor (4.0) among all seven samples.
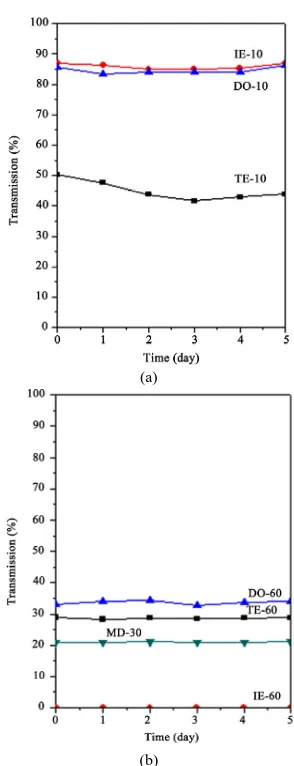
The colloids having a nominal particle size of 10 nm are generally more transparent than those having a size of 60 nm. The smaller the size of the particle and the lesser the extent of aggregation, the higher was the transmittance. According to the transmittance plot for one day shown in Figure 2, all seven samples do not settle down or aggregate within the observation period. The transmittance of IE-10 and DO-10 is the highest and that of TE-10 is greater than that of the 30-nm and 60-nm colloids but lower than that of IE-10 and DO-10 because it has the highest aggregation factor among IE-10, DO-10, and TE-10. The transmittance of 60 nm colloids decreases in the order of DO-60, TE-60, and IE-60. The MD-30 sample has a primary particle size that is smaller than that of DO-60, TE-60, and IE-60; however, its transmittance is lower than that of DO-60 and TE-60 and greater than that of IE-60.
The zeta potential curves of 10-nm and 60-nm samples are generally similar to each other (-) in that for basic conditions (pH higher than 7), the zeta potential increas-es with a decrease in pH such that the isoelectric point (IEP) is located at a pH value of approximately 3 ( Fig-ure 3).
The zeta potential curves of DO-60, TE-60, and IE-60 are also similar to each other (-) in that for basic condi-tions, the zeta potential increases with a decrease in pH. However, in this case, the IEP is slightly smaller than that for 10-nm samples and the slope of the curve is slightly steeper between pH 2 and 4 as compared to that for the 10-nm colloids; therefore, the 60-nm samples have large absolute zeta potential values over a wider pH range of 4-10, whereas the 10-nm samples have large absolute zeta potential values only in the pH range of 7-10. This indicates that the stability of the silica sol
(a)
[image:4.595.349.496.72.455.2](b)
Figure 2. Comparison of change in transmittance with time for different samples of colloidal silica: (a) IE-10, TE-10, and DO-10; (b) IE-60, TE-60, DO-60, and MD-30.
[image:4.595.308.537.503.676.2]Copyright © 2010 SciRes. ENG
[image:5.595.131.464.509.694.2]settle down even after centrifuge at 10,000 rpm for 1 h so that the difference in the stability of DO-10, TE-10, and IE-10 was not observed through centrifugation.
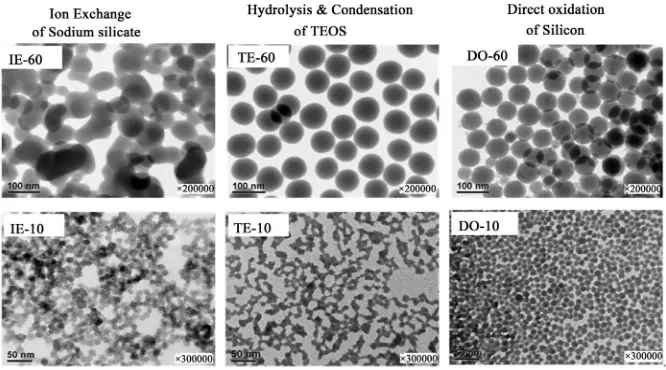
Figure 4 shows the TEM images of various silica sols, enabling a comparison of the silica particles in terms of their primary particle size and shape. The similar primary particles of the 60-nm samples (IE-60, TE-60, and DO-60) are compared. The IE-60 sample is aggregated as may be expected from its aggregation factor (1.9), whereas the TE-60 and DO-60 silica samples are mono-dispersed. Among the 60- and 10-nm colloids, the aggregation fac-tor is largest for IE-60 and TE-10, respectively. The TEM image of the MD-30 sample is shown at low and high magnification in Figure 5, wherein the intercon-necting bonds of the primary parti- cles are not fully se-parated even after milling for 1 h. It should be noted that the cohesion between the particles originating from the spray pyrolysis step of the fumed silica preparation pro-duced bridged primary particles, which are difficult to
samples and the direct-oxidation samples.
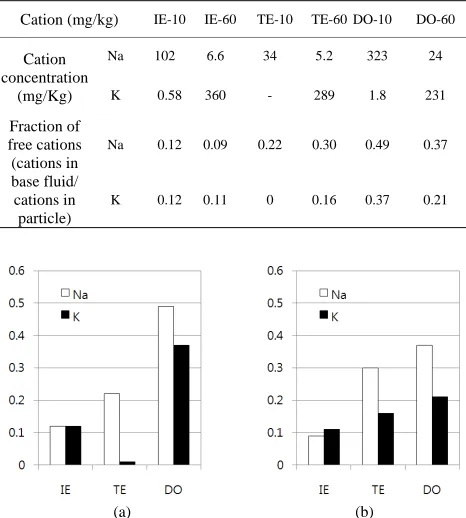
It is very interesting to note the concentration of Na in the base fluids, as shown in Table 4. The ion concentra- tion after the separation of silica particles is considerably low in the IE and TE samples, however, the ion concen- tration in the DO-10 and DO-60 samples is not as low as that in other samples. The cations present in the base fluid are known as free cations, those on the surface of silica, as bound cations; and those in the silica, as incur- porated cations. By comparing the cation concentrations in the base fluid (Table 4) and the cation concentrations in the silica colloid, it is found that the difference be- tween the cation concentrations in the base fluid and in the silica colloid is larger in IE and TE samples than DO samples. It can be characterized by the fraction of free cations, which is the ratio of cation concentration in the fluid divided by cation concentration in the particle ( Ta-ble 4 and Figure 6). The cation concentration is lower in the TE-10 sample but the fraction of free cations is the
Copyright © 2010 SciRes. ENG Figure 5. TEM morphology of colloidal silica in MD-30.
Table 3. ICP analysis of cations in colloidal silica (mg/kg).
Cation IE-10 IE-60 TE-10 TE-60 DO-10 DO-60
Na 911 81.7 189 22.4 988 89.4
K 5.1 3468 21.5 2011 6.7 1322
Ca 21.6 1.8 - - 2.4 3.8
Fe 8.7 0.8 3.0 0.3 2.1 0.8
Table 4. ICP analysis of cations in base fluid of colloidal silica and fraction of cations in base fluid.
Cation (mg/kg) IE-10 TE-10IE-60 TE-60 DO-10 DO-60
Cation concentration
(mg/Kg)
Na
102 6.6 34 5.2 323 24
K
0.58 360 289- 1.8 231
Fraction of free cations (cations in base fluid/ cations in particle) Na
0.12 0.09 0.22 0.30 0.49 0.37
K
0.12 0.11 0.160 0.210.37
(a) (b)
Figure 6. Comparison of fraction of free cation in (a) 10 nm samples and (b) 60 nm samples.
lowest in the IE-10 sample. This allows us to postulate that the fraction of free cations, i.e., the proportion of the total number of cations present in the particle, differs depending on the preparation methods. The fraction of free cations in DO samples is larger than that in IE and TE samples. In other words, the number of cations lo-cated in the silica particles in DO samples is lower than that in the IE and TE samples; therefore, the elimination of sodium cations is relatively easier in the DO-10 and
DO-60 samples and can be carried out by an additional washing step such as centrifugation or ultra membrane filtration to produce silica sol with lower cation concen- tration.
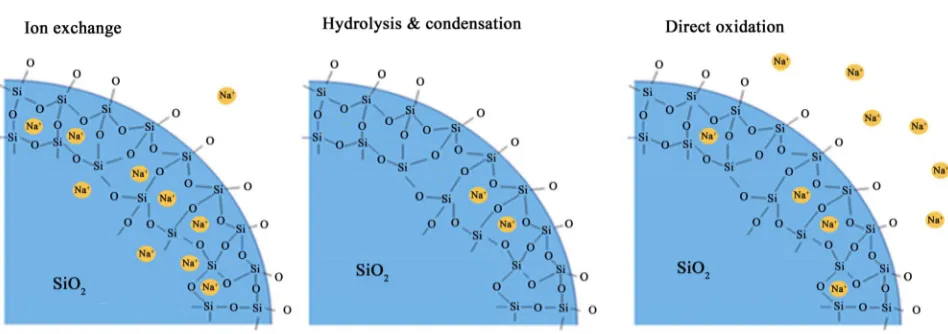
Although the schematic plot shown in Figure 7 at- tempts to classify the samples based on the number of Na cations present in the particle and the fluid, the cations could either be present inside the particle or be exposed on the surface. However, the fractions of cation in the fluid of 10 nm samples are overall higher than that of 60 nm samples, which could imply that the cation is incor- porated inside the particle rather than the surface. If it is located on the surface of silica, the higher amount of Na would be attached on the surface of silica due to higher surface area, so that the lower fraction of Na is expected in 10 nm samples. The disparity in the location of the cations can be well understood by considering the reac- tion mechanism of each preparation method. The IE samples were prepared from sodium silicates, and hence, the incorporation of sodium ions in the particle is un- avoidable; therefore it is difficult to completely eliminate the cations by ion exchange in the extreme limit, such that the concentration of cations is lower than 10 ppm at 10 wt% concentration of solid contents in the silica col-loid. However, the DO samples were prepared from sili-con in the presence of an alkali catalyst, where the alkali molecule helps to dissolve the silicon molecule to form a hydrolyzed silicon monomer, which undergoes conden- sation to form a Si-O-Si bridge with another hydrolyzed silicon monomer; therefore, the alkali catalyst acts as a carrier and helps in carrying silicon molecules one by one from the silicon powder to form a silica.
[image:6.595.56.289.314.573.2] [image:6.595.55.290.314.574.2]Copyright © 2010 SciRes. ENG dium silicate and (b) by direct oxidation of silicon.
Table 5. Comparison of preparation methods of silica sol.
Class Ion exchange Hydrolysis &
Condensa-tion Dispersion Direct oxidation
Starting
Materi-al Sodium silicate Si(OCH2CH3)4 Silica Silicon
Main Reaction
Dilution Ion exchange
Growing Concentration
Hydrolysis & Condensation Concentration
Milling or dispersion concentration
Oxidation Filter
Aggregation Some
aggrega-tion Mono disperse Aggregation Mono disperse
Imurity High Lowest Low Low
Price Reasonable High Reasonable Reasonable
Advantage Easy size control Monodisperse
High purity
High purity
One step for organic solvent based fluid
Reduced waste water No need for concentration
Control of Na
Disadvantage
Residual Na Recycle of ion exchange resin
Recycle of solvent
High price Size & shape limitation Filter process
rity and shape control depending on the preparation me-thods, so that it might be useful for whom uses silica sol in various application.
5. Acknowledgements
This study was supported by the Energy Resources Technology R&D program (R200811049) under the Ministry of Knowledge Economy, Republic of Korea.
6. References
[1] C. C. Payne, “Applications of Colloidal Silica: Past, Present, and Future,” In: H. E. Bergna, Ed., The Colloid Chemistry of Silica, Advances in Chemistry, Series 234, Chapter 29, American Chemical Society, Washington DC, 1994, pp. 581-594.
[2] R. K. Iler, “The Chemistry of Silica,” Wiley, New York, 1979, pp. 331-337.
[3] A. Yoshida, “Silica Nucleation, Polymerization, and Growth Preparation of Monodispersed Sols,” In: H. E. Bergna, Ed., The Colloid Chemistry of Silica, Advances in Chemi-stry, Series 234, Chapter 2, American Chemical Society, Washington DC, 1994, pp. 51-62.
[4] M.-S. Tsai, P. Y. Huang and W.-C. Wu, “The Study of Formation Process of Colloidal Silica from Sodium Silicate,”
Materials Research Bulletin, Vol. 40, No. 9, 2005, pp. 1609-1616.
[5] M.-S. Tsai, “The Study of Formation Colloidal Silica via Sodium Silicate,” Materials Science and Engineering: B, Vol. 106, No. 1, 2004, pp. 52-55.
[6] W. Stöber, A. Fink and E. Bohn, “Controlled Growth of Monodisperse Silica Spheres in the Micron Size Range,”
Journal of Colloid and Interface Science, Vol. 26, No. 1, 1968, pp. 62-69.
[7] Y.-K. Lee, Y. R. Yoon and H.-K. Rhee, “Preparation of Colloidal Silica Using Peptization Method,” Colloids and
Copyright © 2010 SciRes. ENG
[8] H. M. Lim, H. C. Shin, S. H. Huh and S. H. Lee, “Effect of Catalyst on the Colloidal Silica Particle Growth in Di-rect Oxidation of Silicon,” Solid State Phenomena, Vol. 124-126, 2007, pp. 667-670.
[9] W. K. Na, H. M. Lim, S. H. Huh, S. E. Park, Y.-S. Lee and S. H. Lee, “Effect of the Average Particle Size and the Surface Oxidation Layer of Silicon on the Colloidal
Silcia Particle through Direct Oxidation,” Materials Science and Engineering: B, Vol. 163, No. 2, 2009, pp. 82-87.