ISSN Online: 2157-9458 ISSN Print: 2157-944X
DOI: 10.4236/fns.2019.108065 Aug. 12, 2019 900 Food and Nutrition Sciences
Phytochemicals Screening, Phenolic Estimation
and Evaluation for Anti-Oxidant,
Anti-Inflammatory and Anti-Microbial Activities
of Sequentially Soxhlet Extracted Coconut Testa
Sashi Bhusan Ojha, Shaktirekha Roy, Soumya Das, Gunanidhi Dhangadamajhi
Department of Biotechnology, North Orissa University, Baripada, Odisha, India
Abstract
Background: In many coconut industries, the outer layer of thin brown skin of coconut kernel known as testa is peeled out as a byproduct. Despite the testa is rich in fat and plenty of polyphenolic compounds, it has been underu-tilized either as animal feed, serving as raw materials for bio-diesel produc-tion or discarded directly. Anticipating coconut testa (CT) as a natural source of multiple phyto-chemicals, its exploitation for the pharmacological activity or utilization as value added product is required which may reduce the dis-posal costs as well. Methods: Secondary metabolites from CT were extracted sequentially with different organic solvents based on polarity in the soxhlet apparatus followed by extraction with sterilized water. The crude dried ex-tracts thus prepared were evaluated for qualitative screening of phytochemi-cals and quantitative estimation of total phenols, flavonoids and tannin con-tent. Moreover, the antioxidant, anti-inflammatory and anti-microbial activi-ties were also investigated. Results: Phytochemicals screening revealed the presence of polyphenolic compounds in methanolic fraction including phenols (822.60 ± 16.36 mg/g), flavonoids (103.30 ± 9.78 mg/g) and tannin (663.50 ± 19.26 mg/g), whereas non-phenolic compounds were present in other fractions. While methanolic fraction showed invariably the highest anti-oxidant activity in multiple assay methods, non-phenolic compounds in aqueous and chloro-form fractions exhibited high anti-inflammatory activity. Antimicrobial activity was observed by both phenolic and non-phenolic compounds. Conclusion: The findings of the study reveal that CT is a rich source of various polyphenolic and non-phenolic natural antioxidants, anti-inflammatory and antimicrobial compounds. These findings are promising and form the basis to identify the number of active components and their characterization.
How to cite this paper: Ojha, S.B., Roy, S., Das, S. and Dhangadamajhi, G. (2019) Phytochemicals Screening, Phenolic Esti-mation and Evaluation for Anti-Oxidant, Anti-Inflammatory and Anti-Microbial Activities of Sequentially Soxhlet Extracted Coconut Testa. Food and Nutrition Sciences, 10, 900-922.
https://doi.org/10.4236/fns.2019.108065
Received: June 25, 2019 Accepted: August 9, 2019 Published: August 12, 2019
Copyright © 2019 by author(s) and Scientific Research Publishing Inc. This work is licensed under the Creative Commons Attribution International License (CC BY 4.0).
DOI: 10.4236/fns.2019.108065 901 Food and Nutrition Sciences
Keywords
Coconut Testa, Phytochemicals, Anti-Oxidant, Anti-Inflammatory, Anti-Microbial, Soxhlet Extraction
1. Introduction
Coconut (Cocos nucifera L.) belongs to the family Arecaceae [Palmae] and the subfamily Cocoideae is an important monocotyledon plant widely grown in the tropic and sub-tropics [1]. Further, certain religious and traditional values of coconut in most parts of India and other South East Asian countries have fared the production and productivity of coconut in these countries much better than many other countries. The coconut palm is sometimes referred to as ‘great nut of India’ owing to the use of all of its parts in some way or the other in coco-nut-growing areas. Apart from the use of coconut water, the natural sterile liq-uid from the young immature coconuts as a beverage; the kernel is used as the source of food and oil. Further, the wastes such as shell or coir are also used as raw materials for many industries for the production of shell-activated carbon or fibers for car seats and other household materials [2] [3] [4]. With the increasing demand for coconut oil, preparation of desiccated coconut powder or other products such as coconut cream and milk powder, the thin brown skin of coco-nut kernel known as testa is peeled out and processed in many cocococo-nut indus-tries and the byproduct testa is usually underutilized. Of the more than 93 coun-tries growing coconut Worldwide, India ranks 3rd by producing about 12,000 -
14,000 metric tons coconut annually, which contributes to about 19.3% of total coconut production of the World [5]. In an estimate, it has observed that the coconut testa (CT) constitutes about 18% of the total dry weight of kernel [6]
and that about 23.7 thousand tons testa are produced in Hainan Island annually
DOI: 10.4236/fns.2019.108065 902 Food and Nutrition Sciences
of plant materials and presence of various compounds [17] [18] [19]. A previous study examining for identification of suitable solvent system for maximum extrac-tability from the coconut testa has revealed significant differences in total phenolic content (TPC) and total flavonoid content (TFC) with antioxidant potential in various solvent systems studied [9]. However, to date, only ethanolic extract of de-fatted coconut testa has been analyzed for the qualitative and quantitative deter-mination of phytochemicals [20]. Moreover, the ethanolic extract of testa has been found to possess anti-hyperglycaemic activity [8], exhibit inhibition effect on the oxidation of human low-density lipoprotein [21] or evaluated for cosmeceutical potentials [22] [14]. Further, the ethanolic extract of coconut testa has been shown to contain more natural anti-oxidants compared to kernel oil [20]. The oil extracts of testa have also been proved to be protective against oxidative damage induced by reactive oxygen species [23] [21]. Despite the fact of testa as a natural source of multiple phyto-chemicals, its exploitation for potential human health benefits is yet to be achieved. Utilization of coconut testa as value added product may have the economic and environmental impacts of reducing the disposal costs.
Therefore, in the present study secondary metabolites from coconut testa (CT) were extracted sequentially using organic solvents [Petrolium benzene, chloroform, ethyl acetate and methanol] and water based on polarity in soxhlet apparatus and evaluated for qualitative screening of phytochemicals. Besides, with the aim at exploring the potential benefit, the different solvent extracts of coconut testa were evaluated for quantitative estimation of total phenols, flavo-noids and tannin content. Moreover, the antioxidant activity, anti-inflammatory activity and anti-microbial activity were also investigated.
2. Materials and Methods
2.1. Collection of Sample
Healthy coconutswere collected in sterile plastic bags from the different locality of Baripada, Mayurbhanj, Odisha and processed to peel off the thin, brown outer covering of kernel called the testa with the help of a scraper. These peeled off testa were then allowed to shed dry for 10 - 15 days followed by pulverization into coarse powder using the blender.
2.2. Extraction of Metabolites from Selected Plant Parts
DOI: 10.4236/fns.2019.108065 903 Food and Nutrition Sciences
labeled and kept at RT until further use.
2.3. Phytochemical Screening
Preliminary qualitative screening for the presence of various phytochemicals was carried out using the protocols of Sheel et al. [24], Nanna et al. [25], Mishra et al.
[26], and Sharma et al. [27].
2.4. Estimation for Total Phenolic Content
The total phenolic content in various solvent fractions of CT was determined based on Ebrahimzadeh et al. [28], with partial modification. Briefly, each of the solvent extracts and gallic acid was reconstituted to a concentration of 1 mg/ml with 10% DMSO in distilled water, except for aqueous extract which was dis-solved with water only. Then, 1 ml of various concentrations of gallic acid [100 - 500 μg/ml at 100 μg interval] in distilled water was mixed with 5 ml of Fo-lin-Ciocalteau’s (FC) phenol reagent [diluted to 10 fold with water]. After 3 mi-nutes, 4 ml of 7.5% [w/v] Na2CO3 in water was added to the mixture and
incu-bated in dark for 20 min at room temperature [25˚C]. Similarly, 1ml [100 μg/ml] of various solvents extract in triplicates was processed. The absorbance was read against the blank containing FC reagent, Na2CO3 and water without any extract or
gallic acid at 760 nm. A calibration curve was constructed from the absorbance of known concentrations of Gallic acid. TPC was calculated from the calibration eq-uation for gallic acid y = 0.006x + 0.348, R2 = 0.976 [where y is absorbance and x
is the concentration of gallic acid in μg/ml] for each extract in triplicates and ex-pressed as mg of gallic acid equivalents [mg GAE]/g of plant extract.
2.5. Estimation for Total Flavonoid Content
The total flavonoid content was determined by the Aluminum chloride colori-metric method described by Islam et al. [29], with minor modification as de-tailed below. Quercetin was used instead of gallic acid as standard. Dilution of plant extracts and quercetin were carried out as mentioned previously in this pa-per for total phenol estimation. To 0.5 ml of various concentration of quercetin [25 - 400 μg/ml at two fold dilution] and plant extracts [100 μg/ml], 1.5 ml of 95% ethanol was added followed by addition of 0.1 ml of 10% aluminum chloride and 0.1 ml of 1 M potassium acetate buffer. Then, 2.8 ml of distilled water was added to the reaction mixture and it was incubated for 30 min at room temperature, after which its absorbance was read at 415 nm against the blank [which does not con-tain either quercetin or CT extract]. A calibration curve was constructed from the absorbance of different known concentrations of Quercetin. TFC was calculated from the calibration equation for quercetin y = 0.004x + 0.103, R2 = 0.996 and the
results were expressed as mg of quercetin equivalents per g of extract.
2.6. Estimation for Total Tannin Content [TTC]
DOI: 10.4236/fns.2019.108065 904 Food and Nutrition Sciences
following the protocol of Makker et al. [30], with modification as described. Briefly, 1 ml of various concentration of tannic acid [3.125 - 100 μg/ml with two fold dilution] or triplicate solvent extracts [50 μg/ml] in 50% methanol were mixed with 2 ml of 1 mg BSA/ml in acetate buffer [0.2 M, PH 4.8]. The blank had 1 ml of 50% methanol mixed with 2 ml BSA. After incubation at RT for 30 minutes, these were centrifuged at 3000 g for 15 minutes. The supernatant was discarded in all and to the pellet 1 ml of 1% SDS, 3 ml of 7% triethanolamine in 1% SDS and 1 ml of ferric chloride [0.01 M in 0.1 M HCl] were added. This was followed by incubation at RT for 30 minutes and the absorbance was recorded at 510 nm against the blank. From the calibration curve constructed by absorbance of different known concentrations of tannic acid, TTC was calculated from the equation for tannic acid y = 0.002x + 0.085, R2 = 0.994 and expressed as mg of
tannic acid equivalents per g of solvent extract.
2.7.
In Vitro
Antioxidant Activity
2.7.1. DPPH Assay
The scavenging activity of different solvent extracts to DPPH [2,2-diphenyl-1-picryl hydrazyl] radical was measured following the method as described in Chang et al. [31], with slight modification. About 1.5 ml of different concentrations of test extract [3.125 - 100 μg/ml] in 10% DMSO was mixed with 1.5 ml of DPPH [0.1 mM] solution in methanol. A mixture containing the equal volume of DPPH and 10% DMSO served as control. The samples were incubated in dark at RT for 30 minutes and absorbance was recorded at 517 nm against methanol as a blank. Ascorbic acid, gallic acid, quercetin, tannic acid and BHT were taken as positive controls. Percent DPPH inhibition was calculated using the following formula:
[
]
[
]
{
}
[
]
% DPPH inhibition= OD control OD sample OD control− ×100 (1)
2.7.2. ABTS Assay
The ABTS [2,2’-Azino-bis-[3-ethyl]benzothiazoline]-6-sulfonic acid diammo-nium salt] assay was carried out following the method described in Re et al. [32]. Briefly, the reaction was initiated by adding 0.3 ml of various concentrations [3.125 - 100 μg/ml at two fold dilution] of solvent extracts in 10% DMSO with 2.7 ml of diluted ABTS [prepared by reacting 7 mM ABTS and 2.45 mM potas-sium persulfate at room temperature in the dark for 16 h and the ABTS working solution was obtained by further dilution with methanol to give an absorbance of 0.85 ± 0.20 at 734 nm]. The control sample had 0.3 ml of 10% DMSO mixed with 2.7 ml of ABTS. The absorbance was read at 734 nm against a blank [a mixture of 10% DMSO and ethanol] after 60 minutes of incubation in dark at RT. The percentage of inhibition was calculated using Equation (1). Ascorbic acid, gallic acid, tannic acid, quercetin and BHT were used as positive controls.
2.7.3. Phosphomolybdate Assay
DOI: 10.4236/fns.2019.108065 905 Food and Nutrition Sciences
solvent extracts of CT in 10% DMSO, 4 ml of phosphomolybdate reagent [0.6 M sulphuric acid, 28 mM sodium phosphate and 4 mM ammonium molybdate] was added. The control sample had 0.4 ml 10% DMSO/ distilled water [for as-corbic acid/aqueous extract] instead of solvent extract. The test tube containing the reaction mixtures were covered with aluminum foil and incubated at 95˚C for 90 minutes. The mixture was then allowed to cool down to room tempera-ture and the absorbance was recorded at 695 nm against the blank. Blank was run using the same procedure, which had either 10% DMSO or water [for ascor-bic acid/aqueous extract]. The reductions of Mo [VI] to Mo [V] by various sol-vent fractions of coconut testa were calculated as ascorbic acid equivalent.
2.7.4. Metal Chelating Assay
The metal chelating assay was carried out by the method reported in Dinis et al.,
[34]. In this method, to 1ml of various concentrations [312.5 - 10,000 μg/ml in two fold dilution] of solvent extract, 0.5 ml of 2 M ferrous chloride and 2 ml of 5 mM ferrozine solution were added. The solution was mixed thoroughly and in-cubated in dark at room temperature for 10 minutes. The control was run in the same process except that distilled water replaced solvent extract. The absorbance was read at 562 nm against distilled water as a blank. EDTA was used as a stan-dard metal chelator. Percent of inhibition was calculated using Equation (1).
2.7.5. Reducing Power Assay
Antioxidant capacities of different solvent fractions of CT were measured in re-ducing power assay according to a method reported by Oyaizu, [35]. To 1 ml of each of the solvent extracts of various concentrations [62 - 1000 μg/ml in two fold dilution] in 10% DMSO, 2.5 ml of sodium phosphate buffer [PH 6.6] and 2.5 ml of potassium ferricyanide [1% w/v] were added and mixed well. After in-cubation for 20 minutes at 50˚C, 2.5 ml of trichloroacetic acid was added and the whole mixture was centrifuged at 3000 rpm for 10 minutes. To 2.5 ml of the su-pernatant, 2.5 ml of distilled water and 0.5 ml of ferric chloride [0.1% w/v in dis-tilled water] solution were added and the absorbance was measured at 700 nm against the blank. Blank for each solvent extract was run using the same proce-dure but replacing the extracts with an equal volume of solvent [10% DMSO or water]. Quercetin and ascorbic acid were used as positive controls
2.7.6. CUPRAC Assay
CUPRAC assay was carried out according to the method proposed by Karaman
In-DOI: 10.4236/fns.2019.108065 906 Food and Nutrition Sciences
creased absorbance of the reaction mixture in reducing power assay and CUPRAC assay indicates increased reduction capability.
2.8. Antimicrobial Activity
The test pathogens such as two bacterial strains, Escherichia coli [MTCC 443] and Staphylococcus aureus [MTCC 737]and one fungal pathogen, Candida al-bicans [MTCC 227] were obtained from Institute of Microbial Technology [IMTECH] Chandigarh, India. Antimicrobial activity was carried out by agar cup method [37] in Nutrient agar [NA] plates for bacteria and in potato dextrose agar [PDA] plates for fungi. The overnight grown pathogens were diluted with sterile saline [0.85% NaCl] and the absorbance was adjusted to 0.08 - 0.12 at 625 nm [which corresponds to (1 - 2) × 108 CFU/ml of bacteria or (1 - 5) × 106
CFU/ml of C. albicans]. About 100 μl of these microbial suspensions were spread on to the entire surface of respective plates. Then, a hole [6 - 8 mm] was punched with a sterile tip and 100 μl of different solvent extracts [10 mg/ml] and standard antibiotics such as Azithromycin for bacteria [10 μg/ml] and Flucona-zole for fungi [10 μg/ml] were introduced into these wells. All these activities were carried out in aseptic condition in a laminar air hood. Following this, the plates were incubated at 37˚C for 24 hours and the zone of inhibition was meas-ured in mm.
2.9.
In Vitro
Anti-Inflammatory Activity
The anti-inflammatory activity was assessed by membrane stabilization of heat induced or hypotonic induced haemolysis of human RBCs as per the method de-scribed in Shinde et al. [38] and inhibition of heat induced albumin denaturation following the protocol of Mizushima et al. [39] with some minor modifications.
2.9.1. Preparation of HRBC Suspension
About 3 ml of blood from a healthy volunteer was freshly collected in a hepari-nized vial and centrifuged at 1000 rpm for about 2 minutes at RT. After removal of supernatant, to the red blood cell pellet equal volume of isotonic solution [154 mM NaCl in 10 mM sodium phosphate buffer, where the later contains 0.26 g of NaH2PO4∙2H2O, 1.15 g of Na2HPO4 and 9.0 g of NaCl in 1 litre of water] of pH
7.4 was added, mixed gently and centrifuged at 1000 rpm for 2 minutes. Follow-ing this, the supernatant was discarded and the process was repeated twice. Fi-nally, the RBC pellet was reconstituted to a 10% [v/v] suspension with normal saline [0.9% NaCl] and kept at 4˚C until further use.
2.9.2. Heat Induced Haemolysis
DOI: 10.4236/fns.2019.108065 907 Food and Nutrition Sciences
ml of 10% HRBC solution. In tube 0.2 ml of normal saline was taken instead of plant extract, which served as a control sample. One set including the tube la-beled with 0 was incubated at 40˚C [heated sample] while another set was at 4˚C [unheated sample]. After 20 minutes of incubation, these samples were centri-fuged for 10 minutes at 1000 rpm in RT and the absorbance of supernatant was recorded against the blank [normal saline] at 540 nm. This process was carried out twice for each of the solvent extracts of CT and ibuprofen. The percentage inhibition of haemolysis was calculated as
2 1
3 1
OD OD
1 100
OD OD −
− ×
−
(2)
where OD1 = Absorbance of test sample unheated, OD2 = absorbance of test
sample heated and OD3 = absorbance of control sample heated. 2.9.3. Hypotonic Induced Haemolysis
In hypotonic induced haemolysis of HRBC also, 11 number of centrifuge tubes of 15 ml capacity were taken and named as described for heat induced haemoly-sis. However, in one set labeled as 1 - 5, 2 ml of different concentrations of the solvent extract [0.062 - 1 mg/ml] were taken while in another set, 2 ml of ibu-profen of corresponding concentration [0.062 - 1 mg/ml] were taken. 2 ml of normal saline was taken in a centrifuge tube labeled as “0”. In all these eleven centrifuge tubes, 2 ml of hypotonic solution [50 mM NaCl in 10 mM sodium phosphate buffer] was added followed by the addition of 0.5 ml of 10% HRBC solution. After 10 minutes of incubation at RT, these were centrifuged at 1000 rpm for 10 minutes and the absorbance of the supernatant was recorded against the blank [normal saline] at 540 nm.
The percentage inhibition of haemolysis was calculated as per Equation (1).
2.9.4. Heat Induced Albumin Denaturation
The inhibition potential of various solvent fractions of CT to heat induced al-bumin denaturation was carried out as per Mizushima et al., [39] with modifica-tion and compared to the known anti-inflammatory drug ibuprofen. To 2 ml of various concentrations [100 - 1600 μg/ml] of solvent extract/ibuprofen dissolved in DMSO, 0.2 ml of 1% bovine serum albumin [BSA] in water and 2.8 ml of phosphate buffer saline [PH 7.4] were added. In the control, 2 ml of DMSO was taken instead of extract/ibuprofen, whereas in the blank BSA and ex-tract/ibuprofen were replaced by water and DMSO respectively. These were then incubated at 37˚C for 30 minutes followed by 5 minutes incubation at 70˚C. The absorbance of the turbid solution was recorded at 660 nm against the blank and percentage inhibition of protein denaturation was calculated as per Equation (1).
3. Statistical Analysis
ex-DOI: 10.4236/fns.2019.108065 908 Food and Nutrition Sciences
tract after evaporation of the solvent used for extraction and W2 is the weight of the CT powder initially taken. The TPC, TTC and TFC were calculated from MS Excel software and using the formula: T = C × V/W, where; T: total content [Phenol/flavonoid/tannin compounds] in mg/g of solvent extract calculated as gallic acid/quercetin/tannic acid equivalents, C: the concentration of the Phe-nol/flavonoid/tannin established from the calibration curve of gallic ac-id/quercetin/tannic acid as described in method section in mg/ml, V: the volume of extract in ml, W: weight of solvent extract in g. Comparison among mean values was made by unpaired t-test and a P value of < 0.05 was considered as significant. Linear regression analysis was used to calculate EC50 values using the
formula Y = MX + C, where Y represents 50% inhibition, M represents the co-efficient [slope], X represents the EC50 and C is the intercept. All analyses
were run in triplicates unless otherwise stated.
4. Results
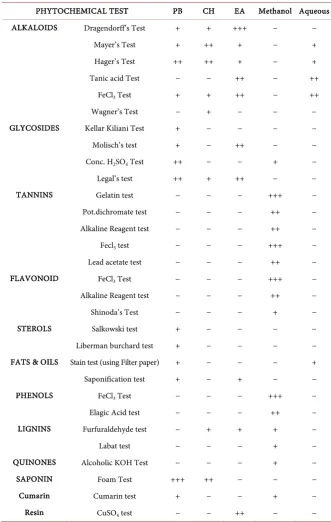
Petroleum benzene [PB: 13.88 gm] and aqueous fractions [Aq: 3.6 gm] resulted in the highest amount of total extractable compounds followed by ethyl acetate [EA: 1.8 gm] and methanol [1.46 gm], whereas the extraction yield with chloro-form [CH: 0.25 gm] was significantly less [P < 0.01] as compared to all other solvent fractions. The qualitative analysis of phyto-chemicals in different solvent extracts of coconut testa is shown in Table 1. The results showed that alkaloids were present in all solvents extracts except for methanol. The PB and EA extracts contained glycosides, fats and oil. Saponin was found in PB and CH fractions, whereas sterol was observed only in PB fraction. Interestingly, polyphenolic compounds [phenols, flavonoids, tannin, lignin, coumarin and quinones] were exclusively obtained in methanolic fractions. Lignin was also present in CH and EA fractions whereas resin was obtained only in EA fraction.
4.1. Total Phenolics, Flavonoids and Tannin Contents
Estimation of phenolics, flavonoids and tannin contents in various solvent ex-tracts of coconut testa showed their presence only in methanolic fractions, both in qualitative and quantitative tests [negative values were obtained]. The total phenolics content in methanolic fractions was found to be [822.60 ± 16.36] mg gallic acid equivalent/g, flavonoid contents to be [103.30 ± 9.78] mg quercetin equivalent/g and tannin to be [663.50 ± 19.26] mg tannic acid equivalent/g.
4.2.
In Vitro
Antioxidant Activity
The antioxidant activities of various solvent extracts of coconut testa were investi-gated by in vitro scavenging ability to free radicals such as DPPH and ABTS, reduc-tions of molybdenum from Mo [VI] to Mo [V], chelating of Fe2+, reductions of
cu-pric ion [CUPRAC assay] and ferric ions [reducing power assay] using standard oxidants as positive control. The EC50 values were determined for DPPH, ABTS,
DOI: 10.4236/fns.2019.108065 909 Food and Nutrition Sciences Table 1. Qualitative screening of phytochemicals in different solvent fractions of CT
PHYTOCHEMICAL TEST PB CH EA Methanol Aqueous
ALKALOIDS Dragendorff’s Test + + +++ − −
Mayer’s Test + ++ + − +
Hager’s Test ++ ++ + − +
Tanic acid Test − − ++ − ++
FeCl3 Test + + ++ − ++
Wagner’s Test − + − − −
GLYCOSIDES Kellar Kiliani Test + − − − −
Molisch’s test + − ++ − −
Conc. H2SO4 Test ++ − − + −
Legal’s test ++ + ++ − −
TANNINS Gelatin test − − − +++ −
Pot.dichromate test − − − ++ −
Alkaline Reagent test − − − ++ −
Fecl3 test − − − +++ −
Lead acetate test − − − ++ −
FLAVONOID FeCl3 Test − − − +++ −
Alkaline Reagent test − − − ++ −
Shinoda’s Test − − − + −
STEROLS Salkowski test + − − − −
Liberman burchard test + − − − −
FATS & OILS Stain test (using Filter paper) + − − − +
Saponification test + − + − −
PHENOLS FeCl3 Test − − − +++ −
Elagic Acid test − − − ++ −
LIGNINS Furfuraldehyde test − + + + −
Labat test − − − + −
QUINONES Alcoholic KOH Test − − − + −
SAPONIN Foam Test +++ ++ − − −
Cumarin Cumarin test + − − + −
Resin CuSO4 test − − ++ − −
Phytochemicals screening was carried out according to the methods provided in Sheel et al. [24], Nanna et al. [25], Mishra et al. [26], and Sharma et al. [27]. “+” indicates presence and “−” indicates absence. The in-crease in + sign indicates the intensity.
stronger antioxidant activity (Table 2). In CUPRAC and reducing power assays, the anti-oxidant activities increased with absorption value at respective wavelengths.
4.2.1. DPPH˙ Scavenging Activity
DOI: 10.4236/fns.2019.108065 910 Food and Nutrition Sciences
= 2.63] of the testa had the similar ability to scavenge DPPH˙ free radicals, which were higher than the known anti-oxidants BHT [EC50 = 3.02] and tannic acid
[EC50 = 3.74]. While 78% of inhibition was noted for methanolic extracts, 80%
in-hibition was observed by chloroform extracts at a concentration of 12.5 μg/ml.
4.2.2. ABTS˙+Scavenging Activity
In all the extracts tested, only methanolic extracts had the highest anti-oxidant activity with an EC50 value of 2.57, which is lowest among all including the
known anti-oxidants gallic acid [EC50 = 4.4], quercetin [EC50 = 5.67], tannic acid
[EC50 = 5.15], BHT [EC50 = 13.12] and ascorbic acid [EC50 = 23.14]. The ethyl
acetate extracts also showed potent anti-oxidant activity with an EC50 = 8.67. At
a concentration of 12.5 μg/ml, while methanolic extract exhibited an inhibition of 83.57%, gallic acid inhibited 74.28%, quercetin and tannic acid inhibited 72.14% and 72.85% respectively, ascorbic acid 62.85% and BHT 67.85%.
4.2.3. Phosphomolybdenum Assay
In phosphomolybdenum assay, the reductions of Mo [VI] to Mo [V] by various solvent fractions of coconut testa were calculated as ascorbic acid equivalent. The results showed the presence of effective antioxidants activity in petroleum benzene [EC50 = 112.73 μg/ml] and methanolic fractions [EC50 = 149.16 μg/ml]
of testa which corresponds to the EC50 value of 51.79 μg/ml of reference
chemi-cals, ascorbic acid (Table 2). The ethyl acetate fraction had the least activity.
4.2.4. Metal Chelating Assay
[image:11.595.208.540.474.691.2]Assessment of various solvent extracts of coconut testa for their chelating ability of ferrous ions revealed that only methanolic and aqueous fractions had the power
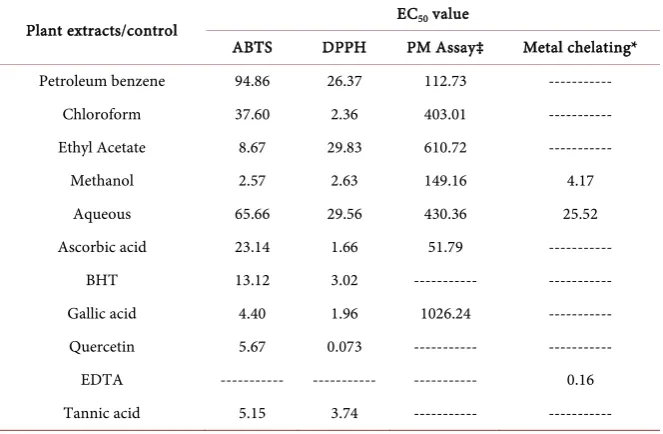
Table 2. Radical scavenging activity of different solvent extracts of coconut testa.
Plant extracts/control EC50 value
ABTS DPPH PM Assay‡ Metal chelating*
Petroleum benzene 94.86 26.37 112.73 ---
Chloroform 37.60 2.36 403.01 ---
Ethyl Acetate 8.67 29.83 610.72 ---
Methanol 2.57 2.63 149.16 4.17
Aqueous 65.66 29.56 430.36 25.52
Ascorbic acid 23.14 1.66 51.79 ---
BHT 13.12 3.02 --- ---
Gallic acid 4.40 1.96 1026.24 ---
Quercetin 5.67 0.073 --- ---
EDTA --- --- --- 0.16
Tannic acid 5.15 3.74 --- ---
‡: ascorbic acid equivalent values for different concentration of solvent extracts were analyzed for IC50
DOI: 10.4236/fns.2019.108065 911 Food and Nutrition Sciences
to reduce iron ion Fe [III] into Fe [II] in a dose-dependent manner. The EC50 for
the chelation of iron ion by methanolic fractions was found to be 4.17 mg/ml and for aqueous fraction was 25.52 mg/ml as against the EDTA which had an EC50 of 0.162 mg/ml.
4.2.5. Reducing Power and CUPRAC Assays
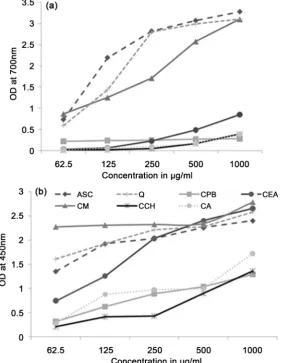
Figure 1(a) and Figure 1(b) show the reducing ability of various solvents frac-tions of coconut testa for ferric ion and cupric ion in reducing power assay and CUPRAC assay respectively using quercetin and ascorbic acid as control. The dose response curve [62.5 - 1000 μg/ml] of various solvent extracts including the con-trol showed the increased reduction of ions with an increase in the concentration of each extract and control samples. However, in both the assays the methanolic fraction showed the highest reducing ability compared to all other solvent extracts. In reducing power assay, although the methanolic fraction had comparatively low anti-oxidant activity than quercetion and ascorbic acid within the concentration
[image:12.595.234.517.302.666.2]ASC: Ascorbic acid, Q: Quercetin, CPB: Petroleum benzene, CEA: Ethyl acetate, CM: Methanol, CCH: Chloroform, CA: Aqueous, OD: Optical density.
DOI: 10.4236/fns.2019.108065 912 Food and Nutrition Sciences
range of 125 - 500 μg/ml, this activity was comparable at 1000 μg/ml. However, in CUPRAC assay the methanolic fraction exhibited high-reduction activity com-pared to the control, quercetion and ascorbic acid at all range of studied concen-tration. Besides, the ethyl acetate fraction also showed high anti-oxidant activity than quercetion and ascorbic acid at a concentration beyond 500 μg/ml.
4.3. Anti-Microbial Assay
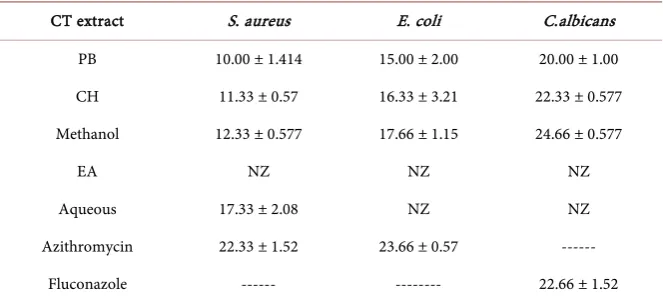
The screening results for antimicrobial activity of different solvent extracts against two bacterial strains; one gram positive such as Staphylococcus aureus, and one gram negative such as Escherichia coli, and one fungal strain Candida albicans are presented in Table 3. The results indicated that petroleum benzene, chloroform and methanolic fractions of coconut testa had antibacterial and an-tifungal activity against all tested pathogens with a maximum zone of inhibition obtained for the methanolic fraction. However, while aqueous extract showed antibacterial activity against S. aureus only with a maximum zone of inhibition [17.33 mm] which is highest compared to all other solvent extracts, ethyl acetate fraction did not exhibit any antimicrobial activity against the test pathogens at a concentration of 10 mg/ml.
4.4. Anti-Inflammatory Assay
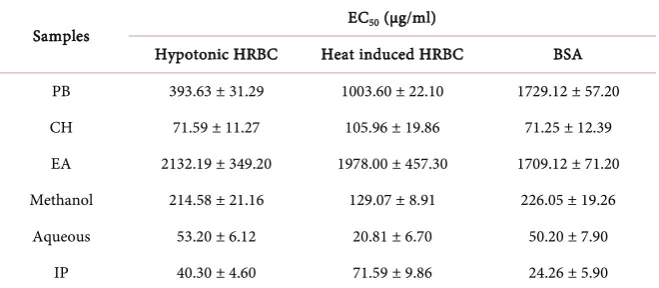
[image:13.595.207.539.537.687.2]Investigation for anti-inflammatory activity of different solvent fractions of CT by membrane stabilization of heat and hypotonic solution induced human red blood cell haemolysis and inhibition of heat induced albumin denaturation assay revealed that aqueous fraction had the highest anti-inflammatory activity com-parable to that of the known anti-inflammatory drug ibuprofen followed by the CH fraction and methanolic fraction (Table 4). The PB and EA fractions had the least activity. The heat induced HRBC assay for the EA extract could not be car-ried out due to lack of the extract as the percentage yield of EA fraction was very very less.
Table 3. Antimicrobial activity of different solvent fractions of CT.
CT extract S. aureus E. coli C.albicans
PB 10.00 ± 1.414 15.00 ± 2.00 20.00 ± 1.00
CH 11.33 ± 0.57 16.33 ± 3.21 22.33 ± 0.577
Methanol 12.33 ± 0.577 17.66 ± 1.15 24.66 ± 0.577
EA NZ NZ NZ
Aqueous 17.33 ± 2.08 NZ NZ
Azithromycin 22.33 ± 1.52 23.66 ± 0.57 ---
Fluconazole --- --- 22.66 ± 1.52
DOI: 10.4236/fns.2019.108065 913 Food and Nutrition Sciences Table 4. Anti-inflammatory activity of different solvent fractions of CT.
Samples EC50 (μg/ml)
Hypotonic HRBC Heat induced HRBC BSA
PB 393.63 ± 31.29 1003.60 ± 22.10 1729.12 ± 57.20
CH 71.59 ± 11.27 105.96 ± 19.86 71.25 ± 12.39
EA 2132.19 ± 349.20 1978.00 ± 457.30 1709.12 ± 71.20
Methanol 214.58 ± 21.16 129.07 ± 8.91 226.05 ± 19.26
Aqueous 53.20 ± 6.12 20.81 ± 6.70 50.20 ± 7.90
IP 40.30 ± 4.60 71.59 ± 9.86 24.26 ± 5.90
PB: Petrolium benzene extract, CH: Chloroform extract, EA: Ethyl acetate extract and IP: ibuprofen. Values are expressed in mean ± SD after the results were obtained in triplicates. For heat induced haemolysis assay, EA extract was not available at the time of experiment.
5. Discussion
DOI: 10.4236/fns.2019.108065 914 Food and Nutrition Sciences
in the present study we documented the total phenolic content of CT to be as high as 822.6 mg GAE/g in the methanolic fraction. Previous sequential extrac-tion studies with soxhlet also reveal high phenolic content in the methanolic fraction from various parts of Moringa oleifera [46] and of Caesalpinia digyna
root [47]. The fact that polyphenolic compounds in plants are mostly found in conjugated forms with glycosides, proteins and sugars which are soluble in the specific solvent system [16] [48] [49]. The present finding of enhanced phenolic content in the methanolic fraction during sequential extraction with different solvents of varying polarity could be explained by the sequential elimination of solvent soluble non-polar compounds and interfering unwanted non-phenolic substances such as wax, fats, terpenes, etc. This is partially evidenced by the re-moval of almost all glycosides, sterol, saponin, resin, fats and oil before extrac-tion with methanol (Table 1). The lack of phenolic compounds in non-polar organic solvents indicates the absence of more complex forms of polyphenolic compounds in the CT. Further, the finding of polyphenols compound exclusive-ly in methanolic fraction can be attributed to the polar nature of the phenolic compounds of CT, although methanol can also dissolve non-polar compounds for being amphiphilic in nature. However, the absence of phenolic compounds in aqueous fraction as well suggests that very polar phenolic acids [such as ben-zoic, cinnamic acids] could be present in negligible or undetected amounts or maybe absent completely. Our study represent that the sequential soxhlet extrac-tion process adopted here could be a potential tool of isolating maximum phe-nolic compounds at least from CT and has an added advantage of separating phytochemicals in different solvent fractions which could be utilized in purifica-tion post extracpurifica-tion.
In order to accurately measure the effectiveness of antioxidants potential of various solvent extracts of CT, we evaluated the anti-oxidant activities through different methods of multiple reaction characteristics viz. DPPH and ABTS rad-ical scavenging activity, Phosphomolybdate, CUPRAC and ferric reducing pow-er assays—based on the single electron transfpow-er, and metal chelating assay based on co-ordinate complex formation with the metal ions inhibiting the transfer of electrons [50] [51]. The results of various antioxidant assays are given in Table 2. To date, this is the first study to report and compare the anti-oxidant activities of different solvent fractions of coconut testa. The results showed that metha-nolic fraction of the CT had invariably the highest anti-oxidant activity than all other solvent fractions in almost all assay methods except in phosphomolybdate assay where PB fraction showed the highest activity [EC50 = 112.73] followed by
methanolic fraction [EC50 = 149.16]. In some cases, the methanolic fraction
DOI: 10.4236/fns.2019.108065 915 Food and Nutrition Sciences
constant presentation of highest anti-oxidant activities in multiple assay me-thods, which involve different reaction mechanism, PH conditions and vary
ac-cording to compound type (hydrophilic and lipophilic) [54] [55] by methanolic fraction indicates it to be a source of multiple phenolics and flavonoids of potent anti-oxidant activities. This is further supported by a recent identification of about 28 polyphenolics comprising of 16 phenolic acids and 12 flavonoids from the CT [9]. Considering the methanolic fraction of the present study as the ex-clusive source of polyphenolic compounds of CT, we expect for the presence of even more number of polyphenolics in this fraction which is yet to be characte-rized. Interestingly, the exhibition of potent anti-oxidant activities by the CH fraction [EC50 = 2.369 in DPPH assay] and EA fraction [EC50 = 8.67 in ABTS
as-say] along with PE fraction suggest that bioactivity of CT in terms of an-ti-oxidant activities can also be contributed by non-polyphenolic compounds and are not limited to polyphenolic compounds only. Similar, high anti-oxidant activities by non-phenolic compounds also have been reported by previous stu-dies on pomegranate [56] and Buddleja asiatica [57]. Our study brings attention to different solvent fractions of CT containing phenolic and non-phenolic com-pounds to be a source of natural antioxidant and ensure that the CT can be bet-ter exploited for the medicinal benefit of the human.
DOI: 10.4236/fns.2019.108065 916 Food and Nutrition Sciences
interaction with membrane proteins thereby increasing the surface area/volume ratio which needs to be investigated. Moreover, alteration of ion influx into erythrocytes cannot be ruled out as a change in volume and deformability of erythrocytes has been shown to be correlated with intracellular calcium ion con-tent [68] [69].
To the best of our knowledge, no previous report exists evaluating the antimi-crobial activity of CT. Further, antimiantimi-crobial activity of plant extracts have been shown to vary with the solvent used for extract preparation [70] [71] [72] and bacterial [gram positive or gram negative] and fungal pathogen tested. There-fore, we assessed the antimicrobial activity of various solvent fractions of CT us-ing two bacterial [S. aureus and E. coli] and one fungal pathogen [C. albicans]. The results indicated that aqueous extract did not show any activity against the gram negative E. coli and fungal pathogen, though it had the highest antibacteri-al activity compared to antibacteri-all other solvent fractions against the gram positive S.
aureus. Earlier studies also suggest gram-negative bacteria to be generally more resistant to various drugs and antibiotics than gram-positive bacteria [73] and these differences in susceptibility by the aqueous fraction in the present study could be explained by the differences in cell wall composition or drug resistant genes on plasmids they inherited with. However, fractions of coconut testa ob-tained with organic solvents [PB, CH and methanol] had antibacterial and anti-fungal activity against all tested pathogens with the maximum zone of inhibition obtained for methanolic fraction. In most of the cases, organic extracts have been shown to exhibit greater antimicrobial activity compared to aqueous ex-tract [74], although this is not universal. This suggests that relatively hydro-phobic nature of the compounds in CT had the ability to kill both gram positive and gram negative bacteria along with fungal pathogens.
6. Conclusion
Overall, our study reveals that CT is a rich source of various polyphenolic and non-phenolic natural antioxidants, anti-inflammatory and antimicrobial com-pounds. Although the number of active components and their chemical and phys-ical nature in each extract are unclear, the findings of the study are promising and can form the basis to exploit the CT for therapeutic benefits. Further research is warranted to characterize the individual component of the active principle.
Acknowledgements
DOI: 10.4236/fns.2019.108065 917 Food and Nutrition Sciences
administrative and laboratory facilities for the study.
Conflicts of Interest
The authors declare no conflicts of interest regarding the publication of this pa-per.
References
[1] Manivannan, A., Bhardwaj, R., Padmanabhan, S., Suneja, P., Hebbar, K.B. and Ka-nade, S.R. (2018) Biochemical and Nutritional Characterization of Coconut (Cocos nucifera L.) Haustorium. Food Chemistry, 238, 153-159.
https://doi.org/10.1016/j.foodchem.2016.10.127
[2] DebMandal, M. and Mandal, S. (2011) Coconut (Cocosnucifera L.: Arecaceae): In Health Promotion and Disease Prevention. Asian Pacific Journal of Tropical Medi-cine, 4, 241-247. https://doi.org/10.1016/S1995-7645(11)60078-3
[3] Yong, J.W.H., Ge, L.-Y., Ng, Y.F. and Tan, S.N. (2009) The Chemical Composition and Biological Properties of Coconut (Cocos nucifera L.) Molecules, 14, 5144-5164. https://doi.org/10.3390/molecules14125144
[4] Zhang, L., Ravipati, A.S., Koyyalamudi, S.R., Jeong, S.C., Reddy, N., Smith, P.T., Bartlett, J., Shanmugam, K., Munch, G. and Wu, M.-J. (2011) Antioxidant and An-ti-Inflammatory Activities of Selected Medicinal Plants Containing Phenolic and Flavonoid Compounds. Journal of Agricultural and Food Chemistry, 59, 12361-12367. https://doi.org/10.1021/jf203146e
[5] Lathika, M. and Kumar, C.E.A. (2009) Indian Stakes in the Global Coconut Scena-rio by the Turn of the Century: An Empirical Investigation. South Asia Economic Journal, 10, 209-221. https://doi.org/10.1177/139156140901000109
[6] Marikkar, J.M.N. and Madhrapperuma, W.S. (2012) Chapter 9. Coconut. In: Siddiq, M., Ed., Tropical and Subtropical Fruits: Postharvest Physiology, Processing and Packaging, John-Wiley Publishing Co., Ames, Iowa, USA, 159-177.
https://doi.org/10.1002/9781118324097.ch9
[7] Appaiah, P., Sunil, L., Prasanth Kumar, P.K. and Gopala Krishna, A.G. (2014) Com-position of Coconut Testa, Coconut Kernel and Its Oil. Journal of the American Oil Chemists’ Society, 91, 917-924. https://doi.org/10.1007/s11746-014-2447-9
[8] Adekola, K.A., Salleh, A.B., Zaidan, U.H., Azlan, A., Chiavaro, E., Paciulli, M. and Marikkar, J.M.N. (2017) Total Phenolic Content, Antioxidative and Antidiabetic Properties of Coconut (Cocos nucifera L.) Testa and Selected Bean Seed Coats. Ital-ian Journal of Food Science, 29, 741-753.
[9] Arivalagan, M., Roy, T.K., Yasmeen, A.M., Pavithra, K.C., Jwala, P.N., Shivasankara, K.S., Manikantan, M.R., Hebbar, K.B. and Kanade, S.R. (2018) Extraction of Phe-nolic Compounds with Antioxidant Potential from Coconut (Cocos nucifera L.) Testa and Identification of Phenolic Acids and Flavonoids Using UPLC Coupled with TQD-MS/MS. LWT-Food Science and Technology, 92, 116-126.
https://doi.org/10.1016/j.lwt.2018.02.024
[10] Pandey, K.B. and Rizvi, S.I. (2009) Plant Polyphenols as Dietary Antioxidants in Human Health and Disease. Oxidative Medicine and Cellular Longevity, 2, 270-278. https://doi.org/10.4161/oxim.2.5.9498
DOI: 10.4236/fns.2019.108065 918 Food and Nutrition Sciences [12] Everitt, A.V., Hilmer, S.N., Brand-Miller, J.C., Jamieson, H.A., Truswell, A.S., Sharma, A.P., Mason, R.S., Morris, B.J. and Le Couteur, D.G. (2006) Dietary Approaches That Delay Age-Related Diseases. Clinical Interventions in Aging, 1, 11-31. [13] Działo, M., Mierziak, J., Korzun, U., Preisner, M., Szopa, J. and Kulma, A. (2016)
The Potential of Plant Phenolics in Prevention and Therapy of Skin Disorders. In-ternational Journal of Molecular Sciences, 17, 160.
https://doi.org/10.3390/ijms17020160
[14] Razak, D.L.A., Jamaluddin, A., YuhaslizaAbd. N., Rashid, Sharifudin, S.A. and Long, K. (2016) Comparative Study of Antioxidant Activities, Cosmeceutical Prop-erties and Phenolic Acids Composition of Fermented Rice Bran and Coconut Testa.
Jurnal Teknologi (Sciences & Engineering), 78, 11-12. https://doi.org/10.11113/jt.v78.9940
[15] Swaroop, C., Jose, T.K. and Ramesh, A. (2016) Property Testing of Biodiesel Derived from Coconut Testa Oil and Its Property Comparison with Standard Values. Inter-national journal of Advances in Production and Mechanical Engineering, 2, 37-41. [16] Khoddami, A., Meredith, A.W. and Thomas, H.R. (2013) Techniques for Analysis
of Plant Phenolic Compounds. Molecules, 18,2328-2375. https://doi.org/10.3390/molecules18022328
[17] Sun, T. and Ho, C.-T. (2005) Antioxidant Activities of Buckwheat Extracts. Food Chemistry, 90, 743-749. https://doi.org/10.1016/j.foodchem.2004.04.035
[18] Turkmen, N., Sari, F. and Velioglu, Y.S. (2006) Effects of Extraction Solvents on Concentration and Antioxidant Activity of Black and black Mate Tea Polyphenols Determined by Ferrous Tartrate and Folin-Ciocalteu Methods. Food Chemistry, 99, 835-841. https://doi.org/10.1016/j.foodchem.2005.08.034
[19] Hayouni, A., Abedrabba, M., Bouix, M. and Hamdi, M. (2007) The Effects of Sol-vents and Extraction Method on the Phenolic Contents and Biological Activities in Vitro of Tunisian Quercus coccifera L. and Juniperus phoenicea L. Fruit Extracts.
Food Chemistry, 105, 1126-1134. https://doi.org/10.1016/j.foodchem.2007.02.010 [20] Appaiah, P., Sunil, L., Gopala Krishna, A.G. and Suresh Kumar, G. (2016)
Phyto-chemicals and Antioxidant Activity of Testa Extracts of Commercial Wet and Dry Coconuts and Cakes. International Research Journal of Pharmacy, 7, 9-13. https://doi.org/10.7897/2230-8407.079106
[21] Zhao, X.-L., Chen, W.-J., Zhao, S.-L. and Tang, M.-M. (2012) Antioxidative Activity of the Extractives from Coconut Testa Oil. Chinese Journal of Tropical Crops, 33, 162-165.
[22] Sashya, M.M.M., Meedeniya, D. and Coorey, R.V. (2012) Quality Assessment of Commercially Available Coconut Oils in Sri Lanka Using Refractometry. P roceed-ings of the Technical Sessions, 28, 37-44.
[23] Seneviratne, K.N., HapuarachchI, C.D. and Ekanayake, S. (2009) Comparison of the Phenolic-Dependent Antioxidative Properties of Coconut Oil Extracted under Cold and Hot Conditions. Food Chemistry, 114, 1444-1449.
https://doi.org/10.1016/j.foodchem.2008.11.038
[24] Sheel, R., Nisha, K. and Kumar, J. (2014) Preliminary Phytochemical Screening of Methanolic Extract of Clerodendron infortunatum. IOSR-Journal of Applied Che-mistry, 7, 10-13. https://doi.org/10.9790/5736-07121013
[25] Nanna, R.S., Marka, R., Talari, S., Penchala, S. and Rudroju, S. (2013) Preliminary Phytochemical Analysis of Leaf, Stem, Root and Seed Extracts of Arachis hypogaea L.
DOI: 10.4236/fns.2019.108065 919 Food and Nutrition Sciences [26] Saklani, S., Mishra, A.P., Sati, B. and Sati, H. (2012) Pharmacognostic, Phytochemical and Antimicrobial Screening of Aphanamixis polystachya, An Endangered Medicinal Tree. International Journal of Pharmacy and Pharmaceutical Sciences, 4, 235-240. [27] Sharma, V., Agarwal, A., Chaudhary, U. and Singh, M. (2013) Phytochemical
Inves-tigation of Various Extracts of Leaves and Stems of Achyranthes aspera L. Interna-tional Journal of Pharmacy and Pharmaceutical Sciences, 5, 317-320.
[28] Ebrahimzadeh, M.A., Pourmorad, F. and Bekhradnia, A.R. (2008) Iron Chelating Activity, Phenol and Flavonoid Content of Some Medicinal Plants From Iran. Afri-can Journal of Biotechnology, 7, 3188-3192.
[29] Islam T., Hasan, M.R., Roy, A., Islam, M.S., Uddin, M.A., Islam, M.A., Neon, M.N. and Rana, M.S. (2015) Screening of In-Vitro Antioxidant, Brine Shrimp Lethality Bioassay and Antimicrobial Activities of Extracts of Bridelia retusa (L.) Spreng. Fruit. International Journal of Pharmacy, 5, 1058-1067.
[30] Makkar, H.P.S., Dawra, R.K. and Singh, B. (1988) Determination of Both Tannin and Protein in a Tannin-Protein Complex. Journal of Agricultural and Food Che-mistry, 36, 523-525. https://doi.org/10.1021/jf00081a600
[31] Chang, S.-T., Wu, J.-H., Wang, S.-Y., Kang, P.-L., Yang, N.-S. and Shyur, L.-F. (2001) Antioxidant Activity of Extracts from Acaciaconfusa Bark and Heartwood. Journal of Agricultural and Food Chemistry, 49, 3420-3424.
https://doi.org/10.1021/jf0100907
[32] Re, R., Pellegrini, N., Proteggente, A., Pannala, A., Yang, M. and Rice-Evans, C. (1999) Antioxidant Activity Applying an Improved ABTS Radical Cation Decolori-zation Assay. Free Radical Biology and Medicine, 26, 1231-1237.
https://doi.org/10.1016/S0891-5849(98)00315-3
[33] Prieto, P., Pineda, M. and Aguilar, M. (1999) Spectrophotometric Quantitation of Antioxidant Capacity through the Formation of a Phosphomolybdenum Complex: Specific Application to the Determination of Vitamin E. Analytical Biochemistry, 269, 337-341. https://doi.org/10.1006/abio.1999.4019
[34] Dinis, T.C.P., Madeira, V.M.C. and Almeida, L.M. (1994) Action of Phenolic Deriv-atives (Acetoaaminophen, Salycilate and 5-Aminosalycilate) as Inhibitors of Mem-brane Lipid Peroxidation and as Peroxyl Radical Scavengers. Archieves of Bioche-mistry and Biophysics, 315, 161-169. https://doi.org/10.1006/abbi.1994.1485 [35] Oyaizu, M. (1986) [Studies on Products of the Browning Reaction Prepared From
Glucose Amine]. The Japanese Journal of Nutrition and Dietetics, 44, 307-315. https://doi.org/10.5264/eiyogakuzashi.44.307
[36] Karaman, S., Tutem, E., Baskan, K.S. and Apak, R. (2010) Comparison of Total An-tioxidant Capacity and Phenolic Composition of Some Apple Juices with Combined HPLC-CUPRAC Assay. Food Chemistry, 120, 1201-1209.
https://doi.org/10.1016/j.foodchem.2009.11.065
[37] Perez, C., Paul, M. and Bazerque, P. (1990) An Antibiotic Assay by the Agar Well Diffusion Method. Acta Biologiae et Medicinae Experimentalis, 15, 113-115. [38] Shinde, U.A., Kulkarni, K.R., Phadke, A.S., Nair, A.M., Dikshit, V.J.M. and Saraf, M.N.
(1999) Mast Cell Stabilizing and Lipoxygenase Inhibitory Activity of Cedrusdeodara
(Roxb.) Loud. Wood Oil. Indian Journal of Experimental Biology, 37, 258-261. [39] Mizushima, Y. and Kobayashi, M. (1968) Interaction of Anti-Inflammatory Drugs
with Serum Proteins, Especially with Some Biologically Active Proteins. Journal of Pharmacy and Pharmacology, 20, 169-173.
DOI: 10.4236/fns.2019.108065 920 Food and Nutrition Sciences [40] Geetha, V., Bhavana, K.P., Chetana, R., Gopala Krishna, A.G. and Suresh Kumar, G. (2016) Studies on the Composition and In-Vitro Antioxidant Activities of Concen-trates from Coconut Testa and Tender Coconut Water. Journal of Food Processing
& Technology, 7, 588-592.
[41] Lamdande, A.G., Garud, S.R. and Raghavarao K.S.M.S. (2017) Processing Methods for Increasing the Yield, Nutritional Value and Stability of Coconut Milk. Interna-tional Journal of Nutrition and Food Engineering, 11, 12.
[42] Zhao, H.-F., Dong, J., Lu, J.-J., Chen, J., Li, Y., Shan, L.-J., Lin, Y., Fan, W. and Gu, G.-X. (2006) Effect of Extraction Solvent Mixtures on Antioxidant Activity Evalua-tion and Their ExtracEvalua-tion Capacity and Selectivity for Free Phenolic Compounds in Barley (Hordeum vulgare L.). Journal of Agricultural and Food Chemistry, 54, 7277-7286. https://doi.org/10.1021/jf061087w
[43] Sulaiman, S.F., Sajak, A.A.B., Supriatno, K.L.O. and Seow, E.M. (2011) Effect of Solvents in Extracting Polyphenols and Antioxidants of Selected Raw Vegetables.
Journal of Food Composition and Analysis, 24, 506-515. https://doi.org/10.1016/j.jfca.2011.01.020
[44] Wijekoon, M.M.J.O., Bhat, R. and Karim, A.A. (2011) Effect of Extraction Solvents on the Phenolic Compounds and Antioxidant Activities of Bunga kantan (Etlingera elatior Jack.) Inflorescence. Journal of Food Composition and Analysis, 24, 615-619. https://doi.org/10.1016/j.jfca.2010.09.018
[45] Chavan, U.D. and Amarowicz, R. (2013) Effect of Various Solvent Systems on Ex-traction of Phenolics, Tannins and Sugars from Beach Pea [Lathyrus maritimus L.].
International Food Research Journal, 20, 1139-1144.
[46] Vyas, S., Kachhwaha, S. and Kothari, S.L. (2015) Comparative Analysis of Phenolic Contents and Total Antioxidant Capacity of Moringaoleifera Lam. Pharmacognosy Journal, 7, 44-51. https://doi.org/10.5530/pj.2015.1.5
[47] Srinivasan, R., Chandrasekar, M.J.N., Nanjan, M.J. and Suresh, B. (2007) Antioxi-dant Activity of Caesalpinia digyna Root. Journal of Ethnopharmacology, 113, 284-291. https://doi.org/10.1016/j.jep.2007.06.006
[48] Robbins, R.C. (1980) Medical and Nutritional Aspects of Citrus Bioflavonoids. Chapter 3. In: Citrus Nutrition and Quality, 43-59.
https://doi.org/10.1021/bk-1980-0143.ch003
[49] Pinelo, M., Franco, D., Sineiro, J., Rubilar, M., Sánchez, M., Jerez, M., Costoya, N. and Nunez, M.J. (2008) Polyphenols from Plant Materials: Extraction and Antioxi-dant Power. Electronic Journal of Environmental, Agriculture and Food Chemistry, 7, 3210-3216.
[50] Antolovich, M., Prenzler, P., Robards, K. and Ryan, D. (2000) Sample Preparation in the Determination of Phenolic Compounds in Fruits. Analyst, 125, 989-1009. https://doi.org/10.1039/b000080i
[51] Soler-Rivas, C., Espín, J.C. and Wichers, H.J. (2000) An Easy and FAST Test to Compare Total Free Radical Scavenger Capacity of Foodstuffs. Phytochemical Analysis, 11, 330-338.
https://doi.org/10.1002/1099-1565(200009/10)11:5<330::AID-PCA534>3.0.CO;2-G [52] Toh, J.J., Khoo, H.E. and Azrina, A. (2013) Comparison of Antioxidant Properties
of Pomelo [Citrus grandis (L) Osbeck] Varieties. International Food Research Journal, 20, 1661-1668.
DOI: 10.4236/fns.2019.108065 921 Food and Nutrition Sciences https://doi.org/10.1016/j.foodres.2011.03.056
[54] Cano, A., Hernandez-Ruiz, J., Garcia-Canovas, F., Acosta, M. and Arnao, M.B. (1998) An End-Point Method for Estimation of the Total Antioxidant Activity in Plant Material. Phytochemical Analysis, 9, 196-202.
https://doi.org/10.1002/(SICI)1099-1565(199807/08)9:4<196::AID-PCA395>3.0.CO; 2-W
[55] Apak, R., Guclu, K., Ozyurek, M. and Karademir, S.E. (2004) Novel Total Antioxi-dant Capacity Index for Dietary Polyphenols and Vitamins C and E, Using Their Cupric Ion Reducing Capability in the Presence of Neocuproine: CUPRAC Method.
Journal of Agricultural and Food Chemistry, 52, 7970-7981. https://doi.org/10.1021/jf048741x
[56] Mekni, M., Azez, R., Tekaya, M., Mechri, B. and Hammami, M. (2013) Phenolic, Non-Phenolic Compounds and Antioxidant Activity of Pomegranate Flower, Leaf and Bark Extracts of Four Tunisian Cultivars. Journal of Medicinal Plants Research, 7, 1100-1107.
[57] Mortada, M.E., Abdel-Hameed, E.S., Ahmed, W.S. and El-Wakil, E.A. (2008) Non-Phenolic Antioxidant Compounds from Buddleja asiatica. Zeitschrift für Na-turforschung C, 63, 483-491. https://doi.org/10.1515/znc-2008-7-803
[58] Umapathy, E., Ndebia, E.J., Meeme, A., Adam, B., Menziura, P., Nkeh-Chungag, B.N. and Iputo, J.E. (2010) An Experimental Evaluation of Albucasetosa Aqueous Extract on Membrane Stabilization, Protein Denaturation and White Blood Cell Migration during Acute Inflammation. Journal of Medicinal Plant Research, 4, 789-795. [59] Mounnissamy, V.M., Kavimani, S., Balu, V. and Drlin, Q.S. (2008) Evaluation of
Anti-Inflammatory and Membrane Stabilizing Properties of Ethanol Extract of
Canjerarehedi. Iranian Journal of Pharmacology and Therapeutics, 6, 235-237. [60] Chaitanya, R., Sandhya, S., David, B., Vinod, K.R. and Murali, S. (2011) HRBC
Membrane Stabilizing Property of Roor, Stem and Leaf of Glochidion velutinum.
International Journal of Research in Pharmaceutical and Biomedical Sciences, 2, 256-259.
[61] Mellors. A., Tappel, A.L., SawantI, P.L. and Desa, D. (1967) Mitochondrial Swelling and Uncoupling of Oxidative Phosphorylation by Lysosomes. Biochimica et Bio-physica Acta (BBA)-Bioenergetics, 143, 299-309.
https://doi.org/10.1016/0005-2728(67)90084-9
[62] Alhakmani, F., Kumar, S. and Khan, S.A. (2013) Estimation of Total Phenolic Con-tent, In-vitro Antioxidant and Anti-Inflammatory Activity of Flowers of Moringa Oleifera. Asian Pacific Journal of Tropical Biomedicine, 3, 623-627.
https://doi.org/10.1016/S2221-1691(13)60126-4
[63] Kassim, M., Achoui, M., Mustafa, M.R., Mohd, M.A. and Yusoff, K.M. (2010) El-lagic Acid, Phenolic Acids, and Flavonoids in Malaysian Honey Extracts Demon-strate in Vitro Anti-Inflammatory Activity. Nutrition Research, 30, 650-659. https://doi.org/10.1016/j.nutres.2010.08.008
[64] Masuda, T., Jitoe, A., Isobe, J., Nakatani, N. and Yonemori, S. (1993) Anti-Oxidative and Anti-Inflammatory Curcumin-Related Phenolics from Rhizomes of Curcuma domestica. Phytochemistry, 32, 1557-1560.
https://doi.org/10.1016/0031-9422(93)85179-U
DOI: 10.4236/fns.2019.108065 922 Food and Nutrition Sciences [66] Claeson, P., Pongprayoon, U., Sematong, T., Tuchinada, P., Reutrakul, V., Soon-tornsaratune, P. and Taylor, W.C. (1996) Non-Phenolic Linear Diarylheptanoids from Curcuma xanthorrhiza: A Novel Type of Topical Anti-Inflammatory Agents: Structure-Activity Relationship. Planta Medica, 62, 236-240.
https://doi.org/10.1055/s-2006-957867
[67] Oyedapo, O.O., Akinpelu, B.A., Akinwunmi, K.F., Adeyinka, M.O. and Sipeolu, F.O. (2010) Red Blood Cell Membrane Stabilizing Potentials of Extracts of Lantana camara and Its Fractions. International Journal of Plant Physiology and Biochemi-stry, 2, 46-51.
[68] Dodson, R.A., Hinds, T.R. and Vincenzi, F.F. (1987) Effects of Calcium and A23187 on Deformability and Volume of Human Red Blood Cells. Blood Cells, 12, 555-564. [69] Friederichs, E. and Meiselman, H.J. (1994) Effects of Calcium Permeabilization on
RBC Rheologic Behavior. Biorheology, 31, 207-215.
[70] Ahmad, I., Mehmood, Z. and Mohammad, F. (1998) Screening of Some Indian Me-dicinal Plants for Their Antimicrobial Properties. Journal of Ethnopharmacology, 62, 183-193. https://doi.org/10.1016/S0378-8741(98)00055-5
[71] Eloff, J.N. (1998) Which Extractan Should Be Used for Screening and Isolation of Antimicrobial Components from Plants? Journal of Ethnopharmacology, 60, 1-8. https://doi.org/10.1016/S0378-8741(97)00123-2
[72] Bhakuni, D.S., Dhar, M.L., Dhawan, B.N. and Mehrotra, B.N. (1969) Screening of Indian Plants for Biological Activity, Part II. Indian Journal of Experimental Biolo-gy,7, 250-262. https://doi.org/10.1016/S0168-1605(02)00169-1
[73] Alzoreky, N.S. and Nakahara, K. (2003) Antibacterial Activity of Extracts from Some Edible Plants Commonly Consumed in Asia. International Journal of Food Microbiology, 80, 223-230.
[74] Olano, I., Alonso Paz, E., Cerdeiras, M.P., Fernandez, J., Ferreira, F., Moyna, P., Soubes, M., Vázquez, A., Vero, S. and Bassagoda, M.J. (1996) Screening of the Uru-guayan Medicinal Plants for Anti-Microbial Activity. Part II. Journal of Ethno-pharmacology, 53, 111-115.
Highlights of the Study
We report and compare the anti-oxidant, anti-inflammatory and
an-ti-microbial activities of different solvent fractions of coconut testa.
The present study documents the maximum extractability of phenolics and
flavonoid compounds from CT exclusively in the methanolic fraction and the phenolic content reported to be highest among all previous studies on CT.
The methanolic fraction containing the phenolics had invariably the highest anti-oxidant activity in almost all assay methods. Anti-oxidant activity was also exhibited by solvent fractions containing the non-polyphenolic compounds.
The sequential soxhlet extraction process adopted here could be a potential
tool of isolating maximum phenolic compounds at least from CT.
The findings of the study reveal that CT is a rich source of various