International Journal of Geosciences, 2011, 2, 373-387
doi:10.4236/ijg.2011.23040 Published Online August 2011 (http://www.SciRP.org/journal/ijg)
Lineaments Extraction from Gravity Data by Automatic
Lineament Tracing Method in Sidi Bouzid Basin (Central
Tunisia): Structural Framework Inference and
Hydrogeological Implication
Hajer Azaiez1*, Hakim Gabtni1, Imen Bouyahya1, Dorra Tanfous2, Soumaya Haji3, Mourad Bedir1 1
Laboratoire de Géoressources, Centre de Recherches et des Technologies des Eaux,
Technopôle Borj-Cedria, Soliman, Tunisia
2
Institut Préparatoire aux Etudes d’Ingénieur de Bizerte, Zarzouna, Bizerte, Tunisia
3
Laboratoire 3E, Ecole nationale des ingénieurs de Sfax, Route de Soukra Km 4, Sfax, Tunisia E-mail: [email protected]
Received Feburary 2, 2011; revised May 11, 2011; accepted June 24, 2011
Abstract
The gravity method may be used in the exploration of deep sedimentary basins. It allows the structuring and the lateral and vertical extent of sedimentary fill to be determined. This study has concerned a qualitative and quantitative gravity analysis of Sidi Bouzid Basin in Central Tunisia. Bouguer anomaly analysis and Gravity data filtering allow us to emphasize the structures affecting the basin. The Automatic Lineament Tracing method helps to quantify the different gravity responses of faults located in the shallow and deep sedimen-tary sections and in the basement. The elaborated structural map of the study area constitutes a useful docu-ment for rationalizing the future groundwater exploration in the arid area of central Tunisia since it shows faults dipping and deep hydrogeologic sub-basin delineation.
Keywords:Gravity, Lineaments, Extraction, Tunisia, Hydrogeology
1. Introduction
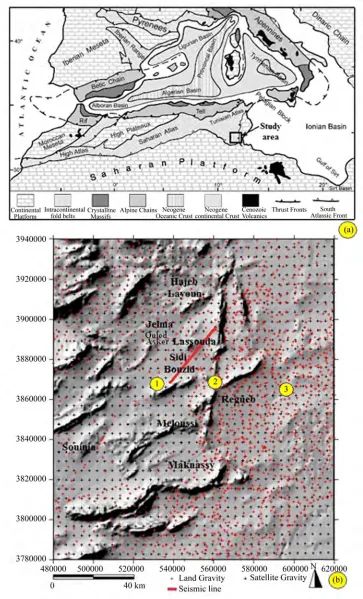
The Sidi Bouzid Basin, situated in central Tunisia ( Fig-ure 1), is characterized by a Mediterranean semi-arid to arid climate with irregular annual rainfalls and long dry periods. Use of groundwater is increasing in order to meet the demand for domestic, agricultural, and indus- trial needs. Therefore deep aquifer exploration and ex- ploitation become a necessity in this area.
Gravity data have been traditionally thought of as re- gional screening tools capable of providing basin defini- tions and basement mapping. However, in recent years, the application of potential field data has been greatly expanded to include global paleotectonic modelling through to modelling of prospect-level targets. One of the most important phases of any exploration screening pro-gram, particularly, in areas that lack seismic and well data, is the integration of potential field data with various geo-logical datasets to define structural elements, continental block outlines, and crustal types, with the aim of produc-ing a detailed, digital structural and geological coverage.
The gravity survey method was selected as the geo- physical method that would give a regional picture of the subsurface geology before making extensive surveys by the seismic reflexion method. Basically, the gravity sur- vey method detects and measures variations in the earth’s gravitational force. These variations are associated with changes in rock and alluvium density near the surface. Many geologic structures of interest in watershed ground- water hydrology cause disturbances in the normal density distribution which give rise to anomalies.
2. Geological Setting
H. AZAIEZ ET AL.
378
[image:2.595.118.481.80.679.2]H. AZAIEZ ET AL. 379
H. AZAIEZ ET AL.
380
Miocene NW-SE transverse grabens. The Atlassic chain in central Tunisia was marked during the Mesozoic by a complex mosaic of basins and highs (Kasserine Island) separated by major faults. One particular major struc- ture of this domain is the N-S axis (NOSA) [1] (Figure 2). It is a 100 km long N-S trending tight fold crossing the whole Atlasic domain of central Tunisia. This struc- ture resulted from the polyphase reactivation of an inher- ited Pan-African or Paleozoic lineament. During several Mesozoic periods, the N-S axis acted as a basin bound- ary, separating zones with low and high subsidence rates [2].
Central Tunisia, including the study area, was part of the southern Tethyan Platform which underwent Trias- sic-Jurassic extension. During Tertiary compression, the Atlasic domain was highly deformed. The end of the Eocene was marked by the onset of strong compressional tectonism, causing the destruction of the basin and the end of marine conditions in southern Tunisia [3] and [4].
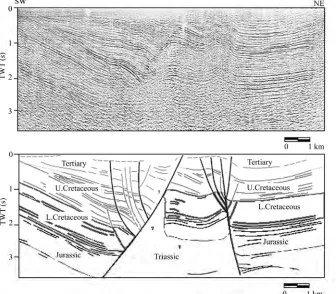
An example of seismic profile (Figure 3, location on
Figure 1) inside Bouzid basin shows the variety of struc- tural styles including horst, graben, half-graben, uplifted fault blocks.
3. Hydrostratigraphic Setting
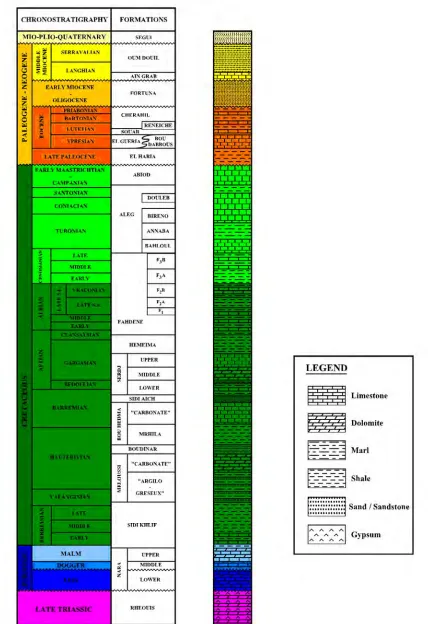
The geological cover of the Sidi Bouzid basin is a thick
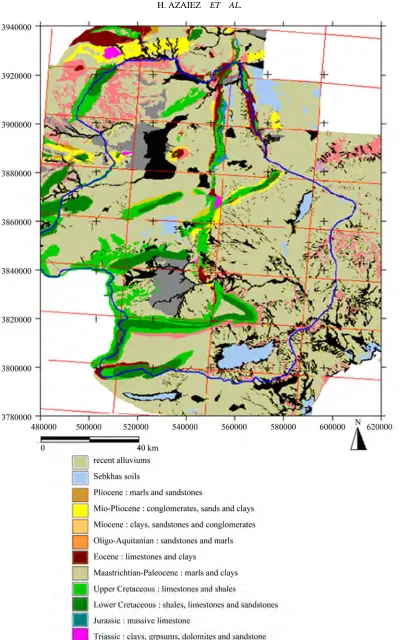
sedimentary stack from Triassic to Quaternary. Here down, a brief and synthetic description according to the geological maps of Sidi Bouzid basin (Figure 4):
- Composed of gypsum, anhydrites, clays or dolomites (Rheouis formation), the discordant Triassic extrusions are behind the structural complexity in Central Tunisia, and contribute to the mineralization and moderation of the ground water quality [5].
- The Jurassic is represented by Nara Formation [1] with two carbonate members separated by an irregular marly and oolitic middle member [6]. The outcrops are along the N-S Axis.
- The Cretaceous outcrops are wide-spread and com-mon in Central Tunisia and form the body structure of the main anticlines. The Neocomian series consist of three formations representing a deltaic progra- dation towards the North: Sidi Khalif, Meloussi, and Boudinar Formations. Lower Cretaceous deposits are characterized by competition between terrigenous progradation from the Saharan Craton and marine carbonate deposits that predominate in the North [7].
[image:4.595.131.467.408.702.2]The Zeabbag (Albo-Cenomanian) formation includes two carbonate members separated by a clay and gypsum middle member. The Aleg (Turonian to early Campa- nian) is a thick series of gray marl and shale interbedded between the top of Zebbag or Fahdene formations and
H. AZAIEZ ET AL. 381
H. AZAIEZ ET AL.
382
the Abiod formation [8]. The Abiod (Campanian-Maestri- chtian) is essentially made up of carbonates, generally chalky limestones.
4. Gravity Data
The Land gravity data used for this study were obtained from the “Entreprise Tunisienne d’Activités Pétrolières” (ETAP) (Figure 1). All the data were merged and re-duced using the 1967 International Gravity formula [9]. Free Air and Bouguer gravity corrections were made using sea level as a datum and 2.67 g/cm3 as a reduction density. The Bouguer gravity anomaly data were gridded at 2 km spacing and contoured to produce a Bouguer gravity anomaly map (Figure 4).
The Satellite Bouguer Gravity data were obtained from the Bureau Gravimétrique International (BGI). The re- gional Free-air and Bouguer gravity anomaly grids (av-eraged over 2.5 arc-minute by 2.5 arc-minute) are com-puted at BGI from the EGM2008 spherical harmonic coefficients [10]. The Bouguer corrections computed at regional scales are obtained using the FA2BOUG code developed by [11]. The topographic correction is applied
up to a distance of 167 km using the 1 arc-minute by 1 arc-minute ETOPO1 Digital Elevation Model. Density reduction for Bouguer anomaly: 2.67 g/cm3.
The Satellite Bouguer gravity anomaly data were gridded and contoured to produce a Satellite Bouguer gravity anomaly map (Figure 5).
5. Bouguer Gravity Analysis
5.1. Land Bouguer Gravity Map
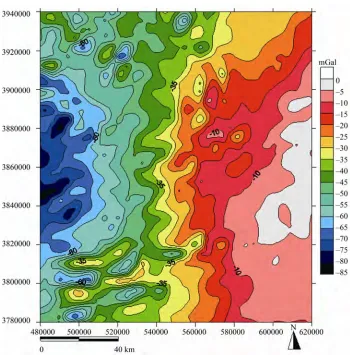
The Figure 5 represents the Land Bouguer gravity map of the study area. The anomaly values vary from –80 mGal to 5 mGal. It shows gravity highs and lows of variable dimensions and amplitudes. Bouguer gravity lows represent potential areas for hydrogeological ex-ploration associated with the filling of this area by light sediments.
5.2. Satellite Bouguer Gravity Map
[image:6.595.127.468.367.705.2]The Bouguer gravity anomaly values (Figure 6) in the study area vary from –85 mGal to 0 mGal and are gener-
H. AZAIEZ ET AL. 383
Figure 6. Satellite Bouguer gravity map of Sidi Bouzid basin and surrounding area.
ally low in its western parts. The highest anomaly values are observed in eastern part of the map. The Bouguer gravity map shows a regional variation from East (posi-tive anomalies) to West (nega(posi-tive anomalies). This varia-tion represents the regional gravity field that is deter-mined from crustal thickness variations [12] and [13].
6. Automatic Lineament Detection Map
Analysis
The automatic lineament detection algorithm required the data to have been processed (or transformed) such that the edge of a causative body is located beneath a maximum in the grid. Several transforms satisfy this re- quirement e.g. horizontal derivative of gravity data [14] and also analytic signal.
The results help to quantify the different gravity re- sponses of structures located in the shallow and deep sedimentary sections and in the basement. A significance factor N, ranging in value from 0 to 4, is assigned to each grid cell depending on the relation to its neighbours. N = 1 might represent a point on a spur, N = 2 and N = 3 a
point on a ridge and N = 4 a point on a peak. The values of N are colour coded and displayed as a grid [15]. These lineament grids can then be displayed on top of any other grid.
Maxima and horizontal derivative map from the satel-lite Bouguer anomaly are shown in Figure 7. They show alignments outlining the contacts. The resulting struc-tural map explains some hydrogeological problems: 1) the change of direction of groundwater flow; 2) change of quality of groundwater (like salinity).
H. AZAIEZ ET AL.
[image:8.595.148.445.76.354.2]
384
Figure 7. Overlay of maxima and horizontal derivative map from the satellite Bouguer anomaly and vector direction derived from satellite Bouguer gravity of Sidi Bouzid basin and surrounding area.
[image:8.595.183.414.394.671.2]H. AZAIEZ ET AL. 385
H. AZAIEZ ET AL.
386
direction derived from Satellite Bouguer gravity give an aspect of the preferred directions of lateral water accu- mulation. This original prediction allowed as better rec- ognizing and evaluating the regional groundwater poten- tial of Sidi Bouzid sedimentary sub- basins (1: Hajeb El Ayoun graben, 2: Jelma basin, 3: Ouled Asker basin, 4: Oued El Hajal basin, 5: Sidi Bouzid basin, 6: Hor- chane-Braga basin, 7: Meknassy basin, 8: Bled Regueb basin) in central Tunisia.
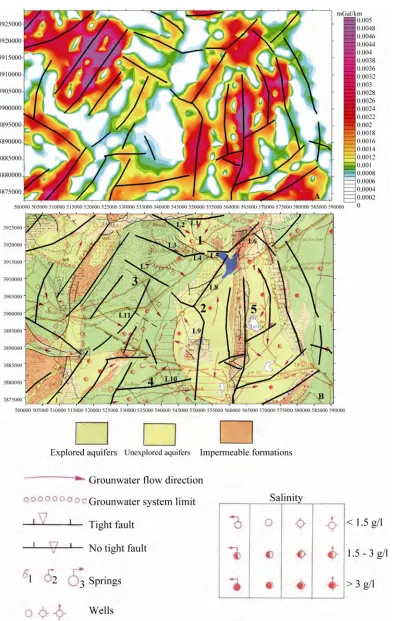
7. Hydrogeological Implication
The surimposition of lineaments after the Horizontal Gravity Gradient map (Figure 9(A)) and the hydro-geological map of the Sidi Bouzid basin (Figure 9(B)) shows the importance of the determined regional gravity trends and their influence related to the groundwater flow directions and the groundwater systems relations. The lineaments: L1, L2 L3, L4, L5 and L6 (Figure 9(B)) correspond to deep faults bordering the Hajeb El Ayoun groundwater system (1, Figure 9(B)). Lineaments L4 and L5 are, also, associated with hot springs (Figure 9(B)). L7, L8, L9, L10 and L11 lineaments embody ma-jor limits between different groundwater systems: Oued El Hajel groundwater system (2, Figure 9(B)); Jelma groundwater system (3, Figure 9(B)) and Sidi Bouzid groundwater system (4, Figure 9(B)). We can note also the influence of faults on the hydrodynamism and groundwater flow directions in the Bahira groundwater system (5, Figure 9(B)).
8. Conclusions
The structural map produced, according to the gravity data analysis and processing, shows the N-S, NE-SW and NW-SW fault system bordering the sub-basins in the survey area. These faults may have significant implica-tions for groundwater quality and quantity in Sidi Bouzid basin. Indeed, they may exhibit enhanced permeability or serve as barriers to subsurface fluid flow, depending upon a number of variables related to host rock/sediment lithology, fault zone diagenesis, and faulting mecha-nisms.
This map forms the basis for planning future hydro-geological research in this region. Further investigation, is necessary to verify the presence of the lineaments identified during this study, and their relationship to hy-drogeologic features. Some of the types of investigation that could be initiated are:
• Seismic reflection-refraction geophysical surveys. Two-dimensional surveys across the study area will pro-vide valuable data to further evaluate precisely fracture zones. Specific areas of interest can be further defined
with 3-dimensional seismic surveys.
• Hydrogeologic investigations such as aquifer per-formance with multiple monitoring zones in the aquifers and confining units will help to validate potential im-pacts of fractures on the hydrogeologic system. Tracer tests or tomography could also be employed at specific locations to evaluate the presence of fractures and groundwater movement.
• Detailed geologic analyses incorporating available geophysical, hydrogeologic, and geochemical data will provide further analyses of variances in hydraulic char-acteristics and water quality.
9. References
[1] P. F. Burollet, “Contribution à l’étude Stratigraphique de la Tunisie Centrale,” Annales des Mines et de la Geologie, Vol. 18, 1956, p. 350.
[2] S. Bouaziz, E. Barrier, M. Soussi, M. M. Turki and H. Zouari, “Tectonic Evolution of the Northern African Margin in Tunisia from Paleostress Data and Sedimentary Record,” Tectonophysics, Vol. 357, No. 1-4, 2002, pp. 227-253. doi:10.1016/S0040-1951(02)00370-0
[3] M. Bédir, “Mécanismes Géodynamiques des Bassins Associés aux Couloirs de Coulissement de la Marge At-lasique de la Tunisie: Sismo-Stratigraphie, Sismo-tec-tonique et Implications Pétrolières,” Thèse de Doctorat Es Sciences, Tunis, 1995, p. 412.
[4] A. Hlaiem, “Etude Géophysique et Géologique des Bas-sins et des Chaînes de Tunisie Centrale et Méridionale Durant le Mésozoïque et le Cénozoïque: Evolution Structurale, Modélisation Géothermique et Implications Pétrolières, Thèse Doctorat de troisième Cycle,” Univer-sité de Pierre & Marie Curie, Paris, 1998, p. 315.
[5] H. Smida, “Apports des Systèmes d’Informations Géogra- phiques (SIG) pour une Approche Intégrée dans l’étude et la Gestion des Ressources en eau des Systèmes Aquifères de la Région de Sidi Bouzid (Tunisie cen-trale),” Université de Sfax, Thèse Doctorat, 2008, p. 341. [6] M., Soussi, “Nouvelle Nomenclature Lithostrati Graphique
Evenementielle Pour le Jurassique de la Tunisie at-lasique,” Geobios, Vol. 36, 2003, pp. 761-773.
[7] H. Azaïez, M. Bédir, D. Tanfous, M. Soussi, “Seismic Sequence Stratigraphy and Platform to Basin Reservoir Structuring of Lower Cretaceous Deposits in the Sidi Aich-Majoura Region (Central Tunisia),” Journal of Af-rican Earth Sciences, Vol. 48, No. 1, 2007, pp. 1-18.
doi:10.1016/j.jafrearsci.2007.02.009
[8] T. Zouaghi, “Distribution des Séquences de Dépôt du Crétacé (Aptien - Maastrichtien) en Subsurface: Rôle de la Déformation Tectonique, L’halocinèse et Évolution Géodynamique (Atlas central de Tunisie),” Université de Tunis El Manar, Thèse Doctorat, 2008.
[9] C. Morelli, “Modern Standards for Gravity Survey,” Geo-physics, Vol. 41, 1976, p. 1051. doi:10.1190/1.1440661
H. AZAIEZ ET AL. 387
“An Earth Gravitational Model to Degree 2160: EGM2008,” EGU General Assembly, Vienna, 2008. [11] J. Fullea, M. Fernandez, H. Zeyen, “FA2BOUG - A
FORTRAN 90 Code to Compute Bouguer Gravity Anomalies from Gridded Free-Air Anomalies: Applica-tion to the Atlantic-Mediterranean TransiApplica-tion Zone,”
Computers & Geosciences, Vol. 34, No. 12, 2008, pp. 1665-1681. doi:10.1016/j.cageo.2008.02.018
[12] H. Buness, et al., “The EGT’85 Seismic Experiment in Tunisia: A Reconnaissance of the Deep Structures,” In: R. Freeman and S. Muller, Eds., Sixth Workshop on the European Geotraverse Project, Data Compilations and Synoptic Interpretation, European Science Foundation, Strasbourg, 1989, pp. 197-210.
[13] H. Gabtni, “Caractérisation Profonde et Modélisation Géophysique des Zones de Transition entre Les Différents Blocs Structuraux de la Tunisie Centro-Méridionale,” Uni-versité de Tunis El Manar, Thèse Doctorat, 2006, p. 24. [14] L. Cordell and V. J. S. Grauch, “Mapping Basement
Magnetization Zones from Aeromagnetic Data in the San Juan Basin, New Mexico,” In: W. J. Hinze, Ed., The Util-ity of Regional GravUtil-ity and Magnetic Anomaly Maps, Society of Exploration Geophysicists, Tulsa, 1985, pp. 181-197.
[15] R. J. Blakely and R. W. Simpson, “Approximating Edges of Source Bodies from Magnetic or Gravity Anomalies,”
Geophysics, Vol. 51, No. 7, 1986, pp. 1494-1498.