Journal of Water Resource and Protection, 2011, 3, 473-486
doi:10.4236/jwarp.2011.37057 Published Online July 2011 (http://www.SciRP.org/journal/jwarp)
Pollution Status of Two River Estuaries in the
Eastern Cape, South Africa, Based on Benthic
Meiofauna Analyses
T. K. Gyedu-Ababio
Kruger National Park, P/Bag 1021 Phalaborwa 1390 South Africa E-mail: [email protected]
Received March 31, 2011; revised May 2, 2011; accepted June 7, 2011
Abstract
The benthic meiofauna of the two river systems, the Swartkops and Gamtoos, in the Eastern Cape of South Africa has been studied extensively. Various biological indices and statistical packages were used to assess the biological status of the nematode communities in the two rivers. Nematode identification was done to the genus level. Various environmental conditions, including, concentrations of Zn, Mn, Fe, Cu and Pb, organic carbon and chlorophyll-a in the sediments, were investigated in relation to the nematode density, diversity and community structure. The results of the studies indicate that higher concentrations of heavy metals had a negative impact on the nematode density, diversity and community structure. Nematode genera such as
Rhabditis, Monhystera and Theristus were found to be tolerant to pollution or indicators of pollution. The Swartkops River estuary was found to be polluted more severely than the Gamtoos. It was realised that some nematode genera such as Viscosia can establish themselves along the river estuaries, irrespective of the salin-ity gradient. The quantitative effects of individual metals on the structure of meiobenthic communities could not be differentiated from one another. Similarly, the effects of metals and organic carbon on the structuring of the nematode communities could not be distinguished from one another. It is suggested that more studies of this kind be carried out along the coast of Africa to establish the potential indicator value of nematodes on the African continent.
Keywords:Meiofauna, Nematodes, Heavy Metals, Pollution, Community Structure, Sediment
1. Introduction
It has been observed that estuaries are among the most productive ecosystems in the world and are very vulner-able to anthropogenic activities. Despite this, they are subject to development pressures such as harbour devel-opment, land reclamation, urban encroachment, pollution and other anthropogenic inputs [1,2]. Many researchers have used meiofauna and nematodes in particular as in-dicators of pollution in different environments. They include [3-9]. A similar study [10] that applied toxicity tests on the whole nematode community from Restr- onguet Creek, a severely contaminated estuary, showed that nematodes are more resistant to copper than those from an adjacent, less contaminated estuary. This is a result of an increase in the abundance of Cu resistant species, the evolution of enhanced Cu tolerance in some species and the probable exclusion of more sensitive
species.
[2] Observed that tolerance to copper and zinc in the benthic polychaete Nereis diversicolor is inherited. This makes it possible to use the occurrence of metal tolerant individuals to map the ecological impact of contamina-tion by these metals.
Although there have been some studies on meiofauna in South Africa [11-14], only a few have concentrated on using nematodes as pollution indicators [15,16]. The community structure of the benthic meiofauna of the Swartkops estuary, with special reference to nematodes, was investigated in relation to contaminants in the estu-ary [15]. No studies on the meiofauna of the Gamtoos estuary have been undertaken prior to this study.
474 T. K. GYEDU-ABABIO
estuary as well. The Gamtoos estuary on the other hand is not industrialised. The impact on the Gamtoos is mainly from farming activities in the form of irrigation and livestock watering.
One objective of this study was to use differences in benthic meiofauna (nematode) communities as a means to contrast the “polluted” Swartkops estuary and the less impacted Gamtoos estuary. Another objective of the study was to confirm the pollution indicator status of some of the nematode genera identified by [15].
2. Study Area
The Swartkops River estuary is situated in Algoa Bay, about 15 km east of the Port Elizabeth Harbour at 33.87˚ S and 25.63˚ E. The estuary is 16 km long from its mouth to the head. The estuary is characterised by sandy beaches on the south bank and at the mouth, but the north bank rapidly gives way to many jetties and launching ramps from the residential area of
Amster-damhoek. In the lower and middle reaches, mud flats and salt marshes occur, but these become less extensive as the estuary narrows towards the upper reaches. At the head of the estuary, which is marked by a concrete cau-seway, the substratum consists of rounded boulders and the banks are steep.
The Gamtoos River discharges into St. Francis Bay, west of Port Elizabeth and is situated at 33.88˚ S and 25.62˚ E. The upper reaches of the Gamtoos River estu-ary are characterised by sandy beaches with shrub vege-tation along their banks. Unlike the Swartkops River which is highly urbanised and industrialised, the Gam-toos River estuary flows through agricultural lands. The Gamtoos River estuary is about 21 km in length.
3. Methods
[image:2.595.114.483.337.627.2]Field sampling for meiofauna and environmental factors was undertaken in the two estuaries from May 1997 to March 1998 on bi-monthly basis at neap tide in sub-tidal
Figure 1. Map of South Africa showing the location of the Swartkops and Gamtoos River estuaries and the various sampling sites. The sites in the Swartkops River estuary are (L) at mouth of the estuary; (CRM) at the Chatty River mouth, in the middle reaches, close to the mouth of the Swartkops River estuary; (J) at Motherwell canal in the middle reaches but nearer to the upper reaches of the estuary and (KC) Kat Canal in the fresh water reaches of the Swartkops River. Amsterdamhoek, Swartkops, Motherwell, Redhouse and Perseverance are all settlements or towns. Sites GA, GB, GC were located in the Gamtoos River estuary at the mouth, middle and upper reaches respectively. Site GD was situated above the tidal mark in the fresh water reaches of the river. The abbreviations used in the naming of the sites—G stands for Gamtoos River estuary
nd the A, B, C and D denotes which site has higher salinity beginning from the mouth. a
T. K. GYEDU-ABABIO 475
zones. This sampling period follows a previous study of the meiofauna community in the Swartkops River estuary conducted between May 1995 and March 1996 [15]. The sampling sites in the Swartkops River estuary were se-lected to include sites CRM & KC, identified as polluted and L as unpolluted [15]. The salinity ranges were 25 - 30; 10 - 18; 5 - 7 and 0 - 0.5 PSU units for sites L, CRM, J and KC respectively. The sites selected along the Gamtoos River estuary, GA, GB, GC and GD had salin-ity gradients and sediment particle size distributions sim-ilar to the corresponding sites selected along the Swart-kops River estuary. Sampling was done using a hand held perspex corer (1 m long and 6.5 cm diameter) which penetrated to a depth of 10 cm as most of the meiofauna are normally found in the top 10 cm of the sediment [17]. Three replicate samples were taken for meiofaunal anal-ysis at each site on each sampling trip. Samples for heavy metal analyses were taken in May 1997 and in March 1998 since the concentrations of the metals did not vary on a bi-monthly basis. Two water samples per site were taken bimonthly for chlorophyll-a analysis over the sampling period.
Nematode extraction was done using a centrifugal flo-tation method using sucrose solution as a separating agent [18]. Nematodes were placed in 5% formalin and counted under stereo microscope using a sorting tray as described in [15]. Nematode counts were converted to numbers per m2 and identification done using the picto-rial key [19].
Heavy metal analyses were carried out, using the methods described in [15]: Shimadzu sequential plasma spectrometer (ICPS–1000II) and the calibration curve method. The chlorophyll-a concentration was determined, using the method [20]. Sediment analysis was done using the method described by [21]: A 30-g portion of the se-diment from each site was washed with tap water and reweighed after drying. The dry samples were put on the topmost of a nest of sieves (with mesh size ranging from 0.002 m to 2 mm) and sieved by a machine for 8 min-utes. The fractions of each sieve were weighed. The me-dian grain size, sorting values, mud composition and all the other sand fractions were determined using a com-puter programme, SANDX – Sandsta.baj as described by [15].
4. Statistical Analyses
Normal distribution tests were done to assess the homo-geneity or normality of samples. ANOVA and LSD tests were used to compare the nematode densities, organic content, chlorophyll-a, trophic and population structure at all eight sites in the two river estuaries during the
sampling months. Statistical tests were made for simi-larities in, and difference between the sampling sites within and between the estuaries in the nematode attrib-utes and environmental factors (salinity, pollutants and sediment particle size distribution). The nematode densi-ties were log-transformed to reduce variability in the replicate samples. Absolute numbers were however used in relative abundance calculations. The relationship be-tween seasons and the environmental factors on the nematode attributes was also investigated using correla-tion and regression analysis, (parametric and non-para-metric) including Spearman-Rank Correlation and Bio-env test which is a programme within the [22] package. The Spearman-Rank Weighted Correlation/Bioenv test ranks all the environmental factors based on their influ-ence on a particular community attribute, e.g. density or diversity.
The Maturity Index (MI) [23]: was calculated as the weighted average of the individual colonizer-persister (c-p) values.
MI f
Where, is the c-p value of the taxon (genus) () and () is the frequency of the taxon in the sample. The MI is proposed here as a semi quantitative value, which indi-cates the condition of an ecosystem, based on the com-position of the “nematode community”.
Multivariate statistical techniques allow us to summa-rize the structure of the species associations with mini-mal loss of complexity [24]. A similarity matrix was constructed using the Bray - Curtis measure of similarity on 4th root transformation of the nematode attributes to further assess the similarity between the sites. The envi-ronmental factors were superimposed on the nematode attributes using the Primer programme. The relationship between the community structure and environmental parameters was analysed using the CCA (Canonical Correspondence Analysis) option from the software CANOCO [25]. It was used on the data to determine which species are associated with environmental factors that are most important in the structuring of the commu-nities [24].
5. Results
5.1. Sediment Particle-Size Distribution
476 T. K. GYEDU-ABABIO
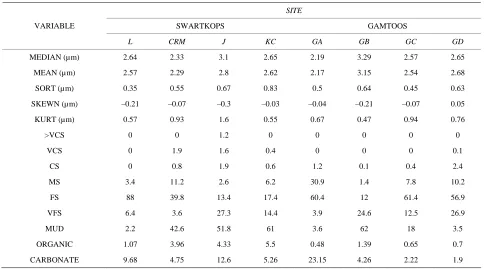
total carbonate component (%) of the sediment was sim-ilar in the two river estuaries although differences existed between specific sites. The % carbonate was highest at site GA. Site L in the Swartkops River estuary has a sim-ilar sediment particle-size distribution to sites GA, GC and GD in the Gamtoos River estuary. Site GB in the Gamtoos River estuary had a similar sediment parti-cle-size distribution to the other three sites in the Swart-kops River estuary, namely CRM, J and KC (Table 1). The percentage organic carbon content of the sediment at the eight sites in the two estuaries is shown in Table 1, and indicates that the Swartkops River estuary is rela-tively enriched with organic matter.
5.2. Chlorophyll-a Concentrations of Bottom Se-diments
There were higher benthic chlorophyll-a concentrations in the Swartkops River estuary, especially at site KC, compared with sites in the Gamtoos River estuary (Table 2). There was no significant difference (P > 0.05, ANOVA) in chlorophyll-a between sites in the Swartkops estuary. There was also no significant difference (P > 0.05, ANOVA) in chlorophyll-a on a temporal basis, at each of the four sites in the Swartkops River estuary. Lower chlorophyll-a values were recorded in the Gamtoos River estuary. Significant differences however existed between
sites both spatially and temporally in the Gamtoos estu-ary.
5.3. Heavy Metals in the Sediments of the Swartkops and Gamtoos River Estuaries
Sites GA had the lowest concentrations of the metals. Site CRM was found to be significantly different (P < 0.05, ANOVA) from the other sites in terms of metal concentrations. Sites J and KC also had high concentra-tions of the metals Cu, Fe, and Mn as compared with other sites in both river estuaries (Table 3).
5.4. Meiofauna
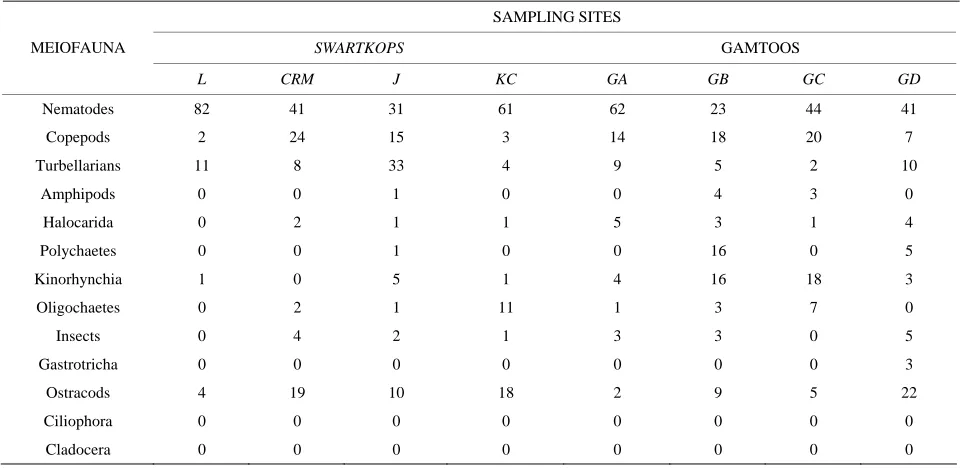
[image:4.595.56.540.439.708.2]The main meiofauna taxa in the Swartkops River estuary were found to be nematodes, Turbellaria, ostracods and copepods, in order of numerical importance. Copepods had a lower percentage composition amongst the meio-fauna in the Swartkops River estuary compared with the Gamtoos River estuary (Table 4). Gastrotricha was not represented at all in the Swartkops River estuary in this study. A percentage dominance curve of the meiofauna taxa in the two river estuaries is shown in Figure 2. It shows that the Swartkops River estuary had a higher percentage dominance of the meiofauna taxa (very few taxa with higher numbers) as compared to the Gamtoos
Table 1. Sediment particle-size distribution at the 8 study sites in the Swartkops and Gamtoos River estuaries (May 1997- March 1998).
SITE
SWARTKOPS GAMTOOS
VARIABLE
L CRM J KC GA GB GC GD
MEDIAN (µm) 2.64 2.33 3.1 2.65 2.19 3.29 2.57 2.65
MEAN (µm) 2.57 2.29 2.8 2.62 2.17 3.15 2.54 2.68
SORT (µm) 0.35 0.55 0.67 0.83 0.5 0.64 0.45 0.63
SKEWN (µm) –0.21 –0.07 –0.3 –0.03 –0.04 –0.21 –0.07 0.05
KURT (µm) 0.57 0.93 1.6 0.55 0.67 0.47 0.94 0.76
>VCS 0 0 1.2 0 0 0 0 0
VCS 0 1.9 1.6 0.4 0 0 0 0.1
CS 0 0.8 1.9 0.6 1.2 0.1 0.4 2.4
MS 3.4 11.2 2.6 6.2 30.9 1.4 7.8 10.2
FS 88 39.8 13.4 17.4 60.4 12 61.4 56.9
VFS 6.4 3.6 27.3 14.4 3.9 24.6 12.5 26.9
MUD 2.2 42.6 51.8 61 3.6 62 18 3.5
ORGANIC 1.07 3.96 4.33 5.5 0.48 1.39 0.65 0.7
CARBONATE 9.68 4.75 12.6 5.26 23.15 4.26 2.22 1.9
T. K. GYEDU-ABABIO 477
Table 2. Chlorophyll-a values (µg per m2) at the sites in the two river estuaries (May 1997 to March 1998).
SWARTKOPS GAMTOOS
Month
L CRM J KC GA GB GC GD
May ‘97 21.48 24.44 5.04 52.00 6.96 8.87 3.48 6.52
July ‘97 11.91 17.42 8.71 21.39 3.48 4.52 1.22 3.04
September ‘97 12.34 15.71 47.76 946.02 59.69 30.83 8.51 19.62
November ‘97 12.13 16.57 28.24 483.71 31.58 17.67 4.86 11.33
January ‘98 15.24 19.19 20.51 120.23 23.37 14.74 4.40 9.73
March ‘98 14.46 18.53 22.44 41.22 25.43 15.47 4.52 10.13
Mean 14.59 18.64 22.12 277.43 25.09 15.35 4.50 10.06
Std deviation 3.64 3.11 15.29 370.53 20.18 9.00 2.37 5.57
[image:5.595.57.539.307.448.2]Std Error 1.49 1.27 6.24 151.27 8.24 3.67 0.97 2.27
Table 3. Mean metal concentrations (µg/g sediment) at the sampling sites in the Swartkops and Gamtoos River esturies in May 1997 and March 1998 (SD values in brackets).
SITES
SWARTKOPS GAMTOOS Metals
L CRM J KC GA GB GC GD
Cu 46 (0.03) 65 (3.0) 67 (7.02) 69 (8.58) 57 (0.15) 65(1.41) 54 (0.07) 55 (4.19)
Fe 1900 (14.14) 4500 (84.85) 16420 (565.69) 16400 (282.84) 3520 (28.28) 12630 (77.78) 6850 (70.71) 5600 (141.42)
Mn 64 (5.66) 188 (2.83) 229 (1.70) 302 (2.83) 161 (7.07) 191 (1.41) 104 (5.66) 84 (0.71)
Pb BD 39 (4.24) BD BD BD BD BD BD
Sn 3050 (14.14) 9660 (226.27) 1240 (141.42) 1910 (197.99) 6680 (183.85) 190 (14.14) 300 (21.21) 820 (28.28)
Zn 24 (1.41) 69 (2.83) 72 (14.14) 210 (0) 22 (1.41) 39 (0) 30 (0) 43 (2.12)
BD—Below detection limit
Table 4. Mean percentage composition of meiofauna in the Swartkops and Gamtoos River estuaries (May 1997-March 1998).
SAMPLING SITES
SWARTKOPS GAMTOOS
MEIOFAUNA
L CRM J KC GA GB GC GD
Nematodes 82 41 31 61 62 23 44 41
Copepods 2 24 15 3 14 18 20 7
Turbellarians 11 8 33 4 9 5 2 10
Amphipods 0 0 1 0 0 4 3 0
Halocarida 0 2 1 1 5 3 1 4
Polychaetes 0 0 1 0 0 16 0 5
Kinorhynchia 1 0 5 1 4 16 18 3
Oligochaetes 0 2 1 11 1 3 7 0
Insects 0 4 2 1 3 3 0 5
Gastrotricha 0 0 0 0 0 0 0 3
Ostracods 4 19 10 18 2 9 5 22
Ciliophora 0 0 0 0 0 0 0 0
[image:5.595.57.539.487.721.2]T. K. GYEDU-ABABIO 478
difference (P < 0.05, ANOVA) nematode numbers be-tween sites in the Gamtoos estuary but not bebe-tween the sampling. Site L had the highest total mean number (0.8 × 10⁶ ind/m2) of nematodes and site J (0.18 × 10⁶ ind/m2) the lowest in the Swartkops River estuary during the pe-riod of study. Site GD had the lowest number of nema-todes (0.03 × 10⁶ ind/m2) in the Gamtoos River estuary (Table 6). Higher nematode densities were obtained during the summer months of September and November 1997 in both Swartkops and Gamtoos River estuaries. Nematodes numbers were lowest in May 1997 in the Gamtoos River estuary but in the Swartkops, lower num- bers were obtained in January and March 1998.
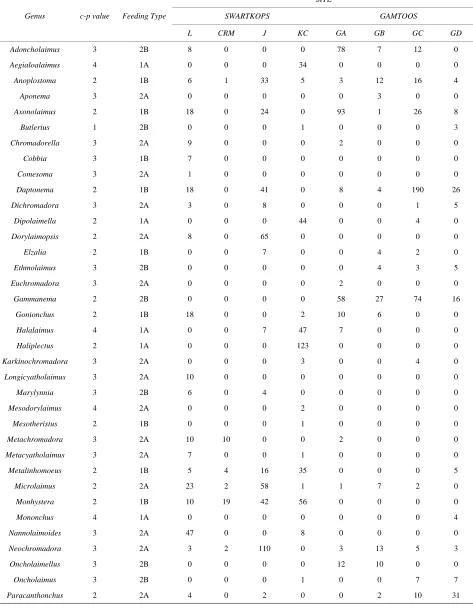
[image:6.595.58.286.62.257.2]The genera recorded in this study are presented as Ta-ble 7. Significant difference (P < 0.05, ANOVA) existed between the four sites and the sampling months in the numerical distribution of the nematode genera in the Swartkops River estuary over the one-year sampling pe-riod. Site L at the mouth of the Swartkops River estuary had the highest number of nematode genera, while site CRM had the least number of genera over the study pe-riod. No significant difference (P > 0.05, ANOVA) in the number of nematode genera existed either between the sampling months or between the four sites in the Gam-toos River estuary, GA, GB, GC and GD. Thus, unlike the Swartkops River estuary, distribution of the nematode
Figure 2. k-dominance curves formeiofauna in the
Swart-kops and Gamtoos River estuaries (May 1997-March 1998). SWA - Swartkops; GAM - Gamtoos.
River estuary. Thus, Gamtoos River estuary had a greater number of taxa (diversity) with no significant differences in their numbers.
[image:6.595.58.538.429.508.2]ANOVA performed on the nematode numbers, both spatial and temporal, in the Swartkops River estuary in-dicated a significant difference (P < 0.05) between sites and sampling months (Table 5). There was a significant
Table 5. Variation in nematode numbers on spatial and temporal basis in the Swartkops River estuary (May 1997 to March 1998)
Source of Variation SS df MS F P-value F crit
Months (temporal) 541579.3 5 108315.9 5.903852 0.003282 2.801295
Sites (spatial) 280462.3 3 93487.44 5.095615 0.012499 3.287383
Error 275199.7 15 18346.64
Total 1097241 23
Table 6. Mean monthly nematode density (No./m2) at the study sites in the Swartkops and Gamtoos River estuaries from May
1997 to March 1998 (SD in brackets).
SITES
SWARTKOPS GAMTOOS
Density/m2
L CRM J KC GA GB GC GD
May '97 1.32 × 10⁶ 0.07 × 10⁶ 0.34 × 10⁶ 0.36 × 10⁶ 0.10 × 10⁶ 0.01 × 10⁶ 0.09 × 10⁶ 0.03 × 10⁶
July '97 0.30 × 10⁶ 0.66 × 10⁶ 0.07 × 10⁶ 0.39 × 10⁶ 0.39 × 10⁶ 0.11 × 10⁶ 0.23 × 10⁶ 0.05 × 10⁶
September ‘97 1.61 × 10⁶ 1.04 × 10⁶ 0.44 × 10⁶ 0.73 × 10⁶ 0.39 × 10⁶ 0.04 × 10⁶ 0.05 × 10⁶ 0.01 × 10⁶
November ‘97 1.30 × 10⁶ 0.54 × 10⁶ 0.20 × 10⁶ 0.44 × 10⁶ 0.29 × 10⁶ 0.06 × 10⁶ 0.09 × 10⁶ 0.02 × 10⁶
January ‘98 0.15 × 10⁶ 0.01 × 10⁶ 0.02 × 10⁶ 0.04 × 10⁶ 0.13 × 10⁶ 0.06 × 10⁶ 0.66 × 10⁶ 0.03 × 10⁶
March ‘98 0.13 × 10⁶ 0.01 × 10⁶ 0.01 × 10⁶ 0.03 × 10⁶ 0.02 × 10⁶ 0.08 × 10⁶ 0.18 × 10⁶ 0.04 × 10⁶
Mean (SD)
0.80 × 10⁶
(0.6 × 10⁶)
0.39 × 10⁶
(0.43 × 10⁶)
0.18 × 10⁶
(0.18 × 10⁶)
0.33 × 10⁶
(0.26 × 10⁶)
0.22 × 10⁶
(0.16 × 10⁶)
0.06 × 10⁶
(0.03 × 10⁶)
0.22 × 10⁶
(0.23 × 10⁶)
0.03 × 10⁶
[image:6.595.58.540.546.723.2]T. K. GYEDU-ABABIO 479
Table 7. Nematode numbers, feeding type and c-p values at study sites in the Swartkops and Gamtoos River estuaries (May 1997 to March 1998).
SITE
SWARTKOPS GAMTOOS Genus c-p value Feeding Type
L CRM J KC GA GB GC GD
Adoncholaimus 3 2B 8 0 0 0 78 7 12 0
Aegialoalaimus 4 1A 0 0 0 34 0 0 0 0
Anoplostoma 2 1B 6 1 33 5 3 12 16 4
Aponema 3 2A 0 0 0 0 0 3 0 0
Axonolaimus 2 1B 18 0 24 0 93 1 26 8
Butlerius 1 2B 0 0 0 1 0 0 0 3
Chromadorella 3 2A 9 0 0 0 2 0 0 0
Cobbia 3 1B 7 0 0 0 0 0 0 0
Comesoma 3 2A 1 0 0 0 0 0 0 0
Daptonema 2 1B 18 0 41 0 8 4 190 26
Dichromadora 3 2A 3 0 8 0 0 0 1 5
Dipolaimella 2 1A 0 0 0 44 0 0 4 0
Dorylaimopsis 2 2A 8 0 65 0 0 0 0 0
Elzalia 2 1B 0 0 7 0 0 4 2 0
Ethmolaimus 3 2B 0 0 0 0 0 4 3 5
Euchromadora 3 2A 0 0 0 0 2 0 0 0
Gammanema 2 2B 0 0 0 0 58 27 74 16
Gonionchus 2 1B 18 0 0 2 10 6 0 0
Halalaimus 4 1A 0 0 7 47 7 0 0 0
Haliplectus 2 1A 0 0 0 123 0 0 0 0
Karkinochromadora 3 2A 0 0 0 3 0 0 4 0
Longicyatholaimus 3 2A 10 0 0 0 0 0 0 0
Marylynnia 3 2B 6 0 4 0 0 0 0 0
Mesodorylaimus 4 2A 0 0 0 2 0 0 0 0
Mesotheristus 2 1B 0 0 0 1 0 0 0 0
Metachromadora 3 2A 10 10 0 0 2 0 0 0
Metacyatholaimus 3 2A 7 0 0 1 0 0 0 0
Metalinhomoeus 2 1B 5 4 16 35 0 0 0 5
Microlaimus 2 2A 23 2 58 1 1 7 2 0
Monhystera 2 1B 10 19 42 56 0 0 0 0
Mononchus 4 1A 0 0 0 0 0 0 0 4
Nannolaimoides 3 2A 47 0 0 8 0 0 0 0
Neochromadora 3 2A 3 2 110 0 3 13 5 3
Oncholaimellus 3 2B 0 0 0 0 12 10 0 0
Oncholaimus 3 2B 0 0 0 1 0 0 7 7
T. K. GYEDU-ABABIO 480
Paracomesoma 3 2A 18 0 15 39 0 0 0 0
Paracyatholaimus 2 2A 44 0 2 7 0 1 0 1
Paramonohystera 2 1B 407 0 32 0 0 0 0 0
Parodontophora 4 2B 1 0 136 2 4 35 20 6
Perrickia 4 2A 6 0 0 0 0 0 0 2
Polygastrophora 4 2B 2 0 10 0 0 0 0 0
Pomponema 3 2B 30 0 0 0 0 3 25 2
Praeacanthonchus 3 2A 10 0 0 0 0 41 2 0
Pseudochromadora 3 2A 2 2 8 0 4 7 3 1
Rhabditis 1 1A 0 5 0 323 0 0 0 0
Rhynconema 3 2B 4 0 0 0 0 0 0 0
Sabatieria 2 1B 8 0 0 0 4 0 0 0
Scaptrella 2 2B 33 0 0 0 0 0 0 0
Synodontium 2 1B 0 0 0 0 0 0 1 0
Synonchium 3 2B 0 0 0 11 4 5 0 5
Terschellingia 3 1B 0 0 0 117 0 15 1 3
Theristus 2 1B 0 673 2 8 8 19 4 1
Tripyloides 2 1B 0 0 0 0 0 0 0 8
Viscosia 3 2B 76 2 77 0 472 100 231 31
Xyala 3 1B 10 0 0 0 18 4 0 0
*c-p = coloniser-persister.
genera in the Gamtoos River estuary appeared to be more uniform. The highest mean number of genera, 8, was recorded in the middles reaches of the Gamtoos River estuary, at sites GB and GC.
5.5. Nematode Trophic Diversity
All four feeding types (1A, 1B, 2A and 2B - Wieser’s classification based on mouthparts) were represented in the two estuaries during the period of study. The per-centage composition of the four feeding types varied from site to site in the Swartkops River estuary (Figure 3). Non-selective deposit feeders, (Type 1B) contributed a large percentage of the nematode composition in May, 50%; July, 67% and September, 66% respectively. Epi-growth feeders (Type 2A) contributed a higher percent-age composition than the Type 1B in November 1997, January 1998 and March 1998 but the differences were only 9%, 9% and 5% respectively. Type 1B was there-fore the dominant feeding type in the Swartkops.
In the Gamtoos River estuary, Type 1B was the domi-nant feeding type during four non-consecutive months. Type 1B contributed 57%, 56.8%, 54.2% and 43.8% of the nematode composition for the months of July 1997, September 1997, November 1997 and March 1998,
re-spectively. In May 1997 Type 2A was the dominant feeding type comprising 53.1% of the nematode compo-sition whilst the predators and omnivores (Type 2B) were the dominant feeding type in January 1998 in the Gamtoos estuary, with a composition of 46.4%. Spatially, Type 1B was dominant in the Gamtoos as well (Figure 3). Feeding Type 1B was therefore the dominant feeding group in both estuaries, but with different degrees of dominance: Swartkops River estuary - 52% and the Gamtoos River estuary - 41%. The mean percentage composition of the nematode feeding types indicates that Type 2A had the second highest composition in the Swartkops River estuary comprising 27% of the total. Type 2B was the second most abundant in the Gamtoos River estuary with composition of 32%. Selective de-posit feeders (Type 1A) had the lowest representation in both the Swartkops and Gamtoos River estuaries, with a composition of 10% and 2%, respectively.
5.6. Nematode Attributes in Relation to Environmental Factors
T. K. GYEDU-ABABIO 481
Figure 3. Graphical summary of spatial distribution of nematode feeding types in the Swartkops and Gamtoos River estuar-ies (May 1997-March 1998) SD—standard deviation.
Table 8. Results of Spearman’s weighted correlation be-tween nematode feeding types and environmental factors (May 1997-March 1998).
Environmental factor r
Zn 0.449
Pb 0.581
VCS 0.586
Organic carbon 0.659
Bacteria 0.757
the score of the weighted Spearman’s correlation be-tween the nematode feeding types and the environmental factors.
The metals Zn and Pb, organic carbon and bacterial numbers correlated with the nematode trophic structure (P < 0.05). All the other factors listed in Table 8 had influence on the structuring of the nematode community (the insignificant variables were not listed in Table 8).
A total of fifty-six genera were recorded in this study, from the two river estuaries. Many of the genera oc-curred in both estuaries, but several genera were found exclusively in either the Swartkops or the Gamtoos River
estuary. Genera such as Aegialoalaimus, Cobbia, Come-soma, Dorylaimopsis, Haliplectus, Longicyatholaimus, Marylynnia, Metacyatholaimus, Monhystera, Nannolai-moides, Paracomesoma, Paramonohystera, Rhynconema, Rhabditis, Scaptrella, Mesodorylaimus and Mesotheris-tus occurred only in the Swartkops River. There were seven genera recorded in the Gamtoos River estuary but not in the Swartkops, namely Aponema, Ethmolaimus, Euchromadora, Gammarinema, Oncholaimellus, Tripy-loides and Mononchus. Figure 4 depicts the similarities and differences in nematode communities the two river estuaries between sites.
[image:9.595.57.287.467.563.2]482 T. K. GYEDU-ABABIO
Figure 4. Non-metric MDS ordination of square-root trans-formed nematode taxa abundance data at study sites in the Swartkops and Gamtoos River estuaries (May 1997-March 1998).
tode community. Paradontophora, Neochromadora and Viscosia were co-dominant at site J, sharing 46.2% of the nematode community between them. Theristus was the dominant genus at site CRM, making up 93.5% of the total numbers of the nematode community structure. Rhabditis was the most dominant (37.1%) genus at site KC, followed by Haliplectus (14.1%) and Terschellingia (13.4%).
The nematode community structure in the Gamtoos River estuary was different. Viscosia was dominant in the nematode communities at all the sites in the Gamtoos. Viscosia constituted 59.5%, 30.3%, 35.9% and 18.8% of total numbers at sites GA, GB, GC and GD, respectively. By contrast, Viscosia was not abundant along the sites in the Swartkops River estuary. A Canonical Correspon-dence Analysis (CCA) was performed to investigate the possible causes of this distribution pattern. The results of the analysis displayed in Figure 5 indicate that the ne-matode community structure found at sites J, L, GA, GB, GC and GD might have been caused by sediment char-acteristics. A greater number of the nematode communi-ties was associated with the fine sand (FS) sediment component at these sites (Figure 6) and hence the ag-gregation of these sites as indicated in Figure 5.
The ability of nematode species to survive under harsh environmental conditions, e.g., metal or organic pollution has been documented [23]. According to these authors, c-p values have been assigned to various nematode genera
Figure 5. Comparison of study sites based on the nematode communities and environmental factors responsible for the structuring of these communities in the Swartkops and Gamtoos River estuaries (May 1997-March 1998) (FS—Fine sand, Cu—Copper, Fe—Iron, Zn—Zinc, Mn—Manganese, Sn—Tin, Pb—Lead, OrgC—Orgnic carbon).
based on their response and survival capabilities in times of stress or disturbance. Table 9 gives the MI calculated as the weighted average of c-p values, for the nematodes at various sites in the two river estuaries. Sites that had higher metal and or organic concentrations (e.g. CRM and KC) have nematode communities with lower MI values.
6. Discussion
Site KC had higher concentrations of Cu, Fe and Mn in this study as compared to the other sites in the Swartkops River estuary. Although Zn is not particularly considered toxic to marine organisms [26], this study found it to have influenced the structuring of the nematode commu-nities in the two estuaries. A similar observation was made [3] that nematode community structure appears to change in an ordered fashion with increasing metal con-centration through time. There is a historic record of heavy metal concentrations in the Swartkops River estu-ary [15,27] and Gamtoos River estuestu-ary [28]. Sites CRM and KC were identified as sites with higher metal and organic carbon concentrations [15]. Table 3 gives the concentrations of the seven heavy metals analysed in the two estuaries during this study.
Several authors [29,31,32] have observed that certain nematode species including, Rhabditis and Monhystera are tolerant to hypoxic and anoxic conditions. These two
[image:10.595.58.288.86.329.2]T. K. GYEDU-ABABIO 483
Figure 6. Nematode communities’ structure in the Swartkops and Gamtoos River estuaries based on prevailing environmental conditions (May 1997-March 1998).
Table 9. Maturity Index (MI) values at study sites in the Swartkops and Gamtoos River estuaries (May 1997 to March 1998).
SWARTKOPS GAMTOOS Month
L CRM J KC GA GB GC GD
May ‘97 2.38 2.00 2.17 2.73 1.85 2.33 1.52 2.03
July’97 2.26 1.99 2.24 1.25 2.81 2.62 2.00 2.08
Sep ‘97 2.25 2.00 2.20 1.39 2.70 2.26 2.69 2.14
Nov ‘97 2.24 1.98 2.9 1.36 2.68 2.24 2.60 2.9
Jan ‘98 2.47 2.9 2.67 2.86 2.85 2.74 2.82 2.67
Mar ‘98 2.49 2.12 2.57 2.88 2.63 2.72 2.66 2.42
Mean 2.35 2.03 2.33 2.13 2.67 2.52 2.43 2.26
site KC which has high metal concentrations. As indi-cated earlier, there were seven nematode genera identi-fied in the Gamtoos but not found in the Swartkops River estuary. Apart from Tripyloides and Mononchus, the
[image:11.595.56.539.523.660.2]484 T. K. GYEDU-ABABIO
River estuary.
It has been indicated that the nematode community in the Swartkops River estuary varies in composition and species abundance at specific sampling sites as a result of prevailing and variable environmental conditions along the river estuary [15]. The present study has confirmed the above observation that meiofauna density and diver-sity varied with respect to environmental factors such as metal concentrations in the Swartkops River estuary. The metals zinc (Zn), iron (Fe) and manganese (Mn) were negatively correlated with the density of nematodes in the Swartkops and Gamtoos River estuaries. A similar observation as to the correlation of nematode density with Zn, Pb, Mn and Fe [33].
One possible explanation of the results in Table 9 is that nematode genera found at sites CRM and KC might be opportunists as compared to the other sites, especially, those in the Gamtoos River estuary. The exposure of sites CRM and KC to anthropogenic activities, such as, industry, extensive agriculture and increased deposition of organic matter from the settlements along the river estuary, might also account for these species ability to “colonise” these two sites. These mentioned activities have increased the concentrations of metals and organic carbon in the Swartkops River Estuary over time. The MI values confirm the Non-metric multidimensional scaling (NMMDS) plots in Figures 5 and 6, in that, the sites with low MI are considered to be under stress from metal and organic pollution. The nematode genera asso-ciated with site KC include Monhystera, Metalinho-moeus, Rhabditis, Diplolaimella, Mesotheristus and Ter-schellingia. Since the metal concentrations and organic carbon concentrations were higher at this site, the genera present at this site may be tolerant to the two types of pollution. Theristus is found in organic polluted sites. It was the only genus that dominated the site CRM which is also considered as polluted (higher concentrations of Pb, Sn and organic carbon). It is therefore difficult to pin-point which of the two, metal or organic carbon pol-lution, is solely responsible for the dominance of Mon-hystera, Metalinhomoeus, Rhabditis, Diplolaimella, Me-sotheristus and Terschellingia at KC or Theristus at site CRM. The differences in the composition of benthic meiofauna communities in the two river estuaries might therefore largely depend on the synergistic effects of prevailing environmental factors. The dominant nema-tode feeding type 1B was present at the sites considered to be stressed. This feeding type 1B may adapt to stressed conditions better than the other feeding types. Apart from the fine sand (FS) component of the sediment (see Figures 5 and 6), no other environmental factors were found to have significantly influenced the structur-ing of the followstructur-ing genera; Paramonohystera,
Euchro-madora, Aponema, Viscosia, Oncholaimellus, On-cholaimus, Nannolaimus, Perrickia, Praeacanthonchus, Elzalia, Polygastrophora, Cobbia, Longicyatholaimus, Scaptrella, Axonolaimus, Adoncholaimus, Dorylaimopsis, Comesoma, Rhynchonema, Xyala, Neochromadora, Ethmolaimus, Daptonema, Chromadorella.
7. Conclusion
This study has revealed that it is difficult to differentiate between the quantitative effects of individual metals (e.g. Cu, Zn, Fe, Pb), on the structure of nematode communi-ties. Concentrations of the metals (Cu, Zn, Fe, Pb), or-ganic carbon and chlorophyll-a are higher in the sedi-ments of the Swartkops River estuary. The sites with higher concentration of metals and organic carbon had a distinct nematode structure (e.g. site CRM with Theristus as the only genus). It is unclear if the nematode genera identified at sites CRM and KC preferred the organic carbon or the metals associated with these sites. None of the organic carbon or the individual metals can be sin-gled out as the actual cause for the structuring of the ne-matode communities, as concentrations of organic car-bon and the identified metals were high at these two sites. This contrasts with the observations made [34,35], who showed the effects of different metals on the structure of meiobenthic communities, could be differentiated from one another. A laboratory experiment on the meiofauna (nematodes) [16] confirmed that there is no unique way of response to specific metal contaminants by nematodes. It has been observed that responses of nematodes to lead and zinc contaminations were varied [9].
T. K. GYEDU-ABABIO 485
8. Acknowledgements
I am grateful to the Zoology Department of the Univer-sity of Port Elizabeth and Rand Water Analytical Ser-vices (both in South Africa), for the use of their labora-tory facilities during the study period. I also thank Dan Baird (South Africa) and Tom Bongers (Dept. of Nema-tology, University of Wagahegen, Netherlands) for their inputs, Ann Vanreusel (Ghent, Belgium) and Aldo Zulini (Italy) for their help during the identification of some of the nematode species.
9. References
[1] P. Morant and N. Quinn, “Influence of Man and Man-agement of South African Estuaries,” In: B. R. Allanson and D. Baird, Eds., Estuaries of South Africa, Cambridge University Press, Cambridge, 1999, pp. 289-320.
[2] A. Grant, J. G. Hateley and N. V. Jones, “Mapping the Ecological Impact of Heavy Metals on the Estuarine Polychaete Nereis Diversicolor Using Inherited Metal Tolerance,” Marine Pollution Bulletin, Vol. 20, No. 5, 1989, pp. 235-238. doi:10.1016/0025-326X(89)90438-4
[3] P. J. Sommerfield, M. J. Gee and R. M. Warwick, “Ben-thic Community Structure in Relation to an Instantaneous Discharge of Waste Water from a Tin Mine,” Marine
Pollution Bulletin, Vol. 28, No. 6, 1994, pp. 363-369.
doi:10.1016/0025-326X(94)90273-9
[4] S. Gascón, D. Boix, J. Sala and X. D. Quintana, “Ne-matode Assemblages and Their Responses to Distur-bances: A Case Study from the Empordà Wetlands (Nor-theastern Iberian Peninsula),” Journal of the North Ame-
rican Benthological Society, Vol. 25, No. 3, 2006, pp.
643-655.
doi:10.1899/0887-3593(2006)25[643:NAATRT]2.0.CO;2
[5] E. Abebe, I. Andrássy and W. Traunspurger, “Fresh Wa-ter Nematodes—Taxonomy and Assemblages,” Google Books.co.za., 2006.
[6] N. Smol, K. A. Willems, J. C. R. Govaere and A. J. J. Sandee, “Composition, Distribution, Biomass of Meio- benthos in the Oosterschelde Estuary (SW Netherlands),”
Hydrobiologia, Vol. 282-283, No. 1, 1994, pp. 197-217.
doi:10.1007/BF00024631
[7] F. Boufahja, A. Hedfi, J. Amorri, P. Aïssa, H. Beyrem and E. Mahmoudi, “An Assessment of the Impact of Chromium-Amended Sediment on a Marine Nematode Assemblage Using Microcosm Bioassays,” Biological
Trace Element Research, Vol. 142, No. 2, 2010, pp.
242-255.
[8] H. Beyrem, E. Mahmoudi, N. Essid, A. Hedfi, F. Bou-fahja and P. Aissa, “Individual and Combined Effects of Cadmium and Diesel on a Nematode Community in a Laboratory Microcosm Experiment,” Ecotoxicology and
Environmental Safety, Vol. 68, No. 3, 2007, pp. 412-418.
doi:10.1016/j.ecoenv.2006.12.007
[9] E. Mahmoudi, N. Essid, H. Beyrem, A. Hedfi, F.
Bou-fahja, P. Aissa and P. Vitiello, “Mussel-Farming Effects on Mediterranean Benthic Nematode Communities,”
Nematology, Vol. 10, No. 3, 2008, pp. 323-333.
doi:10.1163/156854108783900285
[10] N. R. Millward and A. Grant, “Assessing the Impact of Copper on Nematode Communities from a Chronically Metal-Enriched Estuary Using Pollution-Induced Com-munity Tolerance,” Marine Pollution Bulletin, Vol. 30, No. 11, 1995, pp. 701-706.
doi:10.1016/0025-326X(95)00053-P
[11] A. McLachlan, “Studies on the Psammolittoral Meio-fauna of Algoa Bay. South Africa. II. The Distribution, Composition and Biomass of the Meiofauna and Macro-fauna,” Zoology African, Vol. 12, 1977, pp. 33-60. [12] L. E. McGwynne, A. McLachlan and J. P. Furstenberg,
“Wrack Breakdown on Sandy Beaches: Its Impact on In-terstitial Meiofauna,” Marine Environmental Research, Vol. 25, No. 3, 1988, pp. 213-232.
doi:10.1016/0141-1136(88)90004-9
[13] J. P. Furstenberg and M. Vincx, “The New Chro-madoropsis Species. (Nematoda, Desmoridae) from Southern Africa and the North Sea,” South African
Jour-nal of Zoology, Vol. 23, No. 3, 1988, pp. 215-223.
[14] J. P. Furstenberg and M. Vincx, “Two New Species of the Family Microlaimidae (Nematoda: Order Chro-madorida) from South Africa,” Cahiers de Biologie Ma-rine, Vol. 33, 1992, pp. 245-251.
[15] T. K. Gyedu-Ababio, J. P. Furstenberg, D. Baird and A. Vanreusel, “Nematodes as Indicators of Pollution: A Case Study from the Swartkops River Estuary, South Af-rica,” Hydrobiologia, Vol. 397, 1999, pp. 155-169.
doi:10.1023/A:1003617825985
[16] T. K. Gyedu-Ababio and D. Baird, “Response of Meio-fauna & Nematodes to Increased Levels of Contamina-tion in a Laboratory Experiment,” Ecotoxicology and
En-vironmental Safety, Vol. 63, No. 3, 2006, pp.443-450.
doi:10.1016/j.ecoenv.2005.01.010
[17] C. Heip, M. Vincx and G. Vranken, “The Ecology of Marine Nematodes,” Oceanogr. Mar. Biol. Ann. Rev, Vol. 23, 1985, pp. 399-489.
[18] R. T. Lackey and B. E. May, “Use of Sugar Flotation and Dye to Sort Benthic Samples from Marine and Limnic Sediments,” Netherlands Journal of Sea Research, Vol. 7, 1971, pp. 233-243
[19] H. M. Platt and R. M. Warwick, “Free Living Marine Nematodes, Part II: British Chromadorids,” Cambridge University Press, Cambridge, 1988.
[20] R. Mantoura and C. Llewellyn, “The Rapid Determina-tion of Algal Chlorophyll and Carotenoid Pigments and Their Breakdown Products in Natural Waters by Re-verse-Phase High-Liquid Chromotography,” Analytica
Chimica Acta, Vol. 151, 1983, pp. 297-314.
doi:10.1016/S0003-2670(00)80092-6
[21] S. Parker, “Determination of Soil Organic Content,” In: R. E. Carver, Ed., Procedures in Sediment Petrology, John Willey & Sons, New York, 1983, pp. 389-401.
Envi-T. K. GYEDU-ABABIO 486
ronmental Research. Non-Metric Multidimensional Scal-ing,” 1957.
[23] T. Bongers, R. Alkemade and G. W. Yeates, “Interpreta-tion of Disturbance-Induced Maturity Decrease in Marine Nematode Assemblages by Means of the Maturity In-dex,” Marine Ecology Progress Series, Vol. 76, 1991, pp. 135-142. doi:10.3354/meps076135
[24] J. Mees and O. Hamerlyncl, “Introduction to Descriptive Multivariate Statistics,” Tutorial Handout, Marine Biol-ogy Section of the University of Gent, 1996, p. 18. [25] C. J. F. Ter Braak, “CANOCO-FORTRAN Program for
Canonical Community Ordination by (Partial) Detrended (Canonical) Correspondence Analysis and Redundancy Analysis,” TNO Institute of Applied Computer Science, Statistical Department, Wageningen, 1987.
[26] G. W. Bryan and W. J. Langston, “Bioavailability, Ac-cumulation and Effects of Heavy Metals in Sediments with Special Reference to UK Estuaries: A Review,”
En-vironmental Pollution, Vol. 76, No. 2, 1999, pp. 89-131.
doi:10.1016/0269-7491(92)90099-V
[27] R. J. Watling and H. R. Watling, “Metal Surveys in South African Estuaries. II. Gamtoos River. Report II. Zoology Department,” University of Port Elizabeth, Port Elizabeth, 1982.
[28] R. J. Watling and H. R. Watling, “Metal Surveys in South African Estuaries. I. Swartkops River,” Water SA, Vol. 8, 1988, pp. 26-35.
[29] T. M. Fenchel and R. J. Riedel, “The Sulphide System: A New Biotic Community underneath the Oxidised Layer of Marine Sand Bottoms,” Marine Biology, Vol. 7, No. 3,
1970, pp. 255-268. doi:10.1007/BF00367496
[30] J. A. Ott, “Determination of Fauna Boundaries of Nema-todes in an Intertidal Sand Flat,” Internationale Revue der
gesamten Hydrobiologie und Hydrographie, Vol. 57, No.
4, 1972, pp. 645-663. doi:10.1002/iroh.19720570413
[31] J. A. Ott and F. Schiemer, “Respiration and Anaerobiosis of Free Living Nematodes,” Oecologia, Vol. 2, 1973, pp. 251-291.
[32] J. A. Ott and R. Novak, “Living at an Interface: Meio-fauna at the Oxygen/Sulfide Boundary of Marine Sedi-ments,” In: J. S. Ryland and P. A. Tyler, Eds.,
Reproduc-tion, Genetics and Distribution of Marine Organisms,
Olsen & Olsen, Fredensborg, 1989, pp. 415-422.
[33] N. Smol, K. A. Willems, J. C. R. Govaere and A. J. J. Sandee, “Composition, Distribution, Biomass of Meio-benthos in the Oosterschelde Estuary (SW Netherlands),”
Hydrobiologia, Vol. 282-283, No. 1, 1994, pp. 197-217.
doi:10.1007/BF00024631
[34] M. C. Austen, A. J. McEvoy and R. M. Warwick, “The Specificity of Meiobenthic Community Response to Dif-ferent Pollutants: Results from Microcosm Experiments,”
Marine Pollution Bulletin, Vol. 28, No. 9, 1994, pp. 557-
563. doi:10.1016/0025-326X(94)90075-2
[35] M.C. Austen and P.J. Sommerfield, “A community level sediment bioassay applied to an estuarine heavy metal gradient,” Marine Environmental Research, Vol. 43, No. 4, 1997, pp. 315-328.