RESEARCH ARTICLE
Comparative Analysis of Different Dna Extraction Protocols and Genetic Diversity Studies in a
Medicinal Plant Cassia obtusa (Roxb.) Wight & Arn. of Eastern Ghats, Tamil Nadu
* 1
Amzad Basha Kolar,
2Silambarasan, G.,
3Ghouse Basha, M., and
4Sabiha Sultana, M.
1Department of Molecular Biology, Bangalore University, Bangalore-560 056, India 2Faculty of Marine Sciences, Annamalai University, Parangipettai, Tamil Nadu, India 3Department of Botany, Jamal Mohamed College, Tiruchirappalli-620 020, India
4Department of Botany, Al-Ameen College, Bangalore-560 027, India
ARTICLE INFO ABSTRACT
Cassia obtusa is locally known as “Nilaavakai”. It is an herbaceous plant belongs to family
Leguminosae and Sub family Caesalpinioideae. The plant was collected from 5 different places through recurrent survey. Three DNA extraction protocols were compared for their ability to produce good quality DNA from the frozen leaves of Cassia obtusa. RAPD-PCR analysis involving 10 decamer random primers were used to assess the quantum of genetic variation at genomic level. Out of the ten primers, OPA 13 showed amplification among all the 5 accessions and OPA7 and OPA9 were specific to COB4. OPA12 was specific to COB1 and COB2. By OPA13 morphological identity and great deal of polymorphism was observed among the accessions. Despite of morphological identity, a great deal of genetic variations was observed among the accessions. UPGMA analysis showed ~44% variation in the collections, the results demonstrated the ability of RAPD markers to reliably differentiate between the ecotypes.
Copy Right, IJCR, 2012, Academic Journals. All rights reserved.
INTRODUCTION
The Eastern Ghats are considered as a hub of biodiversity. Biological diversity in this territory is immense. The genus
Cassia comprises over 600 species namely trees, shrubs and
herbs and mostly occurring in the tropics and sub tropics. It is the fourth largest genus in the family, the largest in sub family (Caesalpinioideae) and among the 25 largest genera of dicotyledonous plants (Willis, 1973). This genus is having high economic as well as medicinal values (Mondal and Mandal, 1997). Cassia obtusa is an herbaceous with spreading to ascending branches, to subshrubby. It grows in the plains to 400m, in bare ground or fallow fields. It is an important medicinl plant found mostly in Africa through south west Asia to India. The plant has a distinguishable feature from other species in the genus by its uniquely short-stipitate, lunate, flat, compressed pod, which is about 2.5-5.0×1.5-3.0 cm (Mathew, 1983). The plant is having tremendous medicinal properties. The leaves are useful in stomach disorders, intestinal worms, scabies and pruities. The powdered leaves are mixed in hot water and taken for throat pain. They are also used as cattle feed (Thirugnanam, 2007). There is no earlier report on
Cassia obtusa. Genomic DNA of high purity and quantity is
needed to analyse genetic diversity with RAPD markers. The objective of the present study was to test three different procedures for DNA extraction and to standardize a protocol
*Corresponding author: [email protected]
for high quality DNA for RAPD in Cassia obtusa. Five accessions of the Cassia obtusa were collected from different areas of Eastern Ghats of Tamil Nadu to study the genetic diversity among the species by using RAPD markers.
MATERIALS AND METHODS
Plant: The experimental plant was collected from different regions of Eastern Ghats, Tamil Nadu, and stored in frozen condition till the use for the present study (Table-1) & (Fig.1).
DNA Extraction
The extraction of DNA from 30 days frozen leaves was used for the study. Three methods were used for extraction, namely Modified CTAB method (Murray and Thompson, 1980), CTAB method with minor modifications (Doyle and Doyle,
1987), and Phenol-Chloroform method with minor
modifications (Bell et al., 1981) were employed to check the efficacy of each method.
Modified CTAB method (Murray and Thompson, 1980)
DNA was extracted by using the modified CTAB method (Murray and Thompson, 1980. 1g of leaf was ground well and 5ml of 2X CTAB extraction buffer containing 2% (w/v) CTAB, 100mM Tris-HCl, pH 8.0; 20mM EDTA, 1.4M NaCl,
1% (w/v) polyvinylpyrrolidone and 10mM β-mercaptoethanol
were added to it. After incubation at 60°C for 20 mins, an
ISSN: 0975-833X
International Journal of Current Research Vol. 4, Issue, 12, pp.175-179, December,2012
INTERNATIONAL JOURNAL OF CURRENT RESEARCH
Article History:
Received 22th September, 2012
Received in revised form
23th October, 2012
Accepted 29th November, 2012
Published online 18th December, 2012
xxxxxxxxxxxxxxx
equal volume of chloroform was added, mixed thoroughly and centrifuged at 8,000g for 10 mins at 25°C. An equal volume of CTAB precipitation buffer (1% CTAB, 50mM Tris-HCl, pH 8.0, 10mM EDTA) and sterile water were added to the supernatant and centrifuged at 8,000g for 10 mins at 25°C. After dissolving the pellet in 1ml of high salt TE (1 M NaCl, 10mM Tris-HCl, pH 8.0, 1mM EDTA), 0.6 volumes of ice-cold isopropanol was added to precipitate the DNA at -20°C, overnight. After centrifuging on the next day, The DNA pellet was washed with 70% ethanol and stored in 1X TE buffer (10mM Tris buffer, 10mM EDTA; pH 8.0).
CTAB method with minor modifications (Doyle and Doyle, 1987)
The DNA of C.obtusa was extracted following the modified CTAB method (Doyle and Doyle, 1987). 1g of leaf was weighed and homogenized with 10ml CTAB extraction buffer. After incubation in a water bath at 65°C for one hour with intermittent shaking, the contents were brought to room temperature and 5ml of chloroform: isoamylalcohol (24:1) was added. The mixture was centrifuged at 8,000 rpm for 20 mins at 4°C and this procedure was continued until a clear supernatant was obtained. After the final spin, the supernatant was taken to a separate tube and an equal volume of ice-cold isopropanol was added and kept at 4°C. On the next day, the sample was centrifuged at 5,000 rpm for 10 mins. The DNA pellet was washed with 2-3 drops of 70% ethanol, air-dried and dissolved in TE buffer. After this, it was incubated for 2-3 hours at 4°C. An equal volume of phenol: chloroform: isoamylalcohol was added and centrifuged at 14,000 rpm for 2 mins. The top aqueous DNA layer precipitated by adding two volumes of ice-cold ethanol and kept at -20°C overnight. It was spun at 9,000 rpm for 20 minutes to pellet the DNA on the next day. The pellet was washed with 70% ethanol, dried in a vacuum drier for ½ hour after which it was dissolved in 300µl TE buffer. To the dissolved pellet, 1/10 volume of 3M Sodium acetate was added and left overnight. The supernatant was collected after 24 hours by spinning at 9,000 rpm for 20 mins.
Phenol Chloroform method (Bell et al., 1981)
2 g of leaf was weighed, homogenized with 5ml of homogenization buffer (50mM Tris buffer, 50mM Glucose, 10mM EDTA; pH 8.0) and ground well in an ice-cold mortar and pestle for 15 mins. 15ml of lysis buffer (50mM Tris HCl, 10mM EDTA, 250mM NaCl, 2%SDS; pH 8.0) was added to it and homogenised well for 5 mins. After incubation at 65°C for 30 mins, the sample was centrifuged at 8,000 rpm at 4°C for 10 mins. 500µl of the supernatant was transferred to a new tube and an equal volume of Phenol: Chloroform: Isoamylalcohol (25:24:1) mixture was added and mixed well by inversion. Then it was centrifuged at 12,000rpm for 10 mins at 4°C. This process was repeated till the supernatant got colourless. The upper aqueous layer was transferred to new tubes and double volume of ice-cold 70% ethanol was added to it, followed by incubation at -20°C for 20 mins. It was then centrifuged at 12,000 rpm for 10mins. The supernatant was discarded, pellet dissolved in 50µl of TE buffer and stored at 4°C for further use.
Quantification of DNA
The DNA was quantified by nano-drop spectrophotometer (Thermofisher Scientific) using the software ND-1000 Ver.3.6. The quantity of DNA samples were checked by determining the ratio of absorbance at A260/280, the ratio obtained varied from 1.8 to 2.0, which suggests that our DNA samples were fairly of good quality and electrophorised on 0.8% agarose gel.
RAPD analysis
The PCR reaction was carried out in a thermal cycler (Corbett Research, Model No. CG1-96, Australia). 10 primers were procured from OPERON technologies, (Alameda, CA, USA), viz. from OPA 4,5,6,7,8,9,10,11,12 and OPA 13. The PCR amplification mixture consisted of 10x assay buffer (2.5µl), 25mM MgCl2 (1.0 µl), 10mM of each dNTP (1.5 µl), 3 unit
Taq polymerase (Chromous Biotech. Pvt. Ltd., Bangalore), 1.0 µl random primers (250ng/ µl) and 1 µl of template DNA (200ng/ µl). The volume was made upto 25µl with DEPC water. The solution was mixed gently and amplification was carried out for 45cycles. After the initial heat denaturation of the DNA at 94°C for 5 mins, the thermal cycling was done with the following temperature regimes: 94°C for 1min, 32°C (Table 3) for 90 sec. The initial extension step was carried out at 72°C for 90 sec followed by a final extension step at 72°C for 5 min and storage at 4°C for 1min(infinite time) for the completion of the programme. The products were separated on a 1.5% agarose (Sigma-Aldrich, St.Louis, USA, Cat. No. A0169) gel in 1 %TAE buffer (40 mM Tris acetate, 1mM EDTA; pH 8.2). The gel was visualized using ethidium bromide stain and photographed in a gel documentation system (Alpha Innotech). Raw gel images were recorded through Molecular Analyst Software (AlphaEase Fc,Version 6.0).
Diversity Analysis
The RAPD bands were scored as discrete variables using 1 to indicate presence and 0 to indicate absence of a band. Similarity index (SI) between analysed materials was calculated using the formula developed by Dice (Nei and Li, 1979) : F=2NXY/(NX+NY) where NXY is the number of bands
shared by two compared accessions X and Y, NX and NY are
the total number of bands observed in accessions X and Y respectively. Pairing Affinity (PA%) was calculated by the formula: No.of common bands in both X and Y accessions/ Total number of bands in X and Y ×100. Based on the matrix of genetic similarity, cluster analysis was performed. The UPGMA method was used for clustering with STATISTICA for windows version 5.0 programme (Uma Shaanker and Ganeshaiah, 1997).
RESULTS
DNA extraction
Medicinal plants have large amount of secondary metabolites. These secondary metabolites make hindrance in DNA isolation and DNA so isolated, is not suitable for PCR amplification. We followed the protocols described by Murray
and Thompson (1980), Doyle and Doyle (1987) and Bell
frozen leaves of Cassia obtusa. Murray and Thompson method and CTAB method by Doyle and Doyle (1987) yielded low amount of DNA and poor PCR amplification. The Phenol Chloroform method with minor modifications helped in the extraction of DNA high purity and high quantity (Fig.2). The DNA yield ranged from 119.2ng/µl to 257ng/µl of frozen leaves using the modified phenol chloroform method. (Table-2).
RAPD analysis
PCR reaction was performed according to the protocol by Williams et al., (1990). Ten operon primers were used for amplification. OPA 13 showed clear bands (Fig.3). All accessions were identified by the presence of bands. The other nine primers showed no clear and scorable bands. The amplification was more in the COB4 accession with primer OPA4 (CCGCCCAAAC) and OPA9 (CCCTACCGAC) along with the genomic DNA. Same like a single band was amplified for COB1 and COB2 accessions with primer OPA12 (TCGGCGATAG). These primers are treated as specific primers (Table-3).
Diversity analysis
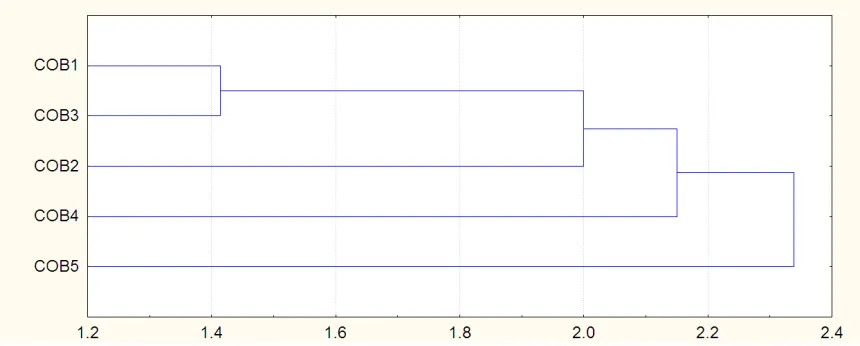
The dendrogram (Fig. 4) demonstrates the ability of RAPD markers to reliably differentiate between the accessions of
Cassia obtusa since their phenotypic differences are not clear.
The five accessions analysed are clustered mainly in two groups. Cluster I contains COB5 and cluster II contains the accessions COB1, COB2, COB3 and COB4. The dendrogram based on SI (Table-4) showed distinct separation of collected accessions, though morphologically, they were similar and inseparable. The dendrogram separated the accessions collected from 5 different locations in two groups. The accessions COB1 and COB2 had maximum similarity of 60% and COB3 and COB5 shared the least similarity of 18.18% (Table-5). The results indicate that the accessions COB1 and COB3 are closely related and share a similar genetic make-up. While COB5 is having a distinct characteristics comparing with other 4 accessions.
DISCUSSION
The modified CTAB method of Murray and Thompson (1980) had several advantages over other protocols. The main difference this protocol and CTAB method (Doyle and Doyle, 1987) is the use of CTAB precipitation buffer in this method, which facilitates the precipitation of DNA. The protocol also utilizes the high concentration of NaCl which increases the solubility of polysaccharides in ethanol, effectively decreasing co-precipitation of polysaccharides and the DNA. The process is also less time consuming due to the simplicity of the steps involved. But the protocol demonstrated very poor results for DNA isolation in C.obtusa. The CTAB method with minor modifications did not exhibit satisfactory results for Cassia
obtusa may be due to the modifications introduced in the
protocol. The basic difference between the CTAB method (Doyle and Doyle, 1987) and this protocol was the concentrations of specific components. However, it did not yield sufficient DNA for PCR amplification. In comparison of the three protocols for DNA isolation used in the study, phenol-chloroform method described by Bell et al., (1981)
produced the best DNA quality from the leaves of C.obtusa,
even though the protocol was labour-intensive as more quantities of solutions were required and also time consuming. It was observed that the method yielded adequately pure DNA sufficient for PCR amplification.
The efficacy of RAPD markers for diversity analysis has not been reported by anyone and the present study will be the first report in Cassia obtusa although there are many early work reported in Cassia genus. Kumar et al., (2007) have used young and healthy leaves of Senna surattensis Burm. f and
Senna sulfurea Dc.ex. Collad, accessions for RAPD analysis
which was carried out to assess the authentic identification as well as to solve the taxonomic problems between the two plants. The results demonstrate the ability of RAPD markers to reliably differentiate between S.surattensis and S.sulfurea.
We observed a high level genetic diversity within the accessions of Cassia obtusa. The genetic diversity studies demonstrated that accessions collected from Pachamalai (COB1) and Pulivalam (COB3) which are localized close to each other show a higher genetic similarity. It was also observed that these two accessions show a maximum genetic similarity with Perumalmalai (COB2). The Perambalur (COB4) and Karaikudi (COB5) accessions were found to share a common group and also different from other three accessions, as the two populations are found to be growing on plateau land.
A possible explanation of this phenomenon might be that the plant growing in the base of the hills are geographically similar and have ecologically undisturbed conditions while the plants growing in the plateau land are distinct and disturbed by anthrapogenic interferences. Our results are supported by the findings of Paisooksantivatana et al.,(2001) who reported a considerable genetic difference between high land and low land populations and a high level genetic similarity among hilly populations in Curcuma alismatifolia. Islam et al., (2005) reported that RAPD based estimations of genetic diversity revealed that hilly populations maintain higher genetic diversity which was also found to be distinct from plain land and plateau land populations. Asit. B. Mandal et al., (2007) used RAPD markers to assess the quantum of genetic variations at genetic level in Costus speciosus Koen ex. Retz., an important medicinal plant of Andaman and Nicobar Islands in which four primers showed appreciable intra-species variation or molecular polymorphism at amplicon levels.
The RAPD markers used in the present study displayed
appreciable intra-population variation or molecular
polymorphism, which pre-existed in different collections.
Inspite of their morphological identity, substantial
polymorphism was observed among the accessions taken for the study. The results revealed that though the decamer primers are small in comparision to the large genome of
Cassia obtusa, they produced appreciable amplicons sufficient
Table 1. Place of collection and accession code
Place of collection Location on map (Fig. 1 A) Accession code
Pachamalai hills 1 COB1
Perumal malai 2 COB2
Pulivalam 3 COB3
Perambalur 4 COB4
[image:4.595.113.479.168.238.2]Karaikudi 5 COB5
Table 2. DNA yields from the frozen leaves of Cassia obtusa using different DNA extraction protocols
Accession code
DNA yields (ng/µl) Modified Phenol Chloroform
method (1981)
Doyle and Doyle method (1987)
Murray and Thompson method (1980)
COB1 257.0±1.0 80.2±0.6 20.1±1.0
COB2 183.1±2.6 62.1±0.3 15.7±0.9
COB3 119.2±2.7 93.0±0.5 21.0±0.6
COB4 161.3±1.7 45.1±0.6 17.1±0.4
COB5 143.0±2.1 36.0±0.7 16.2±0.1
[image:4.595.50.546.271.373.2] [image:4.595.154.436.397.458.2]Values are mean±SE (Standard error)
Table 3. RAPD primers and their sequences applied
Primer Sequence
5'3' % of G+C
Melting temp. (Tm)
Total no. of DNA bands (polymorphic
and non polymorphic) No. of polymorphic bands
Size of polymorphic band (bp)
OPA4 CCGCCCAAAC 70 34°C 14 3 1207-202-151
OPA5 TCTGTCGAGG 60 32°C 12 3 1388-1049-1010
OPA6 CACCTTTCCC 60 32°C 10 2 2243-513
OPA7 AGCGAGCAAG 60 32°C 5 1 558
OPA8 GAACACTGGG 60 32°C 6 1 215
OPA9 CCCTACCGAC 70 34°C 10 4 850-611-294-233
OPA10 GTGCAACGTG 60 32°C 12 2 2035-412
OPA11 CAATCGCCGT 60 32°C 7 2 894-181
OPA12 TCGGCGATAG 60 32°C 12 1 195
OPA13 CAGCACCCAC 70 34°C 27 6 672-640-215-135-118-102
Table 4. Similarity matrix of 5 accessions of Cassia obtusa based on RAPD profile
COB1 COB2 COB3 COB4 COB5
COB1 1.00
COB2 0.67 1.00
COB3 0.86 0.67 1.00
COB4 0.67 0.60 0.67 1.00
COB5 0.55 0.44 0.36 0.44 1.00
Table 5. Pairing Affinity (%) of 5 accessions of Cassia obtusa based on RAPD profile
COB1 COB2 COB3 COB4 COB5
COB1 100.00
COB2 33.33 100.00
COB3 60.00 33.33 100.00
COB4 33.33 30.00 33.33 100.00
COB5 27.27 22.22 18.18 22.22 100.00
[image:4.595.137.456.482.543.2] [image:4.595.83.513.586.759.2]Acknowledgements
Authors are thankful to the Department of Science and Technology, New Delhi, for providing the DST FIST-Sponsored program to our Department. Authors are grateful to the University Grants Commission, New Delhi, for providing financial support through a Major Research Project.
REFERENCES
Asit, B., Mandal, Vincy Anu Thomas and Elanchezian R.
(2007): RAPD pattern of Costus speciosus Koen ex.
Retz., an important medicinal plant from the Andaman and Nicobar Islands. 93(3): 369- 373.
Bell, G.I., Karman, J.H. and Rutter, W.J. (1981): Polymorphic DNA region adjacent to the 5' end of the human insulin gene. Proc. Natl. Acad. Sci. USA. 78(9): 5759-5763. Doyle, J. J. and Doyle, J.L. (1987): Method of isolation of
plant DNA from fresh tissue. Phytochem.Bull. 19: 11. Islam, M.A., Meister, A., Schubert, V., Kloppstech. K. and
Esch, E. (2007): Genetic diversity and cytogenetic analyses in Curcuma zedoaria (Christm.) Roscoe from Bangladesh. Genetic Resources and Crop Evolution. 54: 149-156.
Kumar, A., Tripathi, V. and Pushpangadan P. (2007): Random amplified polymorphic DNA as marker for genetic variation and identification of Senna surattensis Burm, f.
and Senna sulfurea DC.ex Collad. Current Science. 93(8):
1146-1150.
Mathew, K.M.(1983) : The Flora of the Tamil Nadu Carnatic. 1: 504-505.
Mondal, A.K. and Mandal, S. (1997): A contribution to the
medicinal plants of Burdwan District, West Bengal.
Environ. Ecol. 15: 166-174.
Murray, M.G. and Thompson, W.F.: Rapid isolation of high molecular weight plant DNA. Nucleic Acids Research. 8: 4321-4325, 1980.
Nei, M. and Li, W.H. (1979): Mathematical model for studying genetic variation in terms of restriction endonucleases. Proc. Natl. Acad. Sci. USA. 74: 5267-5273. Paisookasantivatana, Y., Kako, S. and Seko, H. (2001): Genetic diversity of Curcuma alismatifolia
Gagnep. (Zingiberaceae) in Thailand as revealed by
allozyme polymorphism. Genet. Resour. Crop. Evol.
48: 459-465.
Ribeiro, R.A. and Lovato, M.B. (2007): Comparative analysis of different DNA extraction protocols in fresh and herbarium specimens of the genus Dalbergia. Genet. Mol. Res. 6(1): 173-187.
Salim Khan, Irfan Qureshi, M., Kamaluddin, Tanweer Alam
and Abdin, M.Z. (2007) : African Journal of
Biotechnology. 6(3): 175-178.
Thirugnanam, S.( 2007): Mooligai Maruthuvam. Selvi Publishers, Tiruchi-23. 1: pp. 93.
Uma Shaanker, R. and Ganeshaiah K.N.(1997): Mapping genetic diversity of Phyllanthus emblica: Forest gene banks as a new approach in situ conservation of genetic resources. Current Science. 73:163-167.
Williams, J.G.K., Kubelik, A.R., Livek, K.J., Rafalski and
Tingy, S.V. (1990): DNA polymorphisms amplified
by arbitrary primers are useful as genetic markers. Nucleic Acids Res. 18:6531-6535.
Willis, J.C. (1973): A Dictionary of the Flowering Plants and Ferns, Cambridge University Press, London.