Brain Tumor Detection using Image Processing and
MATLAB Application
Faraz Hussain1, Manish Kumar Mawatwal
2, Dr Anitha G. S
31,2
B. E Scholar, Electrical and Electronics Engineering, RV College of Engineering, Bangalore, India
3Associate Professor, Electrical and Electronics Engineering, RV College of Engineering, Bangalore, India
---***---
Abstract - Medical imaging is a technique of creating visual representations of the organs and tissues of a body for medical analysis. Magnetic resonance imaging is a medical imaging technique used to form pictures of the anatomy of the body. Magnetic resonance imaging is non-invasive technology which uses strong magnetic fields and radio waves to generate three-dimensional images of the organs in the body depending on their water content. This paper proposes a strategy for detection and extraction of brain tumor from MRI brain scans using basic functions of image processing like thresholding, erosion, anisotropic filtering and creating a user-friendly GUI in MATLAB for medical professionals.
Keywords—MRI, GUI, MATLAB, Anisotropic, SVM 1. INTRODUCTION
A brain tumor is a mass or growth of abnormal cells in the brain. Many different types of brain tumors exist. Some brain tumors are noncancerous (benign), and some brain tumors are cancerous (malignant). Brain tumors can begin in your brain (primary brain tumors), or cancer can begin in other parts of your body and spread to your brain (secondary, or metastatic, brain tumors). How quickly a brain tumor grows can vary greatly. The growth rate, as well as the location of a brain tumor, determines how it will affect the function of your nervous system. Brain tumor treatment options depend on the type of brain tumor you have, as well as its size and location.
1.1 Symptoms
The signs and symptoms of a brain tumor vary greatly and depend on the brain tumor's size, location and rate of growth. General signs and symptoms caused by brain tumors may include:
1. New onset or change in the pattern of headaches 2. Headaches gradually become more frequent and
severe
3. Unexplained nausea or vomiting
4. Vision problems, such as blurred vision, double vision or loss of peripheral vision
5. A gradual loss of sensation or movement in an arm or a leg
6. Difficulty with balance 7. Speech difficulties
8. Confusion in everyday matters
9. Hearing Problems 1.2. Causes
1.2.1. Brain tumors that begin in the brain-Primary brain tumors originate in the brain itself or tissues close to it, such as in the brain-covering membranes (meninges), cranial nerves, pituitary gland or pineal gland. Primary brain tumors begin when normal cells acquire errors (mutations) in their DNA. These mutations allow cells to grow and divide at increased rates and to continue living when healthy cells would die. The result is a mass of abnormal cells, which forms a tumor. In adults, primary brain tumors are much less common than are secondary brain tumors, in which cancer begins elsewhere and spreads to the brain. Many different types of primary brain tumors exist.
1.2.2. Cancer that begins elsewhere and spreads to the brain-Secondary (metastatic) brain tumors are tumors that result from cancer that starts elsewhere in your body and then spreads (metastasizes) to your brain. Secondary brain tumors most often occur in people who have a history of cancer. But in rare cases, a metastatic brain tumor may be the first sign of cancer that began elsewhere in your body.
In adults, secondary brain tumors are far more common than are primary brain tumors. Any cancer can spread to the brain, but common types include:
1. Breast cancer
2. Colon cancer 3. Kidney cancer
© 2019, IRJET | Impact Factor value: 7.34 | ISO 9001:2008 Certified Journal | Page 373
2.MAGNETIC RESONANCE IMAGING2.1 Definition
Magnetic Resonance Imaging (MRI) is a non-invasive imaging technology that produces three-dimensional detailed anatomical images. It is often used for disease detection, diagnosis, and treatment monitoring. It is based on sophisticated technology that excites and detects the change in the direction of the rotational axis of protons found in the water that makes up living tissues.
2.2 MRI working
MRIs employ powerful magnets which produce a strong magnetic field that forces protons in the body to align with that field. When a radio-frequency current is pulsed through the patient, the protons are stimulated, and spin out of equilibrium, straining against the pull of the magnetic field. When the radio-frequency field is turned off, the MRI sensors can detect the energy released as the protons realign with the magnetic field. The time it takes for the protons to realign with the magnetic field, as well as the amount of energy released, changes depending on the environment and the chemical nature of the molecules.
2.3 MRI Application
The development of the MRI scan represents a huge milestone for the medical world. Doctors, scientists, and researchers are now able to examine the inside of the human body in high detail using a non-invasive tool. The following are examples in which an MRI scanner would be used:
1. Anomalies of the brain and spinal cord
2. Tumors, cysts, and other anomalies in various parts of the body
3. Breast cancer screening for women who face a
high risk of breast cancer
4. Injuries or abnormalities of the joints.
5. Certain types of heart problems
6. Diseases of the liver and other abdominal organs
3. PROPOSED TECHNOLOGY
[image:2.595.333.554.90.402.2]The proposed system can be summarized in three stages. The first stage contains filtering technique which removes noise by using Anisotropic Filter (AF) from the brain MRI image and then adjustment-based segmentation which segments the region of the tumor from the filtered image using a structuring element. The third stage contains morphological operation which shows the location of the tumor on the original image. Fig.1 shows the proposed system’s flowchart.
Fig. 3.1. Flowchart for proposed Methodology
3.1 Data-set
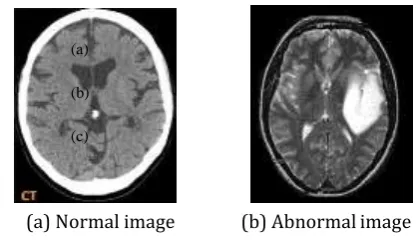
A single abnormal MR image is taken as input to detect the tumor. The input image is 256*256 pixels and 8-bit grayscale.
(a)
(b)
(c)
(a) Normal image (b) Abnormal image
Fig. 3.2. Brain MRI images
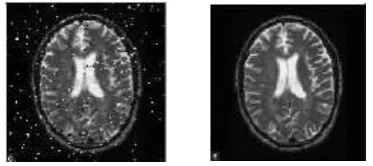
3.2 Anisotropic Filtering
[image:2.595.327.536.503.623.2]equation is introduced to describe the image diffusion process as follows:
where, ∇I - Image Gradient
c (m, n, t) – Diffusion coefficient
We can see that noise pixel has strong diffusion action and signal pixel has weak diffusion action. Thus, noise can be removed and the signal will be kept. There are many diffusion models to adopt the constant step size for each iteration or whole iterative process of the image. Here a better iteration step is proposed in the Eq.
where 1/4 is used to promise the convergence of the Eq. Final output phase image is obtained by the iterative process. For the iteration process, iteration error (IE) is used for controlling the iterative number and its formula is:
When IE ≤ Tolerance (Tie), the iterative process is stopped
[image:3.595.66.253.453.536.2]
Fig. 3.3: Input and Output of Anisotropic Filter.
3.3 SVM Filtration
SVM operates on another induction principle, called structural risk minimization, which can overcome the problem of over-fitting and local minimum and gain better generalization capability. Kernel function method is applied in SVM, which doesn’t increase the computational complexity, furthermore overcomes the curse of dimensionality problem effectively. SVM has demonstrated higher generalization capabilities in high dimensional space and spare samples. Its essence is to map the optimal separating hyperplane that can correctly classify all samples. The procedure of distributing an image into multiple parts is known as image segmentation. We use Support vector Technique (SVM). The equation to define a hyperplane
p(x)= ∝O+∝T z
where,
∝ - Weight vector
∝o - Bias
z - training examples closest to the Hyperplane
Best Feasible Legation of Plane |∝0+∝T z| = 1
Outcome gives the differences between a point z and a
Hyperplane (∝, ∝o):
The numerator is equal to one for the canonical hyperplane and the difference to the support vectors is,
The following equation that is two times the difference to the nearest examples represents the margin, denoted as M.
[image:3.595.371.501.464.561.2]Ultimately, the maximizing problem for M is identical to the minimizing problem for a function. R (∝) subject to several confines.
Fig. 3.4. For a linearly separable set of 2D-points which belong to one of two classes, find a separating straight
line.
3.4 Morphological operations
Morphology is an instrument to extract image features useful in the legation and recital of region shapes such as boundaries and skeletons.
1. Dilation: It works by object expansion, hole
filling and finally adding all the disjoint objects.
2. Erosion: It shrinks the object. Foreground pixel
background is eroded in the binary image by erosion operation.
© 2019, IRJET | Impact Factor value: 7.34 | ISO 9001:2008 Certified Journal | Page 375
tumor location from the image it is required to create aBinary tumor masked window.
Fig. 3.5: Segmented tumor Fig. 3.6: Eroded Image
Fig. 3.5: Tumor Outline Fig 3.7: Outline Tumor
4.MATLABAPPLICATION
We have opted for MATLAB as it a versatile and widely used application and provide flexibility in the development and debugging of the application. It has inbuild app designer plugin for the application development.
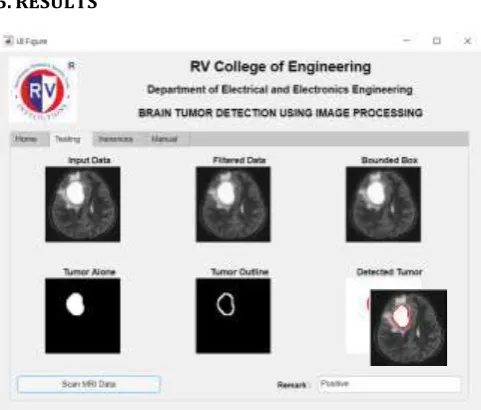
4.1 Home Tab
Homepage of the application, which is designed as a user-friendly application which is simple and efficient for medical professionals. Fig 3.1 shows the Home page of the application which gives basic medical information about the Brain Tumor. The Home tab is the default tab which appears whenever the application is launched. It describes the application.
4.2 Testing Tab
The Testing tab provides an option to browse for the MRI scans in an image format including the extensions like
[image:4.595.312.558.84.494.2] [image:4.595.42.261.121.313.2].jpg, .png, .jpeg etc. It provides the pictorial view of the different form of MRI data such as the input data, filtered data, bounded box, tumor alone, detected tumor and tumor outline. As soon as we upload the image, image processing is initiated and computer processes the scans followed by output which appears in the same tab. It also provides information about the remarks of the result. Time taken to process depends on the processor and Graphical Processing Unit (GPU) makes a noticeable amount of difference in time reduction of the process. Fig. 3.2 Shows Testing tab of the Application.
[image:4.595.316.557.298.497.2]Fig. 4.1: MATLAB Application Navigated to Home Tab.
Fig. 4.2: MATLAB Application Navigated to Testing Tab.
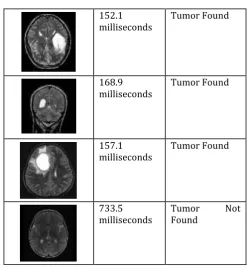
5. RESULTS
[image:4.595.316.557.536.741.2]Fig. 4.3: Resuls in Inference Tab
By analysis of results and processing time, we can conclude that processing speed and results depend on
1. Pixel gradient
2. Pixel size
3. Size of image and
4. Quality of image
We have performed time analysis for different images and results clearly shows the dependency of time on the above-mentioned parameters. Table 4.2 shows the processing time for different MRI Images.
Table: 4.1
MRI Image in .jpg
Format Processing Time Remarks
175.3
milliseconds Tumor Found
565.5
milliseconds Tumor Found
202.3
milliseconds Tumor Found
152.1
milliseconds Tumor Found
168.9
milliseconds Tumor Found
157.1
milliseconds Tumor Found
733.5
milliseconds Tumor Found Not
6. CONCLUSION
Medical image processing is the most challenging and emerging field now-a-days. Processing of MRI images is one of the parts of this field. This project makes MRI image analysis accessible to more people who need not have to be a specialist on MRI imaging. MRI imaging is less harmful than X-ray. It is less attenuated by bones. This project can make MRI image processing and tumor detection process faster and cheaper. The objective to detect if there is tumor in the given MRI Image scan of Brain using Image Processing is completed. If the tumor existed, the application successfully detected and specified the tumor location by highlighting the area. The GUI application on MATLAB is user- friendly for medical applications
7. FUTURE SCOPE
The process can be extended to a 3D image. The proper anatomical position may be detected. Fixed thresholds were used. Machine Learning may be implemented to train the system dynamically change the thresholds.
A novel algorithm for the segmentation and classification of brain tumors is described in this project work. Results and analysis show that the proposed approach is a valuable diagnosing technique for physicians to detect the brain tumors. But, in the final segmentation, a few other tissues also segmented in addition to tumors. Therefore, to improve the accuracy in the segmentation, it is necessary to include additional knowledge for discarding other tissues. In future work, it would be interesting to include additional feature information. Besides the energy, correlation, contrast and homogeneity add more information to the feature extraction to make the system more sensitive; information from the textures or location.
Result Processing time
[image:5.595.311.562.81.355.2]© 2019, IRJET | Impact Factor value: 7.34 | ISO 9001:2008 Certified Journal | Page 377
It will be interesting to continue developing moreadaptive models for other types of brain tumors following the same line of work presented here. Another future line would be the detection of small malignant brain tumors. It should be clear that many factors influence the appearance of tumors on images, and although there are some common features of malignancies, there is also a great deal of variation that depends on the tissue and the tumor type. Characteristic features are more likely to be found in large tumors. Small tumors may not have many of the features of malignancy and may even manifest themselves only by secondary effects such as architectural distortion.
REFERENCES
[1] A. Nandi, “Detection of human brain tumor using
MRI image segmentation and morphological operators” IEEE International Conference on Computer Graphics, Vision and Information Security (CGVIS), 2015.
[2] P. Perona, J. Malik, “Scale-Space and Edge Detection
Using Anisotropic Diffusion,” IEEE Trans. Pattern Anal. Mach. Intell. Vol. 12 No. 7, pp. 629-639, 1990.
[3] S. Handore, D. Kokare, “Performance Analysis of
Various Methods of Tumor Detection,” International Conference on Pervasive Computing (ICPC), 2015.
[4] L. Kapoor, S. Thakur, “A Survey on Brain Tumor
Detection Using Image Processing Techniques,” International Conference on Cloud Computing, Data Science & Engineering, 2017.
[5] P. Perona, J. Malik, “Scale-Space and Edge Detection
Using Anisotropic Diffusion,”IEEE Trans. Pattern Anal. Mach. Intell. Vol. 12 No. 7, pp. 629-639, 1990.
[6] S. Handore, D. Kokare, “Performance Analysis of
Various Methods of Tumor Dettion,” International Conference on Pervasive Computing (ICPC), 2015.
[7] L. Kapoor, S. Thakur, “A Survey on Brain Tumor
Detection Using
Image Processing Techniques,” International Conference on Cloud Computing, Data Science & Engineering, 2017.
[8] The National Center for Biotechnology Information,
[Online]
[9] R. C. Gonzalez, R. E. Woods, Digital image processing,