© 2019, IRJET | Impact Factor value: 7.211 | ISO 9001:2008 Certified Journal | Page 3323
A Real-Time Twitter Sentiment Analysis and Visualization System:
TwiSent
Mamta
1, Ela Kumar
21
Student (M.Tech), Computer Science and Engineering Department, IGDTUW, Kashmiri Gate, India
2Professor, Computer Science and Engineering Department, IGDTUW, Kashmiri Gate, India
---***---Abstract -
Sentiment analysis is a progressive field ofnatural language processing. It is a way to detect the attitude, state of mind, or emotions of the person towards a product, service, movie, etc. by analyzing the opinions and reviews shared on social media, blogs and so on. Various social media platforms such as Facebook, Twitter and so on allow people to share their views with other people. Twitter become the most popular social media platform that allows users to share information by way of the short messages called tweets on a real-time basis. Thousands of people interact with each other at the same time and a huge amount of data is produced in seconds. To make good use of this data, we develop a Real-time twitter sentiment analysis and visualization system called TwiSent. It is a web application and its purpose is to employ an open source approach for sentiment analysis and its visualization using a set of packages supported by python language to mine the real-time data from Twitter through application programming interfaces (APIs) using hashtags and keywords. This system will analyze the sentiments as positive and negative for a particular product and service that helps organizations, political parties, and common people to understand the effectiveness of their efforts and better decision making. Our experimental results show that TwiSent can process data in real-time, and obtain visualize information continuously.
Key Words: Sentiment Analysis, visualization, Real-time,
Twitter, Lexicon based approach
1. INTRODUCTION
Sentiment Analysis [4] is a trending research field within Natural Language Processing (NLP) that builds systems that try to identify and extract sentiments within the text. Sentiment analysis allows organizations, political parties, and common people to track sentiments towards any specific product or services for better decision making to improve their product or service. The goal of Sentiments analysis is to identify feelings, attitude, and state of mind of people towards a product or service and classify them as positive, negative and neutral from the tremendous amount of data in the form of reviews, tweets, comments, and feedback. With the expansion of the internet, a huge amount of organized and unorganized data is produced through various social media platform that allows people to share their opinion, comment, feedback, review, thoughts, and experiences with the world. Among all the social media platforms such as Twitter, Facebook, YouTube, Instagram
and so on, Twitter becomes most popular social media platform these days to publically share thoughts, feelings, views, and opinions with the world. It provides the facility that allows users to share information by way of the short messages called tweets (generally less than 140 characters, about 11 words on average) on a real-time basis. Sentiment analysis helps us in automatically transforming an unorganized large amount of data into an organized form in few minutes. This data can be helpful for government, politicians, organizations, researchers and various commercial applications.
In this paper, A Real-time twitter sentiment analysis and visualization system called TwiSent is proposed to analyze the huge amount of data. In our proposed work, we employ an open source approach for sentiment analysis using a set of packages supported by python language to mine the Twitter data and to carry out the sentiment analysis for tweets on any popular topic using hashtags and keywords and analyzing the sentiments of people towards that keyword or hashtag. The system will perform analysis in six phases which are data collection, data preprocessing, feature extraction, Sentiment Identification, Sentiment classification, and output presentation. We also identify the subjectivity of the tweets and compute the subjectivity score.
© 2019, IRJET | Impact Factor value: 7.211 | ISO 9001:2008 Certified Journal | Page 3324
2. LITERATURE REVIEW
Desheng Dash Wu, Lijuan Zheng, David L. Olson (2014) developed a novel ontology to analyze sentiments of online opinion posts in the stock market. They chose Sina finance, a typical financial website for the experimental platform to collect financial review data. The methodology is the combined approach for sentiment analysis using machine learning approach based on Support vector machine and generalized autoregressive conditional heteroskedasticity (GARCH-SVM) modeling. Their experiments show empirical results that suggest strong relationships between the stock price volatility trends and stock forum sentiment. Computational results show that the classification accuracy of statistical machine learning has better classification accuracy compared to the semantic approach. Results also state that relative to the growth stocks, sentiments of investor has a strong effect for value stocks. Three experiments were conducted: comparison of the classification performance between a machine learning approach and a lexicon approach, and two experiments involving the relationship analysis of sentiment and stock price volatility trends (at industry and individual stock levels).
Social media user can receive and share many messages in a short span of time. Due to this data can be generated very rapidly and shared with the world. Yong-Ting Wu, He-Yen Hsieh, Xanno K. Sigalingging, Kuan-Wu Su, and Jenq-Shiou Leu, (2017) developed a platform namely RIVA which is a Real-time Information Visualization and Analysis platform to analyze popular topics provided with a web browser visualization interface. Two web services are used as data sources, one is Twitter and the other is web news. The system used Apache Spark and Apache Zeppelin in combination. In their experimental results, the analysis on both the dataset is obtained as positive and evaluations state that when worker node increased time taken for sentiment analysis is less number of CPU core has no effect on the processing time. Hence, it provides scalability for the larger live data stream. They implemented a heterogeneous real-time data analyzer is implemented that can simultaneously analyze each data source for analytical results. In this paper, the only single word is compared in a text for sentiment analysis. The result may be poor if double negation is encountered. Shiv Kumar Goel and Sanchita Patil (2015) performed sentiment analysis on Twitter data using r programming. They classified sentiment polarity as positive negative and neutral in their work. They used lexicon approach which is implemented using Word cloud, a package in R programming that provides a large corpus of dictionary data to find sentiments. Results were presented using Bar and pie charts with a respective sentiment score to present results in a better way.
Akash Mahajan, Rushikesh Divyavir, Nishant Kumar, Chetan Gade, and L.A. Deshpande (2016) presented a research study by analyzing the impact if government programs. For their implementation, they collected Data from the official website of government i.e. my-gov.in. They applied the Stemmer
algorithm for Data pre-processing that make the source data more compact to perform sentiment analysis. Data is analyzed and categorize into positive, negative and neutral sentiments with Corresponding pie and bar charts to present output more efficiently. Results depict the moods of users towards various government programs like Swachh Bharat Abhiyan and Beti Padhao Beti Bachao. Tun Thura Thet, Jin-Cheon Na and Christopher S.G. Khoo (2010) performed sentiment analysis at the clause level in their research work to analyze and summarize the multiple review aspects. They used IMDB as their data source. The system processing depends upon the grammatical words in a sentence in which clauses are classified independently to calculate sentiment score for each clause focused on a particular aspect to highlight the most positive and negative. Various factors were there that leads to error rates. Some prior words had assigned wrong scores due to multiple meanings. Some other factors such as grammatical mistakes, incomplete sentences, and misleading terms in clauses also lead to incorrect results. The algorithm was unable to handle some complex expressions of sentiment in the text due to which major misclassifications were made.
According to Zhao Jianqiangi, and Gui Xiaolini (2016) various Text pre-processing methods affects the performance of sentiment classification. They proposed six different pre-processing methods that show different sentiment polarity classification results in Twitter. A series of experiments are conducted on five twitter datasets using four classifiers to verify the effectiveness of several pre-processing methods. Experimental results show that the performance of classifiers is negligibly affected by the removal of URLs, the removal of stop words and the removal of numbers. Classification accuracy is also improved by replacing negation and expanding acronyms. Therefore, removal of stop words, numbers, and URLs are helpful to reduce noise but performance remain unaffected. Negation replacement is effective for sentiment analysis. Their studies conclude that the selection of appropriate pre-processing methods and feature models for different classifiers result differently for the Twitter sentiment classification task.
© 2019, IRJET | Impact Factor value: 7.211 | ISO 9001:2008 Certified Journal | Page 3325
Surendra Sedhai and Aixin Sun (2018) proposed asemi-supervised spam detection framework, named S3D. Four lightweight detectors were used to detect spam tweets in S3D on a real-time basis and models are updated periodically in batch mode. Experiment results effectively demonstrate spam detection using the semi-supervised approach in their framework. New spamming patterns were effectively captured by confidently labeled clusters and tweets in their experiment. A fine-grained approach namely Tweet-level spam detection in which detection of real-time spam tweets takes place. Due to the lack of user information in their dataset, Spam users cannot be detected much efficiently in their system. Spam user can affect other users by the time a malicious user is detected. So that tweet level spam detection complements user level spam detection.
Mondher Bouazizi and Tomoaki Otsuki (Ohtsuki) (2016) used Parts of Speech tags to extract patterns that characterized the level of sarcasm of tweets. They performed different natural language processing (NLP) tasks Using Apache Open NLP tool. Their studies show good results by the applied selected approach but if the training set was bigger results could be much better. Because all the possible sarcastic patterns were not covered due to the small training set. Mark E. Larsen, Tjeerd W. Boonstra, Philip J. Batterham, Bridianne O'Dea, Cecile Paris, and Helen Christensen (2015) developed the We Feel system as a real-time emotional sentiment analysis tool on Twitter. For their research work, 2.73×10⁹ tweets were analyzed over a 12-week period. They performed a series of analyses to demonstrate potential data use, identifying the weekly variations in emotional expression, to detect significant events. Correlations between emotional tweets and indices of anxiety and suicide were also observed that indicate the potential to develop a social media based measurement tool population mental wellbeing.
3. APPROACH
We developed a framework for Real-Time Twitter data sentiment analysis and its visualization using the lexicon-based approach. The lexicon-lexicon-based approach [5] does not need any training set to process information. In the lexicon-based approach, there is no requirement to train the algorithm. This approach completely relies on searching the opinion lexicon into a huge dictionary or corpus where a predefined list of words with respective sentiment polarity orientation and score. This approach classifies the sentiment of review or opinion by counting the positive and negative word after detecting polarity orientation and score from the dictionary. Positive words depict desired and favorable conditions, whereas negative words depict undesired and unfavorable conditions. Lexicon based approach has two types i.e., dictionary-based or corpus-based. Our system uses a corpus-based approach. The corpus-based lexicon approach contains huge opinion word list of positive and negative orientation. Opinion words from our test dataset are searched into these wordlists to detect context particular polarity orientation. Corpus-based ways allow researchers to
obtain moderately good precision in sentiment analysis. We have used TextBlob for the corpus to perform sentiment analysis in our system. TextBlob is a Python library for processing textual data. It provides a simple API to perform common natural language processing (NLP) tasks such as part-of-speech tagging, noun phrase extraction, sentiment analysis, classification, translation, subjectivity score and more. TextBlob is built upon the NLTK library. It provides extra functioning than NLTK and is much easier to use. Text Blob has a large number of corpora set, provide many stemmers and dozens of algorithms to perform text analysis.
4. PROPOSED METHODOLOGY
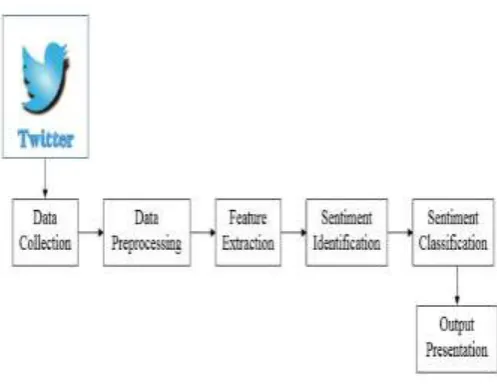
[image:3.595.311.560.405.599.2]Various studies are performed for sentiment analysis on textual data that primarily analyze unorganized and unstructured data into an organized and structured manner to find the opinion polarity as positive or negative and neutral. In this paper, we proposed a methodology for a sentiment classification system to classify the sentiment polarity of the tweets. The proposed System allows us to process the Twitter data and to carry out the analysis. Figure 1 shows the basic architecture of our proposed methodology for sentiment analysis where data is extracted from twitter and then sentiment analysis is performed on that data in various phases.
Fig - 1: Basic Architecture of Proposed Work
© 2019, IRJET | Impact Factor value: 7.211 | ISO 9001:2008 Certified Journal | Page 3326
Fig - 2: Detailed Architecture for Proposed Methodology4.1 Data Collection
[image:4.595.58.268.494.681.2]We chose Twitter for our data collection as it is very popular nowadays. Tweets can be extracted from Twitter using hashtags or keywords. Hashtags or keywords are basically used to categorize tweets, making it easy to search. To extract tweets from twitter, twitter API is required. The Twitter Search API could produce a limited number of tweets at a time which is one of the constraints imposed by Twitter. The Twitter API can be accessed through the Tweepy library in python. Tweepy allows us to easily use the twitter streaming API. It manages authentication, connection, and many other services. API authentication is necessary for accessing Twitter streams. The Twitter streaming API downloads twitter messages in real time. It is useful for obtaining a high volume of tweets, or for creating a live feed using a site stream or user stream. This twitter streaming API can be used to retrieve tweets been tweeted for any hashtag or keyword.Figure3 shows the block diagram for data collection.
Fig - 2: Data Collection Process
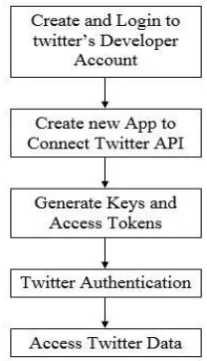
4.1.1
Twitter Authentication
We need to get 4 components of data from Twitter to access the Twitter Streaming API: API key, API secret, Access token and Access token secret These 4 components are used for
Twitter authentication that can be produced by creating an application on Twitter. It requires a developer’s account. If you do not already have a twitter developer’s account, create the one using dev.twitter.com. Now go to https://apps.twitter.com/ and sign in with your Twitter credentials. Click on "Create New App". Fill out the form, agree to the terms, and click "Create your Twitter application". After creating the app, go to "Keys and tokens” tab, and copy your "API key" and "API secret". Scroll down and click "Create my access token", and copy your "Access token" and "Access token secret". In this way, we get access to consumer key, consumer secret, access token, access secret using which the API has to authenticate itself with the Twitter Authentication server. Figure 4 shows the twitter authentication process as follows:
Fig - 3: Twitter Authentication
4.1.2 Accessing Twitter Data
After the authentication, we need to connect with Twitter Streaming API. Tweepy a python library enables us to connect with Twitter and download data. Once the Twitter Authentication service authenticates the API, a token is generated and made available to the API for each Twitter server transaction. Using this token, tweets are mined using hashtags or keywords. To access the data, we use the following code, and this downloaded data is stored in .csv files as or dataset.
auth = OAuthHandler(ckey, csecret)
auth.set_access_token(atoken, asecret)
twitterStream = Stream(auth, listener())
twitterStream.filter(track=[inp])
4.2 Data Preprocessing
© 2019, IRJET | Impact Factor value: 7.211 | ISO 9001:2008 Certified Journal | Page 3327
vocabularies, slangs, the context of writing, etc. Therefore,data preprocessing consists of data cleaning and stop word removal.
4.2.1
Data Cleaning
It includes Removal of unnecessary data such as HTML Tags, white Spaces and Special characters takes place from the Twitter dataset. This noise does not make any sense, therefore, they need to be removed. Data cleaning is achieved by importing regular expression (RE) python library. Process of cleaning data for our system is as follows:
a. The First step is to remove the URL. URL is not considered as an essential element in the tweets and just for simplicity, URLs are removed.
b. Twitter handlers such as ‘@abs’ are also removed as these are not provide any weights in sentiment classification.
c. The next step is to remove punctuation. After that, the removal of special character takes place.
d. Non-textual contents and contents that are irrelevant for the analysis are identified and eliminated.
e. Extra White spaces are also replaced with single white space.
f. White spaces from the beginning and end are also removed.
4.2.2
Stop Words Removal
Stop words are the dictionary-based bag of words. These are the set of commonly used words not only in English but in any other language. Stop words focus on important word only instead of commonly used words in a language. Stop word Removal is done by eliminating the unnecessary words from the Twitter data set, So that, the resultant data set contains only the required information for the analysis. The process of stop word removal is as follows:
a. First of all, tokenization takes place. "Tokens" are usually individual words and “tokenization" is taking a text or set of text and breaking it up into its individual words.
b. After that, all the unnecessary words are removed after tokenization such as ‘a’, ‘an’, ‘the’, and so on. These unnecessary words are the stop words which have no meaning.
After stop word removal, only important words that could lead to sentiment detection are left. Stop word Removal and tokenization is achieved by another python library known as NLTK.
4.2.3
Lemmatization
Lemmatization is to reduce inflectional forms and sometimes derivationally related forms of a word to a common base form. For instance, vehicle, vehicles, vehicle’s, vehicles’ vehicle. Lemmatization is similar to stemming with a
difference. Lemmatization generally relates to doing stuff correctly using a term vocabulary and morphological analysis, normally aimed solely at removing inflection marks and returning to the base or dictionary form of a word recognized as the lemma. Whereas Stemming generally relates to a coarse heuristic method that chops off the ends of words in the expectation of attaining this objective properly most of the time, and often involves removing derivative affixes. If faced with the token saw, stemming might return just s, whereas lemmatization would try to return either see or saw based on whether the token was used as a verb or a noun. The two may also vary in the fact that stemming most commonly collapses derivative-related words, whereas lemmatization usually collapses only distinct inflection forms of a lemma. With the assistance of the python library recognized as TextBlob, lemmatization in our proposed methodology is performed to conduct easy natural language processing tasks. TextBlob is easier, similar to many features of NLTK.
4.3 Feature Extraction
Feature extraction is an important step in opinion mining that generates a list of object, aspect, features, and opinions. The purpose of feature extraction is to extract opinion sentences which contain one or more features, aspects, and opinions. In most of the cases, aspect words are nouns and noun phrases, their opinion words are adjectives and adverbs. In this research work, features are extracted using the TextBlob library. After the preprocessing phase, only necessary words are left in tweets which are used for analysis. We extract only nouns and noun phrases from the tweets. These noun phrases are used to know the ‘who' in the tweet. After the extraction of nouns and noun phrases, only words that have features or aspects such as adjective and adverb and so on are left. Therefore, in the next phase, these extracted features are classified into sentiments.
4.4 Sentiment Identification
© 2019, IRJET | Impact Factor value: 7.211 | ISO 9001:2008 Certified Journal | Page 3328
4.5 Sentiment Classification
In this phase, we classify the sentiment of the tweet by using our calculated sentiment polarity score. We classify the sentiments for two datasets. Dataset1 classify the sentiments in 3 categories as positive negative and neutral. If the polarity score is greater than 0, then the sentiment of a tweet is classified as positive. If the polarity score is less than 0 then the sentiment of a tweet is classified as Negative. And finally, the tweet is classified as Neutral, if the polarity score is equal to 0. While the dataset2 provide detailed description by classifying sentiments in 7 categories such as Strongly Positive, Positive, Weakly Positive, Strongly Negative, negative, Weakly Negative, and Neutral. If the final calculated Polarity score of the tweet is greater than 0.6 and less than or equal to 1, then the tweet is classified as strongly positive. If the polarity score is greater than 0.3 and less than or equal to 0.6 then the tweet is classified as positive. If the polarity score is greater than 0 and less than or equal to 0.3 then the tweet is classified as weakly positive. If the polarity score is equal to 0 then the tweet is classified as Neutral. If the polarity score is greater than or equal to -0.3 and less than 0 then the tweet is classified as weakly negative. If the polarity score is greater than or equal to -0.6 and less than -0.3 then the tweet is classified as Negative. If the polarity score is greater than or equal to -1 and less than -0.6 then the tweet is classified as Strongly Negative.
4.6 Subjectivity Identification
Subjectivity can be seen in the explanatory sentences. Subjective sentences are opinions that define the emotions of individuals towards a particular topic or subject. There are many forms of subjective expressions, such as views, claims, wishes, convictions, doubts, and speculations. The subjective phrase is "I like gold color," although the objective phrase includes facts and has no view or opinion. For instance, “the color of this phone is gold” is an objective sentence. A subjective sentence may not express any sentiment. For example, "I want a phone with good battery backup" is a subjective sentence, but does not express any sentiment. In our system, we get the subjectivity score for the tweets using the TextBlob library function. TextBlob Library already has a dictionary that contains subjectivity score for the words. Modifiers increase the subjectivity of a word or sentence. For example, "Very Good" is more subjective than "Good" Subjectivity is a range of values within [0.0, 1.0]. Here, 0.0 is very objective and 1.0 is very subjective.
4.7 Output Presentation
The final phase of our sentiment analysis is the visualization of the results. We use Pie charts, Trend Graphs and tables to view the results. We use a python library Matplotlib to plot Pie charts and a trend graph to plot these charts and charts. Its numerical extension to mathematics is NumPy. And we're using Pandas for table visualization. Pandas is a software library for manipulation and analysis of data written for the
Python programming language. It provides data structures and operations to manipulate numerical tables and time sequences.
We developed our system as a web application. It takes user input in the form of Hashtag or keyword and process data and visualizes results on a webpage using charts, graphs, and tables. To develop this webpage we use Dash. Dash is a productive Python framework for the development of analytical web applications. Building on top of Plotly.js, React, and Flask, Dash directly links modern UI elements such as dropdowns, sliders, and graphs to your python analytical code. Dash summarizes all the techniques and protocols needed to create an interactive web-based application. Dash is easy enough to connect your Python code to a user interface.
5. EXPERIMENT AND RESULTS
Data is collected from twitter for analyzing tweets on any popular topic using hashtag or keyword. In our experimental work, we store tweets in two datasets. We choose two trending hashtags #CWC19 and #Journalism. Dataset1 contains the tweets on #CWC19 and another dataset contains the tweets on #journalism. These tweets are extracted from 18 June to 20 June 2019. #CWC19 is the hashtag for ICC Cricket World Cup 2019. Tweets are extracted for the matches India vs. Afghanistan, Australia vs. Bangladesh, etc. #Journalism is in trend because of television news anchor Anjana Om Kashyap,’s live reporting on Acute Encephalitis Syndrome in Bihar from Krishna Medical college in Muzaffarpur. She entered into the ICU and was seen interviewing doctors who are busy in treating patients. Dataset1 contains 2000 tweets and Dataset2 contains 1200 tweets. Dataset1 shows the detailed analysis of tweets into seven categories such as strongly positive, Positive, Weakly Positive, Strongly Negative, Negative Weakly Negative. Chart 1 shows the results of Dataset1 for 2000 tweets on #CWC19.
© 2019, IRJET | Impact Factor value: 7.211 | ISO 9001:2008 Certified Journal | Page 3329
According to pie chart for #CWC19 we observed that 12.95%tweets are positive, 17.40% tweets are Weakly positive, 4.65% tweets are Strongly Positive 3.20% tweets are negative, 8.80%tweets are Weakly Negative, 1.35% rewets are Strongly Negative and rest are Neutral. These results show that the majority of People has a positive sentiment towards #CWC19.
Dataset 2 classify sentiment in 3 Categories such as Positive, Negative and Neutral. Chart 2 shows the results for Dataset2 contains 1200 tweets for #Journalism.
Chart - 2: Results for Dataset2 tweets on #Journalism
According to chart 2 for #Journalism, We observed that 31.6% tweets are Negative, 17.7% tweets are positive and rest are neutral. These results show that the majority of people carry negative sentiment towards Journalism because of Anjana Om Kashyap's Reporting.
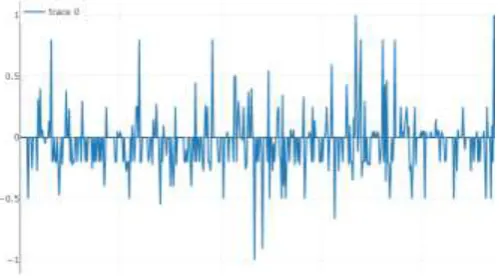
We visualize our results with a trend graph which is shown in chart 3. This graph generated according to the polarity score where Values vary from -1 to 1.
[image:7.595.308.561.112.236.2]Chart - 3: Trend Graph visualization for Dataset2
[image:7.595.38.280.232.412.2]Table 1 shows the results for dataset1 that contain Name, Screen_Name, Location, Tweets, Sentiment, and Score.
Table – 1: Results of Dataset1 for #CWC19 stored in CSV File
Table 2 shows the results for Datset2 that contain tweets, Polarity, Polarity Score and subjectivity. We are showing
[image:7.595.308.560.317.467.2]some sample tweets as all the tweets cannot be shown here.
Table – 2: Results of Dataset2 for #Journalism on Webpage
6. CONCLUSION
In this work, a new methodology is proposed using python tools based on Lexicon approach to get sentiment analysis on two datasets extracted from Twitter. Dataset1 contains tweets on #CWC19 and classified results are visualized using a detailed pie chart. The overall nature of dataset1 is positive. While the dataset2 contains tweets on #Journalism and classified results are visualized using a pie chart and trend graph into 3 categories. Overall nature of dataset2 is negative. Results are much accurate for both the dataset.
7. Future Work
[image:7.595.40.290.560.699.2]© 2019, IRJET | Impact Factor value: 7.211 | ISO 9001:2008 Certified Journal | Page 3330
is to identify empirically lexical and pragmatic factors thatdifferentiate between sarcastic, positive and negative use of words with multilingual analysis.
REFERENCES
[1] Shiv Kumar Goel, Sanchita Patil, “Twitter Sentiment
Analysis of Demonetization on Citizens of INDIA using R”, IJIRCCE, Vol. 5, Issue 5, May2017.
[2] Tun Thura Thet, Jin-Cheon Na, Christopher S.G. Khoo,
“Aspect-based sentiment analysis of movie reviews on discussion boards”, Journal of Information Science, 2010, pp. 823–848.
[3] ShravanVishwanathan, “Sentiment Analysis for Movie
Reviews”, Proceedings of 3rd IRF International Conference, 10th May-2014.
[4] Akash Mahajan, Rushikesh Divyavir, Nishant Kumar,
Chetan Gade, L.A. Deshpande, “Analyzing the Impact of Government Programs”, IJIRCCE, Vol. 4, Issue 3, March 2016.
[5] Desheng Dash Wu, Lijuan Zheng, David L. Olson, “A
Decision Support Approach for Online Stock Forum Sentiment Analysis”, IEEE Transactions on Systems, Man, and Cybernetics: Systems, VOL. 44, NO. 8, AUGUST 2014.
[6] K.Arun, A.Srinagesh, M.Ramesh, “Twitter Sentiment
Analysis on Demonetization tweets in India Using R language”, International Journal of Computer Engineering In Research Trends Volume 4, Issue 6, June-2017, pp. 252-258.
[7] Yong-Ting Wu, He-Yen Hsieh, Xanno K. Sigalingging,
Kuan-Wu Su, Jenq-Shiou Leu, “RIVA: A Real-time Information Visualization and Analysis Platform for Social Media Sentiment Trend”, 9th International Congress on Ultra-Modern Telecommunications and Control Systems and Workshops (ICUMT), 2017.
[8] Karthik Ganesan, Akhilesh P Patil, Srinidhi Hiriyannaiah,
"Predictive Analysis of Tweets on Goods and Services Tax(GST) in India using Machine Learning" International Journal of Engineering Technology, Management, and Applied Sciences, Volume 5, Issue 8, August 2017.
[9] Sahil Raj, TanveerKajla, “Sentiment Analysis of Swachh
Bharat Abhiyan”, International Journal of Business Analytics and Intelligence, Volume 3, 1 April 2015.
[10] Kiran Dey, Saheli Majumdar, “Customer Sentiment
Analysis by Tweet Mining: Unigram Dependency Approach”, Indian Journal of Computer Science and Engineering (IJCSE), Vol. 6 No.4 Aug-Sep 2015.
[11] Zhao Jianqiangi, Gui Xiaolini, “Comparison Research on
Text Pre-processing Methods on Twitter Sentiment Analysis”, IEEE. Translations and content mining, 2017.
[12] Mondher Bouazizi, Tomoaki Otsuki (Ohtsuki),
“Pattern-Based Approach for Sarcasm Detection on Twitter”, IEEE Access, volume 4, 2016.
[13] Mark E. Larsen, Tjeerd W. Boonstra, Philip J. Batterham,
Bridianne O’Dea, Cecile Paris, Helen Christensen, “We Feel: Mapping Emotion on Twitter”, IEEE Journal Of Biomedical And Health Informatics, Vol. 19, NO. 4, JULY 2015.
[14] Surendra Sedhai, Aixin Sun, “Semi-Supervised Spam
Detection in Twitter Stream”, IEEE Transactions on Computational Social Systems, VOL. 5, NO. 1, MARCH 2018.
[15] Ping-Feng Pai, Chia-Hsin Liu, “Predicting Vehicle Sales
by Sentiment Analysis of Twitter Data and Stock Market Values”, IEEE Access, Volume 6, 2018.
[16] Cohan Sujay Carlos, “Perplexed Bayes Classifier”, ICON: