A Reliability Evaluation of High-Speed Railway
Traction System Based on Failure Effect Analysis
Evelina Rakhmetova,
Fellow, IAENG
Vladimir Moiseenko,
Fellow, IAENG
Lorenzo Damiani,
Member, IAENG,
Olga Ivanova,
Fellow, IAENG
Mikhail Ivanov,
Fellow, IAENG
Roberto Revetria,
Member, IAENG,
Abstract—The article presents the necessity to perform re-liability evaluation of railway traction system with respect to the current status and plans for further development of high-speed railways in Russia. Basing on the statistical data provided on failures for various units of electric trains, the traction system was selected. A complex analysis of the traction system was carried out, and a model for the interconnection of system components was compiled. The reliability chart of traction system of the high-speed train was constructed based on the FMEA modelling approach using TARAS software. The calculation has resulted in a total failure rate of the system equal to 4,46% or 580 hours of suspended operation of the train. Also, the most vulnerable element of the traction system was identified - a traction system motor. Basing on these outcomes a set of recommendations has been made in order to increase the performance efficiency of the high-speed trains.
Index Terms—reliability evaluation, high-speed railways, software analysis, railway traction system.
I. INTRODUCTION
T
ODAY, high-speed railway system was set as a key pri-ority in transportation development in many countries [1]. High-Speed Rail (HSR) can potentially transform the geography of a country, bringing regions and cities closer to each other by improving accessibility [2, 3].Since December 2009, Russian High-Speed modernized infrastructure links regions such as Moscow, Tver, Leningrad, Vladimir, and Nizhny Novgorod regions [4]. High-speed trains Sapsan [5] run between Moscow and St. Petersburg, Allegro [6] between Saint Petersburg and Helsinki, Stryzh between Moscow and Nizhny Novgorod, Lastochka - be-tween St. Petersburg and Veliky Novgorod, Moscow, and Nizhny Novgorod, and in Sochi region [7]. Every year high-speed trains of JSC Russian Railways carry over 3.2 million passengers.
The development of high-speed communication, presented in Fig. 1, is carried out within the ”Program for the de-velopment of high-speed on the railway (HSR) network of JSC ”Russian Railways” for the period up to 2020” and the ”Strategy for the Development of Railway Transport in the Russian Federation until 2030”.
Manuscript received December 07, 2017;
E. Rakhmetova is with the Bauman Moscow State Technical University, Moscow, 105005 Russia and University of Genoa, Genoa, 16145 Italy (cor-responding author phone: +393483449513; e-mail: [email protected]). V.O. Moiseenko is with the Moscow State University of Railway Engi-neering, Moscow, 127994 Russia (e-mail: [email protected])
L. Damiani is with University of Genoa, Genoa, 16145 Italy (email: [email protected])
O.A. Ivanova is with the Bauman Moscow State Technical University, Moscow, 105005 Russia (e-mail: [email protected]).
Dr. M.V. Ivanov is with the Bauman Moscow State Technical University, Moscow, 105005 Russia (e-mail: [email protected]).
[image:1.595.328.525.184.339.2]Prof. R. Revetria is with University of Genoa, Genoa, 16145 Italy (email: [email protected])
Fig. 1. The Russian Federation High-Speed Transport Strategy 2030
A network of high-speed lines (about 11.8 thousand km) will be built [8]. The key projects of JSC ”Russian Railways” will be the lines:
- ”Moscow - Kazan - Yekaterinburg”, 1 532 km; - ”Moscow - St. Petersburg”, 659 km;
- ”Moscow - Rostov-on-Don - Adler”, 1 540 km.
Among this, Russian Federation Transport Strategy includes the implementation of prioritized HSR: ”Moscow -Saint Peters- burg”, ”Moscow - Kazan - Yekaterinburg”, and HSR Center- South ”Moscow - Rostov-na-Donu - Adler”. The planned number of users is expected to be more than 100 million people, which is around 70% of the total Russian Federation population.
Such ambitious project requires the development of a series of approaches to maintain high transportation safety, exclude any possible train collisions, injuries and deaths of passengers and staff, minimize damages to the equipment of the railway system and impact on the environment. Therefore, a key priority was set to perform constant risk and reliability analysis of the developed HSR systems.
II. PRINCIPLES OFRELIABILITYANALYSIS
Assessment of the risks of possible adverse events of the technical systems is carried out by methods of qualitative and quantitative analysis using all available information to minimize the risk.
Estimating reliability is essentially a problem in failure probability modelling. The modern system consists of several components, which in turn can consist of even smaller ones. In the simplest case, each component has two states: Operating or Failing.
- Failure Modes and Effects Analysis (FMEA);
- Failure Modes and Effects and Criticality Analysis (FMECA);
- Fault Tree Analysis (FTA); - Event Tree Analysis (ETA).
In Quantitative Risk Analysis an attempt is made to numerically determine the probabilities of various adverse events and the likely an extent of the losses if a particular event takes place. It seeks to numerically assess probabilities for the potential consequences of risk, and is often called probabilistic risk analysis or probabilistic risk assessment.
III. RISKANALYSIS OFHIGH-SPEEDRAILWAYS
The interest in reliability analysis in the field of the High-Speed Railway is continuously increasing, with a particular focus on electrical equipment.
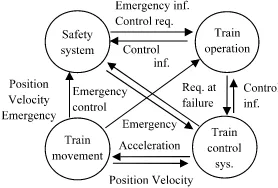
[image:2.595.332.519.53.217.2]Standard reliability models, such as ETA and FTA, gen-erally are used by analyzing the system configuration, if the failure state and subsystem motion change in order. The creation of the reliability block model is based on the hardware configuration In the analysis of reliability and control of equipment, the operation of trains has functions with related dependencies and cause-effect relationships. Relationships for evaluation of the reliability of the entire system by simulating are presented in Fig. 2.
Fig. 2. Scheme of Relations in Train Reliability Control
This paper focuses on the Failure Modes and Effects Analysis for a number of reasons described below. The high-speed train is a dynamic system with a vast number of components, the change in the parameters of which is described by a nonlinear dependence. It becomes obvious that to fully assess the reliability of high-speed trains, it is necessary to adhere to the FTEA standard.
FMEA allows evaluating the behaviour of a system, hier-archically decomposed into levels of detail, to understand the failure modes and all the causes that lead to the crisis of a component or the whole system. The bottom-up approach, from small details to the higher levels, is normally the practice for conducting this analysis.
The purpose of the FMEA is the definition of the problem and is to establish a level of resolution for the analysis and the description of the boundary conditions. The analysis starts from the characteristics of the analyzed system and the level of precision required of the project, then moving to the boundary conditions that consist of interfaces of the considered system with external systems and processes.
FMEA has 3 objectives set [10]:
[image:2.595.97.236.383.477.2]- identify and analyze all potential failures associated with a certain system, assessing the effects;
Fig. 3. System Reability Model
- identify actions to eliminate or significantly reduce system failures and consequences associated;
- document the system from a functional point of view at the design and operating phase.
It is known, that each technical system consists of a series of subsystems. Taking subsystems as the nodes and taking the roles of the relationship between the subsystems as edges, a model of the system might be built with characteristics of the network topology. Shown in Fig. 3 conception is the basic principle of model development.
The system is a collection of n identifiable elements performing some function. We define two operating states that relate to the systems ability to perform its function. Success: The system performs its function satisfactorily for a given period of time, where the criterion for success is clearly defined. Failure: The system fails to perform its function satisfactorily.
IV. RELIABILITY EVALUATION OF TRACTION SYSTEM
From the viewpoint of reliability, it is assumed that all types of equipment and components are exponentially dis-tributed. At the same time, after continuously working, they already have stable characteristics. Furthermore, we assume that the traction system is a repairable system [11, 12].
The management of the maintenance of the infrastructure is based on the form of standards of the reference quality. This normative framework allows correct interpretation of the actions to be undertaken. For each observation variable, it defines thresholds severity of the critical situations and frequency of the maintenance to avoid crisis situations.
A. Statistical Failure Rate and Technical Maintenance
For a high-speed railway, the frequency of scheduled maintenance depends on the trains run, which must reach
important component (in accordance with statistical data) of the traction system.
63
27 27 24
19 16
11 10 7 6
5 5
3 3 2 2 2 2 1 1 1 1 0
[image:3.595.306.543.63.219.2]10 20 30 40 50 60 70
Fig. 4. Statistics of failures and breakdowns of high-speed trains in percentage terms
B. System description
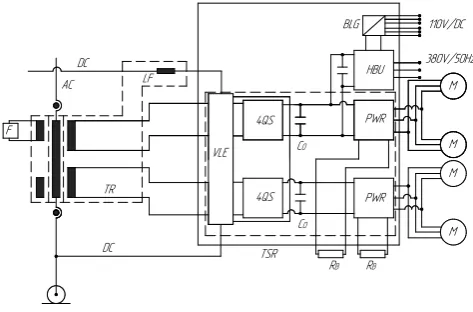
The traction system (Fig. 5) consists of two identical traction sections. Each traction section belongs to a head railcar (railmotor) or a passenger car. In AC operation mode, energy is transferred through the current collector, the main AC switch, which is located on the roof of passenger car, and, if necessary, through the roof wiring to the primary winding of the transformer.
The transformer has two traction windings that feed a single container of traction converters (TSR) located in the under car space. In DC mode, energy is transmitted through a current collector, a high-speed DC breaker and a throttle (LF) to a transformer (TP).
The container of traction converters (TSR) provides power to four traction motors so that the drive of the axles of the cars can function. Each traction converter (TSR) is connected to a braking resistor (RB), which is mounted on the roof. In traction converters (TSR), the wiring lines are connected to two four-quadrant controllers (4QS) via the AC mains disconnecting contactors and the pre-charge device(VLE). The DC outputs of the four-quadrant controllers (4QS) are open, and each feeds one intermediate circuit.
The following nodes are connected to the intermediate loops:
- The brake regulator with braking resistor (RB), so that even with a small contact network, electrodynamic braking is possible;
- The condenser of the intermediate circuit (C0) as an intermediate energy store for smoothing the DC link voltage in the traction circuit;
- The impulse Inverter (PWR) for supplying two traction motors;
- Tre converter (HBU) with the battery charger (BLG) on the intermediate circuit.
C. Calculation Model of Tree
On the basis of the principles of the FMEA methodology, in combination with Fig. 3 and Fig. 5, at the same time,
LF AC
DC
F
TR
DC TSR
RB
4QS
C0
C0
PWR
M
4QS
RB
M
M
M PWR
VLE
HBU
BLG 110V/DC
380V/50Hz LF
AC DC
F
TR
DC TSR
RB
4QS
C0
C0
PWR
M
4QS
RB
M
M
M PWR
VLE
HBU
BLG 110V/DC
380V/50Hz
Fig. 5. A Schematic Diagram of the High-Speed Railway Traction System BLG - Battery Charger, PWR - Impulse Inverter,C0 - Capacitor, RB
-Braking Resistor, F - Filter, TSR - Container of Traction Converters, HBU - Converter, TR - Transformer, LF - Throttle, VLE - Pre-charging Device, M - Traction Motor, 4QS - Four-quadrant Controller
considering that electrical equipment of traction system has the certain life, the main indicator for the calculation takes a failure probability of components -λ. The reliability chart of traction system of the high-speed train was constructed based on the FMEA modelling approach proposed in this paper, as shown in Fig. 6.
The traction system consists of three major subsystems: Container of traction converter, transformer and electrical network. Each of these subsystems has to perform well in order to have no failures. The container of traction converter subsystem includes two containers of traction converters as was described above. Each of them includes a pre-charging device, four-quadrant controller, braking resistor, impulse inverter, capacitor, traction motor block and converter block. All of them have to perform well in order to have no failures of the traction system. Traction motor block consists of two motors, which are used to back up each other. Converter block consists of the converter itself and battery charger. Transformer subsystem consists of throttle, filter and transformer, an operation of which are mandatory. Electrical network of the traction system consists of cable buses, circuit diagrams and cables. Branches of the tree in Fig. 6 include functions, failure modes and effects of failure, structured and articulated in order to eliminate or reduce the omissions. The failure probability for each element in Fig. 6 is described detailed in Table 1 [14].
The relationship between components is established ac-cording to the schematic diagram of the traction system. In this calculation, the failure of one engine from each motor pair is allowed. However, modern high-speed trains are equipped with an automatic control system, that will determine on site the possibility of exploitation after the failure of any component.
V. CALCULATION OFSYSTEMRELIABILITY WITH
SOFTWARE
A. Calculation of Traction System Reliability
[image:3.595.50.290.95.256.2]Container of Traction Converter Subsystem Bu se s Ca bl es Electrical Network Subsystem Traction System El ec tr ica l N et w or k Transformer Subsystem Ca pa cit or Fil te r Im pu ls e Inv er te r Ba tt er y Ch ar ge r Br ak ing R es ist or Fo ur -q ua dr an t Co nt ro lle r Th ro tt le Co nv er te
r Pre-ch
ar gin g De vic e Tr ac tio n Mo to r Container of Traction Converter N2 Container of Traction Converter N1 Traction Motor Block Tr ac tio n Mo to r Ca pa cit or Im pu ls e Inv er te r Br ak ing R es ist or Fo ur -q ua dr an t Co nt ro lle r Pr e-ch ar gin g De vic e Tr ac tio n Mo to r Traction Motor Block Tr ac tio n Mo to r Tr an sf or me r Conventer Block
Container of Traction Converter Subsystem Bu se s Ca bl es Electrical Network Subsystem Traction System El ec tr ica l N et w or k Transformer Subsystem Ca pa cit or Fil te r Im pu ls e Inv er te r Ba tt er y Ch ar ge r Br ak ing R es ist or Fo ur -q ua dr an t Co nt ro lle r Th ro tt le Co nv er te
r Pre-ch
[image:4.595.52.288.71.207.2]ar gin g De vic e Tr ac tio n Mo to r Container of Traction Converter N2 Container of Traction Converter N1 Traction Motor Block Tr ac tio n Mo to r Ca pa cit or Im pu ls e Inv er te r Br ak ing R es ist or Fo ur -q ua dr an t Co nt ro lle r Pr e-ch ar gin g De vic e Tr ac tio n Mo to r Traction Motor Block Tr ac tio n Mo to r Tr an sf or me r Conventer Block
Fig. 6. A Simplified Diagram of the Researched Traction System
TABLE I
MEANINGS OF COMPONENTS FAILURE PROBABILITY
Component Failure Probabilityλ
Battery Charger 3×10⁻⁶fail/hour Impulse Inverter 7×10⁻⁵fail/hour Capacitor 3.9×10⁻⁶ fail/hour Braking Resistor 0.24×10⁻⁶fail/hour
Filter 0.27×10⁻⁶fail/hour Electrical Network 8×10⁻⁶fail/hour
Buses 3×10⁻⁶fail/hour Cables 3×10⁻⁶fail/hour Converter 6×10⁻⁵fail/hour Transformer 0.22×10⁻⁶fail/hour
Throttle 0.3×10⁻⁶ fail/hour Pre-charging Device 8.7×10⁻⁵ fail/hour Traction Motor 123×10−5fail/hour Four-quadrant Controller 9.3×10⁻⁵ fail/hour
and complex plants. TARAS is a continuous simulator based on the Montecarlo technique [15, 16]. The software can model the operation of a complex system, in order to determine the integral parameters of:
- Availability; - Reliability; - Failure probability.
Components of the system are supposed to have a known ”global” value of the failure rate, and known parameters of maintenance and failure modes features [17]. TARAS allows expressing every fault and maintenance event associated with each component of the system under study. Fault event is any component failure that could compromise the functionality of the entire system.
Maintenance is any suspension of the components func-tionality carried out under special conditions to ensure proper operation of the system in the future. TARAS allows modelling the system using a hierarchy of components, assemblies, and subassemblies expressed by an operational tree, whose root is represented by the system itself and whose leaves are represented by the elementary components.
A calculation of the researched traction system in the software of TARAS has been done as follows.
First, all relationships between the elements (Fig. 6) and the corresponding failure probability values (Table 1) have
been entered as the initial data in the TARAS software. Secondly, for each element was set a failure rate (as described in Table 1), redundancy (if necessary), mean time to failure, mean time to repair, a priority of the component, frequency of maintenance and frequency of failure, and other parameters .
The time before scheduled maintenance is determined from the calculation that the required run level is 2000000 km, the average train speed is 150 km/h, the rounded time value is assumed to be 13000 hours. MTTR refers to the time it takes to troubleshoot a problem or replace an item. In this calculation, for an electrical network, we assume the value 2 hours, for the remaining elements of the system it will not exceed - 72 hours.
B. Results of Calculation
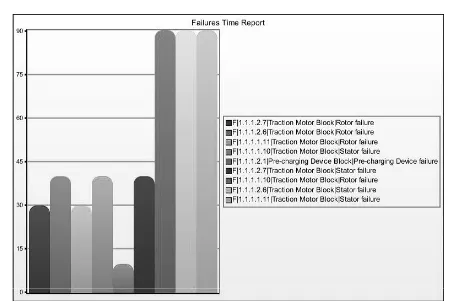
[image:4.595.317.537.327.471.2]The probability of failure of the traction system during the time between the commissioning of the train and planned maintenance has resulted in 4.46%, which is equal to 580 hours of suspended operation time. This is significantly less than planned maintenance time for this type of trains.
Fig. 7. Failure Events Graphics
Fig. 8. Failure Time Graphics
[image:4.595.312.537.516.667.2]With respect of this analysis a set of recommendations will be provided to JCS ”Russian Railways” to pay specific attention to the state of the motors and perform additional preventive maintenance. Thus, it will be possible to check the state of the motors and other equipment during the planned maintenance (which is not included in total operating time) and significantly lower calculated suspended operation time.
VI. CONCLUSION
The review of reliability principles in this article shows the importance of conducting a comprehensive analysis of the failure of all high-speed train units. In the article a traction system was selected for analysis. The calculation was performed in TARAS software, using failure modes and effects analysis. Initial statistical data for the analysis of failure rates of various components of the system was provided by experts in the railway sector. A specific model of the traction system has been developed and used for further calculations. The calculation has resulted in a total failure rate of the system equal to 4,46% or ca 580 hours of suspended operation of the train. Also, it was identified that the most vulnerable element of the traction system is a backed up traction system motor. Basing on these outcomes a set of recommendations has been made in order to increase the performance efficiency of the high-speed trains, such as if possible perform a triple backup of the traction motor, or perform additional maintenance to the traction motor during planned checks and inspections in order to further decrease failure rate and lower train operation-suspended time. This is significantly important with respect to the national plans of development of high-speed railway system in Russia.
REFERENCES
[1] R. D. Knowles, “Transport shaping space: differential collapse in timespace,”Journal of transport geography, vol. 14, no. 6, pp. 407-425, Nov. 2006
[2] D. Banister and M. Givoni, “High-speed rail in the EU27: trends, time, accessibility and principles,”Built Environment, vol. 39, no. 3, pp. 324-338, Nov. 2013
[3] M. Givoni, “Development and Impact of the Modern Highspeed Train: A Review,”Transport reviews, vol. 12, no. 2, pp. 407-425, Sep. 2006. [4] O. Golubchikov, “Urban planning in Russia: towards the market,” European Planning Studies, vol. 14, no. 6, pp. 229-247, Mar. 2004. [5] T. Thurner and M. Gershman, “Catching the runaway train innovation
management in Russian railways,”European Planning Studies, vol. 9, no. 3, pp. 158-168, Mar. 2014.
[6] A. Ushakov, “Modernization of Oktyabrskaya Railway (Moscow-St. Petersburg-Helsinki) as a showcase of improvement of the transport and logistics infrastructure on the Russian railways,” TTS Technika Transportu Szynowego, vol. 23, 2016.
[7] E.M. Razumovskaya, L.V. Lapidus, T.S. Mishakin and M.L. Popov, “Features and peculiarities of the Russian passenger rail market devel-opment,”Mediterranean Journal of Social Sciences, vol. 5, no. 18, pp. 165, Aug. 2014.
[8] R. Pittman, o. Diaconu, E. ip, A. Tomov, J. Wronka, “Competition in freight railways: ”above-the-rail” operators in Central Europe and Russia,”joclec, vol. 3, no. 4, pp. 673-687, Oct. 2007.
[9] G. Rider, S. Milkovich, D. Stool, T. Wiseman, C. Doran, X. Chen, “Quantitative risk analysis,”Injury control and safety promotion, vol. 7, no. 2, pp. 115-133, Jun. 2000.
[10] R. R. Mohr, “Failure modes and effects analysis,”E Jacobs Sverdrup, Feb. 2002.
[11] C. Dullinger, W. Struckl W, M. Kozek, “Simulation-based multi-objective system optimization of train traction systems,” European Planning Studies, vol. 72, pp. 104-117, Mar. 2017.
[12] T. Kaneko,M. Shimada, S. Kujiraoka, T. Kojima, “Easy maintenance and environmentally-friendly train traction system,“ Hitachi Review, vol. 53, no. 1, pp. 15-19, Feb. 2004.
[13] D. Levinson, J.M. Mathieu, D. Gillen and A. Kanafani, “The full cost of high-speed rail: an engineering approach,“The Annals of Regional Science, vol. 31, no. 2, pp. 189-215, 1997.
[14] S. K. Chen , T.K. Ho, B.H. Mao, “Reliability Evaluations of Railway Power Supplies by Fault-tree Analysis,”IET Electric Power Applica-tions, vol. 1, no 2, pp. 161-172, Mar. 2007.
[15] E. Briano, C. Caballini, P. Giribone, R. Revetria, “Two methodologies to support gas turbine power plant availability estimation: design of experiment and Montecarlo simulation,” 2010WSEAS Transactions of Systems, vol. 9, no 9, Sep. 2010.
[16] L. Damiani, P. Giribone, R. Revetria and A. Testa, “An innovative model for supporting FMEA/FMECA analysis on complex coal fired power plants,”Proceedings of the IASTED International Conference on Modelling, Identification and Control, 2014.
[17] L. Liang, F. Zhao, S. Wang, “A Reliability Evaluation of High Speed Railway Traction Substation Based on the GO-FLOW Methodology,” Indonesian Journal of Electrical Engineering and Computer Science, vol. 12, no 7, pp. 4954-4962, Jul. 2014.