Abstract— This paper aims to clarify the importance of
applying the Reliability Centered Maintenance (RCM) methodology on critical systems. RCM is a well-established method in determining and optimizing the preventive maintenance strategies of equipment. The paper shows the importance of having reliable systems in the plant through addressing some case studies, where the number of maintenance orders before and after the implementation of RCM has been remarkably reduced. The associated costs and equipment availability were also observed. The economic benefits out of implementing RCM, the impact of applying RCM, and cost optimization were also demonstrated by presenting four case studies. Appling such reliability tool (RCM) on the critical systems of the plants will enable the organization to ensure the reliability and availability of the equipment in order to achieve the annual production target.
Index Terms— Reliability centered maintenance, Maintenance cost, System availability, Failure mode, Maintenance strategy.
I. INTRODUCTION
LANING
Manuscript received December 27, 2019.
A. A. Bubshait is with King Fahd University of Petroleum & Minerals, Dhahran, Saudi Arabia (phone: 966 13 8603709; e-mail: bushait@ kfupm.edu.sa).
A. Basurrah is a graduate student King Fahd University of Petroleum & Minerals Dhahran, Saudi Arabia (e-mail: [email protected]).
II. LITERATURE REVIEW A. What is RCM
Abdulaziz A. Bubshait, Member, IAENG and Alawi Basurrah,
B. Criticality assessment
Criticality analysis is an important tool that provides valuable information for decisions about work priority, justifying resources to develop reliability strategies. Instead of hoping asset availability and reliability will improve by spending money and time on them, use criticality analysis to ensure resources are being spent in the most efficient way [1, 3, and 7]. In industrial plants, including the sudden failure of critical equipment can lead excessive loss in production output. Hence it will be most economical to predict the failure period of the critical equipment so as to proactively plan and schedule maintenance activities [8].
Plant, usually, composed of many types of equipment. Combination of equipment together forms a system. The systems in the plant have different level of importance. So, it is very important to decide which system to conduct the RCM study on. Deciding which system to study depends on different factors that will identify the criticality of each system. Usually, in a well-developed plant there is a clear guideline to define the criticality of the systems using the risk matrix guidelines. A Risk Matrix is a matrix that is used during Risk Assessment to define the various levels of risk as the product of the harm probability categories and harm severity categories. This is a simple mechanism to increase visibility of risks and assist management decision-making [9]. The following are the elements of a risk matrix.
Consequence Categories: There are five consequences categories that can be used to assess the impact of a risk. 1) Financial, 2) Reputation 3) Operational or Production Loss 4) Health & Safety, and 5) Environmental
Likelihood Scale: The type of scale to be used usually depends on the type of risk being frequency. Figure 2 shows the likelihood scale as L1, L2, L3, L4, and L5
Consequence and Likelihood Scoring: The scores of consequence describe the increase in severity of the consequence (C1 to C5) with each level. Similarly the scores of the Likelihood describe the increase in the probability of likelihood (L) with each level.
III. DATA COLLECTION
IV. CASE STUDIES
The number of different maintenance orders (M1): corrective maintenance orders, (M2): breakdown maintenance orders and (M3): planned maintenance orders were analyzed. In addition, the associated costs of the different maintenance orders were analyzed. In general, after implementing RCM recommendations, the number of corrective maintenance orders (M1) and the number of breakdown maintenance orders (M2) are reduced. In the other hand, the number of the planned maintenance orders (M3) increase. The reduction in M1 and M2 orders will have a great impact in optimizing the cost and the generation of M3 orders help in reducing the failures, safe the environment, keep the production continues and sustain the organization reputation. Also, that will help in improving the equipment availability. Four case studies of implementing RCM are presented below.
A. Case study No. 1: RCM and reduction of maintenance orders for Oxygen Supply System
This case study demonstrates the relationship of RCM implementation and the reduction in maintenance requests for oxygen supply system. The daily production of this plant is 650 metric tons, which is equivalent to 2.1 million SAR (one US Dollar = 3.75 SAR) per day. The function of this system is to supply oxygen to Oxygen Mixer System (OMS) continuously for safe mixing of O2 in cycle gas. One of the major equipment covered by this system is a relive valve. If the relive valve opens, this will cause the OMS to shut down which will lead to shut down the complete plant. This system has RL1 with total risk score of 77.
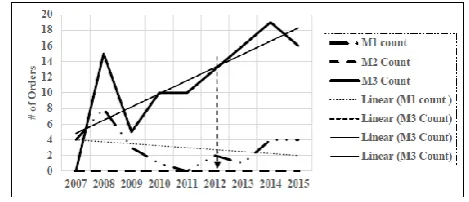
Table 4 shows the number of maintenance orders performed on this system from the year 2007 till the year 2015 associated with the costs of those maintenance orders. Figure 1 shows the trend of the three maintenance orders done on this system before and after the RCM study on 2012.
[image:3.595.315.559.80.187.2]
Table 4: Data for Oxygen Supply System
[image:3.595.311.546.432.533.2]
It is very clear that the number of corrective maintenance (M1) is decreasing with time, which will increase the availability of the system as required. On the other hand, the number of preventive maintenance (M3) increased with time, which is a result of the RCM implementation. For the breakdown maintenance order (M2), no breakdown has been reported for this system since 2007. Although the number of M1 orders decreased with time but a slight increase has been observed since 2011. Corrective maintenance cannot be eliminated totally. In this particular case, the increase in the number of M1 orders is due to implementing one of the RCM recommendations, which is “run to fail strategy”. Such maintenance order will not be registered as M3 order because the date of the failure is not known and there was mitigation at the time of failure. Because it is not planned order, it cannot be registered as M3. In general, the trend of M1 orders is slopping downward whereas the M3 orders trend is slopping upward.
Figure 1: Number of Maintenance orders before & after RCM for Oxygen Supply System
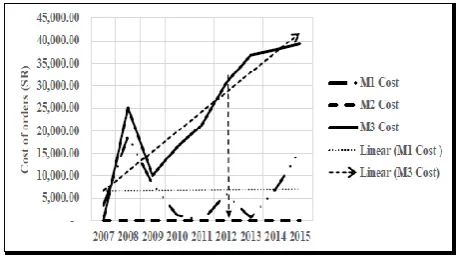
Figure 2 shows the cost related to these maintenance orders. It is very clear that the cost associated with the corrective maintenance orders (M1) is decreasing with time because the number of the M1 orders has been decreased. As stated before, the associated cost started to increase after 2011, which is due to performing the M1 order of “run to fail strategy”.
Figure 2: Cost of Maintenance Order before & after RCM for Oxygen Supply System
In general, the cost for the M1 orders is almost steady throughout the years whereas the cost associated with M3 orders is increasing with the years as seen by the trend line.
B. Case study No. 2: RCM and reduction of Maintenance orders for Neutralization system
This system is used in Utility and Offsite plant. This plant is responsible to feed the other production plants with the utilities required for their production (cooling water, sea water, nitrogen, oxygen, steam…). The criticality assessment for this system is RL 2 with total risk score of 57. Table 5 shows the maintenance data related to this system.
[image:4.595.317.546.220.364.2]The RCM study implemented for this system in 2012 as highlighted in the table. Figure 3 shows the number of maintenance ordered performed on this system starting from 2007 till 2015.
Figure 3: Number of Maintenance Order before & after RCM
It can be observed that the number of the corrective maintenance orders (M1) is decreasing with time especially after the implementation of RCM study on 2011.
It is clearly shown that the number of preventive maintenance orders (M3) is having an increasing trend over the years. Figure 4 shows the trend of the cost along the years. The reduction in the cost of the corrective maintenance orders (M1) is clear, which means that the equipment availability is in a good condition. Also, the increasing trend of the preventive maintenance orders (M3) cost is well justified as that related to the decrease in the number of M1 orders and an increase in M3 orders.
Figure 4: Cost of Maintenance Order before & after RCM
C. Case study No. 3: RCM and maintenance cost
This case study demonstrates the potential saving generated from applying the RCM. Table 6 shows the potential economic benefits of applying RCM in 5 plants. The number of systems covered by RCM study is different from plant to plant.
The first column, “Economic Risk before RCM” represents the risk of these systems if it fails as cost wise according to risk matrix. The systems are with risk level 1 (RL1: major) and risk level 2 (RL2: significant). After implementing the recommendations of RCM study, which might be (choosing the appropriate maintenance strategy, introducing PM, increasing PM, change frequency of PM, do regular inspection) it is important to see how much does these recommendations contribute to the economic risk.
[image:4.595.65.285.620.758.2]will be reduced to the noted value. Then, the percentage of reduction in the economic risk due to implementing RCM study on these specific systems is seen. It is observed that there is a remarkable reduction in all the plants. Figure 5 shows the potential economic benefits of implementing the RCM recommendations for different plants. Although the number of systems is varying from plant to plant but the associated potential economic benefits of RCM is not depending on how many systems covered by the RCM as shown in Table 6.
Figure 5: RCM Potential Economic benefit (SAR) vs. Plants
[image:5.595.59.288.185.301.2]In general, this reduction can be also translated as a shift in moving the risk level of these systems from the risk level 1 (RL1: major) and risk level 2 (RL2: significant) to lower risk levels (RL3: minor or RL4: insignificant).
Figure 6: Economic Risk (SAR) before and after RCM
Figure 6 shows the amount of reduction in the economic risk due to the implementation of the RCM recommendations by year 2015. This will result in saving the maintenance cost, improving the equipment’s reliability and elimination of the unwanted preventive maintenance. The potential economic benefits of RCM will include the followings: a) reduced production losses and maintenance cost (Economic Benefit) b) Increased reliability and up time of an asset c) reduced failure consequences d) improved mechanical integrity, and e) Improved product quality
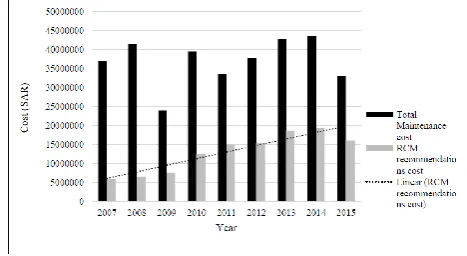
It is important to assess whether the generated RCM recommendations have improve the equipment behavior or reduce the amount of maintenance orders in the plants, which can be translated as the maintenance cost. Table 7 shows a case study conducted in one organization where the total maintenance cost has been collected from five different plants along with the cost of the RCM recommendations.
Figure 7 shows both the total maintenance cost and the cost of the RCM recommendations. It is clearly seen that the cost of implementing the RCM recommendations has an
increasing trend with the years. That will indicate that out of the total maintenance cost, RCM work orders have a quit good percentage of cost directed to the planned maintenance rather than the corrective maintenance and the breakdown maintenance. It also observed that the percentage of the RCM cost contribution to the total maintenance cost that the percentage of RCM recommendation cost is increasing year-after-year
Table 7: Total Maintenance cost to RCM recommendation Cost
[image:5.595.313.547.391.519.2]The increase in the RCM recommendations cost compare to the total maintenance cost indicates the effectiveness of those recommendations in lowering the corrective maintenance orders (M1) and the breakdown maintenance orders (M2) and directing the resources to implement the RCM recommendations.
Figure 7: Total Maintenance cost to RCM recommendation Cost
These systems need some time to become more mature and the benefits will be realized more clearly. If the same manner of applying the RCM continues, the total maintenance cost will decrease and the cost of the RCM recommendations will increase with time.
D. Case study No. 4: RCM and equipment availability
[image:5.595.60.289.403.502.2]The downtime of the equipment cannot be eliminated 100% but it can be reduced significantly by implementing some of the RCM recommendations. By having standby equipment that will help in the event of equipment failure, and the other one will take over, which will reduce the downtime of the equipment in total and result in continuing the operation with minimum interruption.
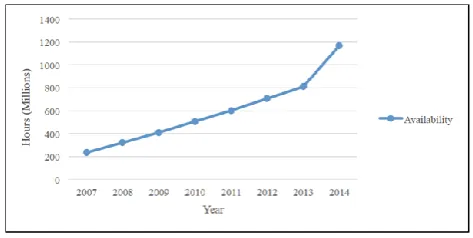
Table 8: Equipment Availability
Also, the right implementation of the RCM recommendations will increase the equipment reliability and that helps in improving the equipment availability.
It is clearly observed that the equipment availability between years 2007 till 2014 has an increasing trend. Figure 8 shows the equipment availability trend through the years having a continuous improvement, which will have a positive impact on the equipment to perform its intended function as required without any interruption. Ultimately, this will be a good support to have continues production of the plant. Keep up the equipment available as required is one of the main objectives of the implementing the RCM recommendations.
Figure 8: Equipment Availability
V. CONCLUSION
As demonstrated in the case studies, there is a good reduction in the number of the corrective maintenance orders (M1). A reduction in the number of corrective maintenance orders (M1) implies that plant experienced less number of failures, which will result in increasing the equipment availability of that system. As a result of the reduction in the number of M1 orders, the associated cost reduced, which gives a clear indication about the impact of applying the RCM in reducing the maintenance cost. It also appears that the number of preventive maintenance orders (M3) has increase for some of the systems after implementing the RCM recommendations. That means the RCM team has recommended doing some of preventive maintenance order (inspection, overhaul, calibration…), which will help in avoiding the failures, discovered during
the FMECA. The associated cost with M3 orders is justified cost as that cost will be reflected on the improvement of equipment condition and service life and eventually in the reliability of the plant. The most important aspect is to eliminate the number of breakdown maintenance orders (M2). That is because whenever there is M2 order means plant is under shutdown, which is usually not preferred and not acceptable by the plant management especially if it is due to not implementing the reliability recommendations. Although the cost associated with M2 orders appears to be very low or even negligible, however, that cost is only for repairing the failed equipment and not representing the total cost due to M2 orders, which lead to shut down the complete plant. RCM will develop recommendations and along with these recommendations, time of the implementation. Usually the time for implementing those recommendations will be coupled with planned shutdown of the plant. So, no process production will be affected and known frequency for doing the maintenance is already identified. One should not think that by implementing the RCM recommendations the risk would be completely eliminated. RCM will help in reducing the risk associated with these systems. The effect of implementing the RCM recommendations has been observed on the number of the maintenance orders (corrective, breakdown and preventive) and the cost associated with it. Also, the risk level of the critical systems has been declined after implementing the suggested RCM recommendations. Plant managements need to implement the RCM methodology on the critical systems as early as possible in order to decide and optimize the preventive maintenance strategies.
ACKNOWLEDGMENT
The authors appreciate the support of King Fahd University of Petroleum & Minerals during the study.
REFERENCES [1] Reliability Centered Maintenance at:
https://en.wikipedia.org/wiki/Reliability-centered_maintenance
[2] Selvik, J.t., and T. Aven. "A Framework for Reliability and Risk Centered Maintenance." Reliability Engineering & System Safety 96.2 (2011): 324-31.
[3] Afefy, Islam H. "Reliability-Centered Maintenance Methodology and Application: A Case Study." Engineering ENG 02.11 (2010): 863-873.
[4] Jaber Hb, Bhd S P Snd (2003): Plant Maintenance Strategy: Key For Enhancing Profitablity available at:
http://www.maintenanceresources.com/referencelibrary/ezine/chemcle
an.htm [Accessed on 10 February 2016]
[5] Wilmeth, Randall G. and Usrey, Michael W. "Reliability-Centered Maintenance: A Case Study." Engineering Management Journal 12.4 (2000): 25-31.
[6] Maintenance Services available at:
http://www.talgo.com/index.php/en/servicio.php
[7] Evaluation Criteria for Reliability-Centered Maintenance (RCM) Processes at: http://standards.sae.org/ja1011_199908/
[8] Kareem, B., and A.o. Jewo. "Development of a Model for Failure Prediction on Critical Equipment in the Petrochemical Industry [9] Risk Matrix. Available at https://en.wikipedia.org/wiki/Risk_Matrix [10] Fore, S., & Msipha, A. (2011). Preventive Maintenance Using
Reliability Centered Maintenance (RCM): A Case Study Of A Ferrochrome Manufacturing Company Maintenance Costs available
at:
[image:6.595.55.292.449.568.2]