NATIONAL ECONOMIC
AND SOCIAL COUNCIL
Benchmarking the
Programme for
Prosperity and Fairness
Following discussion in the Council, this report was prepared by
Dr. Síle O’Connor
February 2002
PUBLISHED BY THE NATIONAL ECONOMIC AND SOCIAL COUNCIL Copies of this Report may be obtained from
THE NATIONAL ECONOMIC AND SOCIAL COUNCIL 1st Floor, Frederick House, 19 South Frederick Street, Dublin 2,
or the Government Publications Sales Office, Sun Alliance House, Molesworth Street, Dublin 2.
Price €15 (£11.80)
MEMBERSHIP OF THE NATIONAL ECONOMIC AND SOCIAL COUNCIL
Chairperson:
Mr. Dermot McCarthy, Secretary General, Department of the Taoiseach and Secretary to the Government
Deputy Chairperson:
Ms. Mary Doyle, Assistant Secretary, Department of the Taoiseach
Government Nominees:
Mr. Paddy Mullarkey Secretary General, Department of Finance
Professor John FitzGerald Ms. Geraldine McAteer Professor Jim Walsh
Mr. John Hurley Secretary General, Department of Finance
Mr. Paul Haran Secretary General, Department of Enterprise, Trade and Employment Mr. Brendan Tuohy Secretary General, Department of
Public Enterprise
Mr. Edmond Sullivan Secretary General, Department of Social, Community and Family Affairs Mr. John Fitzgerald Dublin City Manager, representing the
Local Government Sector
Nominated by Business and Employers Organisations: Mr. Turlough O’Sullivan IBEC
Mr. Brian Geoghegan IBEC Mr. Liam Kelleher CIF Mr. Brendan Butler IBEC
Mr. John Dunne CCI
Nominated by the Irish Congress of Trade Unions:
Ms. Joan Carmichael ICTU Mr. Manus O’Riordan SIPTU
Mr. Peter McLoone IMPACT
Mr. Des Geraghty SIPTU
Nominated by Agricultural and Farming Organisations: Mr. Seamus O’Donohue ICOS
Mr. Ciaran Dolan ICMSA
Mr. Damian McDonald Macra na Feirme Mr. Michael Berkery IFA
Mr. Con Lucey IFA
Nominated by Community and Voluntary Organisations:
Fr. Sean Healy CORI
Ms. Siobhán O’Donohue CWC
Ms. Orla O’Connor NWCI
Mr. Dan Boyle NYCI
Mr. Tony Monks INOU
Secretariat:
Mr. Noel Cahill Economist
Ms. Carmel Corrigan Social Policy Analyst Ms. Ann Marie O’Connor Social Policy Analyst Mr. Colm O’Reardon Economist
Ms. Marie Kinsella Ms. Catherine Colman
Dr. Síle O’Connor was Director of the Secretariat of NESC until May 2001.
Ms. Orla Lane served as an Economist in the Secretariat until July 2001. Ms. Evleen O’Molloy served as Executive Assistant in the Secretariat until early August 2001.
Table of Contents
Page PREFACE . . . iii
ACKNOWLEDGEMENTS . . . iv
INTRODUCTION . . . v
Part I: CONTEXT AND ISSUES IN THE DEVELOPMENT OF BENCHMARKS
1. The Programme for Prosperity and Fairness:
Its Objectives. . . 3 2. Benchmarking and the Identification of Indicators 7
3. Programme for Prosperity and Fairness:
Frameworks and Policy Dimensions. . . 15
Part II: BENCHMARKING PROGRESS ON THE
PROGRAMME FOR PROSPERITY AND FAIRNESS
4. Improving Living Standards and
Workplace Environment . . . 25 5. Improving Prosperity and Achieving
Economic Inclusion. . . 35 6. Achieving Social Inclusion and Equality . . . 51 7. Ensuring Successful Adaptation to
Continuing Change . . . 73
Part III: MONITORING PROGRESS ON POLICY OBJECTIVES
8. Monitoring Progress on the Programme for Prosperity and Fairness: Summary and
BIBLIOGRAPHY . . . 111
APPENDIX 1 . . . 115
PREFACE
This report on Benchmarking the Programme for Prosperity and Fairness is one of two reports which the National Economic and Social Council has prepared on foot of mandates in the Programme for Prosperity and Fairness. The other is National Progress Indicators for Sustainable Economic, Social and Environmental Development. These exercises fit with the Council’s commitment to enhance evidence-based policy making. This is also reflected in its recent Review of the Poverty Proofing Process. The concern with improving information for policy and measuring progress on key indicators is part of a wider interest in the development of indicators for the assessment of progress as reflected in the Regulatory Reform Unit to be established in the Department of the Taoiseach on foot of the OECD (2001) report, the development of indicators for the revised National Anti-Poverty Strategy, the European Commis-sion’s work on structural indicators (European Commission, 2000), and the EU Social Protection Committee Sub-Group on Indicators and the Belgian EU Presidency work on social indicators. The Council considers that the outcome of these initiatives is likely to contribute to the further development of indicators tailored to the Irish policy context.
The indicators in this report differ from those in the Progress Indicators report in being explicitly formulated to measure progress on commitments made in the Programme for Prosperity and Fairness. The work undertaken and the results presented here in the form of indicators and benchmarks are merely the first step in a process that must involve the evaluation of the information presented and the revision, replacement and augmentation of the set of indicators where appropriate. While these processes must take account of, and achieve consistency with, indicators developed at the EU level they must be appropriately adapted to the Irish policy context and to the measurement of change over time as well as in cross-national context.
ACKNOWLEDGEMENTS
Following discussions in the Council, this report was prepared by the Council’s secretariat. The work of drafting the report was largely undertaken by Dr. Síle O’Connor, who served as Director of the Council until May 2001, and who continued working on the report thereafter. Substantial work on the report was also undertaken by Ann Marie O’Connor
The preparation of this report was facilitated by the assistance of individuals in several government departments and organisations. Officials in the Department of Finance and the Department of Social Community and Family Affairs, in the Central Statistics Office, the National Competitiveness Council and the Environmental Protection Agency provided essential information. The Council and the Secretariat are pleased to acknowledge this cooperation.
INTRODUCTION
This report presents a set of indicators and the associated data for benchmarking progress on the key policy objectives of the Programme for Prosperity and Fairness (PPF) agreed by the Government and social partners to cover the period 2000-2002. The context for this exercise by the Council is the recognition that such indicators and data are essential foundations of evidence-based decision making. This recognition is not confined to the Council. It is reflected in recent initiatives by the European Union (Commission of the European Communities, 2000) and the OECD (1997) and in Ireland by the Annual Competitiveness Reports (National Competitiveness Council, 1998, 1999 and 2000) and the commitment to develop indicators across the thematic areas of the revised National Anti-Poverty Strategy.
The present exercise is unique in being formulated explicitly to develop indicators to benchmark progress in the key elements of the Operational Frameworks of the PPF as mandated in paragraph 5.3 therein.1This means that it is broadly focused and explicitly policy-linked. There may be other exercises in train, or envisaged, that provide a more in-depth set of indicators relating to particular areas. The focus of this exercise is to provide a balanced range of indicators to measure progress on the range of policy objectives represented by the Operational Frameworks of the PPF and encompassing economic, social and environmental dimensions of policy. The fact that the PPF provides the parameters within which this exercise is undertaken is a constraint in terms of scope, but it has the major positive consequence of ensuring policy linkage and relevance.
The practice of developing indicators and of benchmarking progress has generated considerable interest over the past decade on the part of inter-governmental organisations such as the UN, in its annual Human Development Report, which has been published since 1990. The OECD (1997) and the European Commission (1996) have produced widely-cited benchmarking reports on competitiveness as
have national governments, for example, the Netherlands (Ministry of Economic Affairs, 1997) and Ireland (National Competitiveness Council, 1998, 1999, 2000). Organisations such as the World Economic Forum (1997), the International Institute for Management Development (1997), and UNICE (1998), amongst others, have made several contributions to the benchmarking of competitiveness. The rationale for this activity is outlined by the OECD in its argument that “globalised firms tend to locate their activities where they can be carried out in the most effective and productive way. In the global economy, such environments have become a major determinant of location and investment decisions by both local and multinational firms, and they affect both employment and income generation” (OECD, 1997: 11). Reflecting the recognition that competitiveness cannot be effectively conceived or measured in a vacuum the focus has broadened considerably of late, and now several initiatives are directed to the identification of indicators relating to economic, social and environmental dimensions of policy, all of which impact on competitiveness but have a broader relevance in the assessment of progress towards prosperity and fairness.
The most significant of the recent developments in this area is the European Union’s proposal on structural indicators to measure progress towards the implementation of the Lisbon strategy which is aimed at transforming the European Union into “the most competitive and dynamic knowledge-based economy in the world capable of sustainable economic growth with more and better jobs and greater social cohesion.” (Commission of the European Communities, 2000a: 2). The conclusion of the Lisbon Council called for indicators in four policy domains: employment, innovation, economic reform and social cohesion. Following this mandate, the Commission proposed twenty-seven key indicators and five general economic background indicators. In Section 6 we consider the headline and background indicators developed in this report with reference to those proposed by the European Commission.
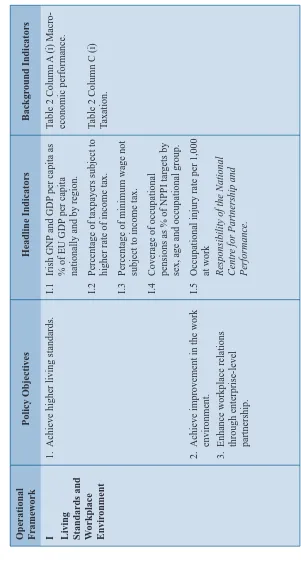
the context and key issues in the development of benchmarks. The objectives of the PPF and key issues arising in benchmarking progress on these are outlined in Chapter 1. In Chapter 2, the criteria for the identification of indicators are discussed. Chapter 3 uses the PPF operational frameworks as the organising structure to outline the set of indicators to benchmark progress. Headline indicators are linked to the operational frameworks, key objectives of the programme and to background indicators (Table 3.1). These background indicators are linked to key policy dimensions and to specific commitments in the PPF (Table 3.2). Part II is concerned with the actual benchmarking of progress on the PPF and is comprised of four chapters, one on each of the PPF operational frameworks. In each chapter, the specific indicators and the associated data are discussed. Progress over time and comparatively on the headline indicators is outlined and data relating to 2000, or the most recent available, are identified as benchmarks against which progress can be measured.
Part III is concerned with summarising the key issues arising from the analysis and the measurement, sources and data issues arising from the report. Chapter 8 summarises the key issues and recommendations arising from the analysis. A summary of key data issues and actions necessary to improve the data situation are presented in Chapter 9. In addition, the PPF indicators are considered with reference to the list of structural indicators outlined by the EU Commission.
Part I
Context and Issues
in the Development
CHAPTER 1
THE PROGRAMME FOR PROSPERITY AND
FAIRNESS: ITS OBJECTIVES
The Programme for Prosperity and Fairness (PPF) incorporates a wide range of objectives ranging from an overarching level such as ‘the achievement of higher living standards’, ‘underpinning Ireland’s competitiveness’ and ‘reducing poverty and social exclusion’ to objectives relating to particular policy dimensions, for example, reviewing ‘the targets under the original NAPS frame-work’ and institutional development in particular areas. It is presented in five Operational Frameworks as follows:
I. Living Standards and the Workplace Environment; II. Prosperity and Economic Inclusion;
III. Social Inclusion and Equality;
IV. Successful Adaptation to Continuing Change; and V. Renewing Partnership.
progress on related sets of indicators that broaden the context within which the headline indicators are interpreted. Their selection is also based on their relevance to measuring progress on commitments made in specific clauses of the PPF. These background indicators are in turn linked to key policy dimensions: economic, socio-economic, distribution/equity and environmental. These four dimensions of policy reflect the fact that sharp divisions between social and economic policy objectives and consequences are not realistic. For example, labour market, family-friendly and educational policies are relevant to economic and social inclusion and to each of the operational frameworks of the PPF.
It is important to bear in mind in reading this document that both sets of indicators relate to elements of the PPF. Their purpose and utility should be judged in terms of their effectiveness in measuring progress on policy objectives outlined in the PPF. However, because of the encompassing nature of that programme and its focus on central economic and social issues the Council believes that the headline indicators have a relevance that will outlast its time frame and should inform ongoing policy development. This does not mean that the indicators are final and unchanging. It is anticipated that they will be supplemented and some replaced as the policy context alters. In Chapter 9 the Council makes suggestions about the improvement of data sources and timeliness.
Two questions may be posed about this exercise: Firstly, why develop indicators against which progress on the objectives of the PPF or any policy initiative can be benchmarked? There is
PPF Operational Frameworks (overarching policy objectives)
|
Key policy objectives |
Headline
— Background — Policy
Indicators Indicators dimensions
|
considerable evidence that widespread dissemination of information on progress as measured by taken-for-granted economic indicators has contributed to public policy debate and helped the formation of a national consensus on policy choices relating to key economic issues. If we are to accord equal status to social inclusion, employment and competitiveness, and to recognise the linkages between them as Partnership 2000 for Inclusion, Employment and Competitiveness and the Partnership for Prosperity and Fairness imply, we need to consider a broader range of indicators, a range that covers all of these aspects. Secondly, why are social and environmental indicators essential dimensions of a true analysis of progress? Apart from the importance of particular themes and policies in the broad social and environmental policy areas, there has been recognition for several decades that GDP per capita and associated measures do not capture the full dimension of development or of living standards. Much of the critique of GDP-type measures has come from those involved in analysis of developing countries, but since the 1960s there has been increased criticism emanating from analysts of industrialised countries and those concerned with the issue of sustainability. There is now clear evidence that traditional economic indicators do not provide a full picture of progress or development. Such a picture must encompass social, economic and environmental indicators. But, as with the economic indicators, it is important that the focus be selective rather than exhaustive. The key is to achieve a balance across social, economic and environmental dimensions of policy. Such a broader range would ideally come to enjoy equal status with taken-for-granted macro-economic indicators in terms of public literacy. This would allow a focus on public policy decision through a more encompassing lens than is the case at present. It would help to create the conditions for more informed and broadly focused debate on policy options and choices.
CHAPTER 2
BENCHMARKING AND THE IDENTIFICATION
OF INDICATORS
The distinction between benchmarking progress on key policy objectives and monitoring implementation of policy is important. The focus of benchmarking progress is on identifying indicators related to overarching policy objectives rather than concern with the implementation of specific policy initiatives. These indicators facilitate the monitoring of progress provided they are pitched at an appropriate level to ensure their relevance to overarching policy objectives over an extended period, and that the data are adequate both longitudinally and comparatively.
In this chapter we consider the identification of indicators and associated data, issues involved in the adoption of a comparative focus, the appropriateness of GNP and GDP for the measurement of policy effort, and balance in the interpretation of indicators.
2.1 IDENTIFICATION OF INDICATORS
measurement. Within the context of this selective approach, the criteria for the identification of indicators are:
(i) linkage to the overarching objectives of the PPF and policy relevance;
(ii) the achievement of balance across frameworks and across social, economic and environmental dimensions of policy; and (iii) amenability to operationalisation and data availability or
potential availability.
2.1.1 Selectivity Focusing on Indicators Linked to Key Objectives
contradictions in terms of desired policy outcomes implicit in the set of indicators is an important consideration in selecting indicators. Where such contradictions are unavoidable because of particular policy commitments they are highlighted and must be taken into account in any assessment of progress. Finally, it must be borne in mind that all indicators are summary measures that should be interpreted within a broader policy context. The objective is to get an overarching view of progress rather than an exhaustive measure of every aspect of the PPF.
2.1.2 Adherence to the Principle Of Balance across
Operational Frameworks and across Economic, Social and Environmental Indicators
The core objective of this project is the achievement of balance in the benchmarking of progress across the first four operational frameworks recognising the need for balance within frameworks in terms of the objectives pursued. The fifth operational framework is primarily about institutional development. Balance in this context does not refer to numerical balance but to the recognition that there is an interaction between economic, social and environmental developments and that each dimension must be reflected in the range of indicators chosen if progress on overarching public policy objectives is to be effectively benchmarked.
2.1.3 Ensuring the Availability of Appropriate Data for Benchmarking Progress on Elements of the PPF
The monitoring of progress is dependent not only on rigorously defined indicators but also on the appropriateness of the data used to specify these indicators. The integrity of the entire process of benchmarking progress is dependent on agreement on the relevance and validity of the indicators and associated data. The most desirable categories of data from the point of view of measuring progress are those relating to outcome, output and input of resources, in that order, but data relating to policy outcomes are rarely available. The focus at this stage is on the identification of quantitative indicators that are clearly reliable measures of what they purport to represent, have policy relevance and can be measured through appropriate data. High quality and reliable data must be available or its achievement attainable within the foreseeable future and ideally within the lifetime of the PPF. This does not preclude identification of the most appropriate indicators and suggestions as to how the relevant data might be obtained. The relative emphasis on quantitative and qualitative indicators in research is often contentious. It is sometimes assumed that qualitative measures are inherently less reliable than quantitative ones. On the other hand, it is argued that only qualitative indicators can capture the uniqueness and complexity of public policy progress in any one period or location. Neither argument is inherently true; the issue is one of appropriateness for the task at hand. Qualitative indicators do not lend themselves to the type of benchmarking being undertaken in this project.
by gender, age, socio-economic group and region is of crucial importance in assessing progress in some policy areas. In Chapter 9 and Tables 9.1 and 9.2, data quality and availability are considered in relation to each of the indicators identified. Recommendations are made relating to the improvement of data availability.
2.2 A COMPARATIVE FOCUS
Benchmarking progress implies comparison over time and cross-nationally. However, cross-national comparisons have to be interpreted with caution. Such comparison would be seriously misleading if differences across countries in the quantum of relevant factors were not taken into account. For example, outlays on pensions and health care must take into account differences in the size of the old-age population. Similarly, the nature of provision – public, private and/or voluntary – and the classification of expenditure are important considerations in judging comparability. Cross-national comparison brings into focus not only the issue of comparability of data but the vision of the kind of society for which we wish to strive. When we move beyond broad comparisons, for example of our location within the European Union, decisions on which societies are appropriate comparators are complex. These decisions are to a significant extent influenced by an explicit or at least implicit acceptance that the policy frameworks, or at least part of them, are ones that are appropriate to our circumstances, in the sense of providing ‘best practice’ exemplars in particular areas. Yet, as was pointed out in the Council’s last strategy document, Opportunities, Challenges and Capacities for Choice, this does not imply replication of any particular policy model. It does imply acknowledgement of standards against which progress can be measured and towards which aspirations can be directed. How the standards are met depends on unique national conditions and policy choices (NESC, 1999: 76).
examination of performance is to be undertaken. For example, it is relevant to consider Ireland’s location vis-à-vis its competitors, not only for trade but also for FDI.1 But these are not the most appropriate comparators for all aspects of policy.2 The optimum approach is to decide on a broad comparative focus to locate Ireland and then concentrate analysis on the most relevant subset of countries based on policy comparability and social and economic context in relation to particular policy areas. In this report the practice adopted is to present the EU average and the findings for the UK, the Netherlands and Denmark. The UK is considered relevant because of the still significant trading relationships and the historical influences on particular policy areas, for example, social benefits and services. The Netherlands and Denmark were selected as smaller EU countries both of which have social partnership arrangements, although these are quite different in structure from the Irish arrangements. They are selected as illustrative cases rather than models to be replicated.
2.3 GNP AND GDP IN MEASURING PROGRESS AND COMPARING EFFORT
An issue of crucial significance in making comparisons of Irish performance with that of other EU and OECD countries is the relatively greater difference between GNP and GDP in Ireland. Because of the size of the foreign direct investment (FDI) in Ireland and the associated repatriation of profits there is a significant difference between GNP and GDP in Ireland. No EU country and only one OECD country, New Zealand, approximates the
1 The Annual Competitiveness Report situates Ireland relative to thirty other countries, mostly OECD but also including Russia, Poland and Hungary. Its comparative analysis in 1999 concentrated on the most relevant subsets of these in presenting an assessment of competitiveness in the UK, Hungary and the Nordic countries. The 2000 analysis is organised around critical competitiveness priorities identified by the Council. Ireland’s relative location and its improvement or disimprovement in ranking on these criteria are identified.
magnitude of the Irish difference between GNP and GDP. This is recognised by the OECD in its economic surveys:
The concentration of economic activity in multinational high-tech companies and the relatively high level of external debt means that GDP, the normal indicator of output, overstates both the level and growth of Irish incomes. The level of GNP, a more appropriate level of income, was over 12 per cent less than GDP in 1995, while its increase was about one-half percentage point less than the GDP in the five years ending 1995 (OECD, 1997: 18).
In 2000 GNP was 16 per cent less than GDP (Central Statistics Office, 2001: Tables 5 and 6).
In view of the difference between GNP and GDP in Ireland and the fact that GNP represents the resources available for redistribution, it is the appropriate base for the measurement of progress in several of the indicators used in this report. In recognition of the fact that EU, OECD, ILO and UN publications use the standard GDP base for expenditure comparisons for all countries including Ireland, the relevant GDP figures are presented in footnotes.
2.4 INTERPRETATION OF INDICATORS
CHAPTER 3
THE PROGRAMME FOR PROSPERITY AND
FAIRNESS: FRAMEWORKS AND POLICY
DIMENSIONS
As outlined in Chapter 1, the PPF is presented as five operational frameworks that summarise the following overarching objectives: ● achieving higher living standards and improving the workplace
environment;
● underpinning prosperity and increasing economic inclusion; ● increasing social inclusion and equality;
● successfully adapting to continuing change; and ● renewing Partnership.
I Living Standards and Workplace Envir
onment
1.
Achieve higher living standards.
2.
Achieve improvement in the work environment.
3.
Enhance workplace relations through enterprise-level partnership.
T
able 2 Column
A
(i)
Macro-economic performance. Table 2 Column C (i) Taxation.
I.1
Irish GNP
and GDP
per capita as
% of EU GDP
per capita
nationally and by region.
I.2
Percentage of taxpayers subject to higher rate of income tax.
I.3
Percentage of minimum wage not subject to income tax.
I.4
Coverage of occupational pensions as % of NPPI tar
gets by
sex, age and occupational group.
I.5
Occupational injury rate per 1,000 at work Responsibility of the National Centr
e for Partnership and
Performance.
Operational
Policy Objectives
Headline Indicators
Backgr
ound Indicators
Framework
T
ABLE 3.1
Programme for Prosperity and Fairness:
Overar
[image:27.595.157.458.141.705.2]II Pr
osperity and
Economic Inclusion III Social Inclusion and Equality
1.
Underpin Ireland’
s
competitiveness.
2. Use increased prosperity to enhance
our quality of life in the context of a fairer and more inclusive society
.
1. Reduce income poverty and social
exclusion.
T
able 2 Column
A
(ii)
Competitiveness. Table 2 Column B (i) Labour Market. Table 2 Column
A
(ii)
Competitiveness. Table 2 Column D Environment. Table 2 Column
A
(iii)
Infrastructure. Table 2 Column C (iii) Housing. Table 2 Column C (ii) Income Adequacy
.
II.1
Productivity (annual % change).
II.2
Employment (annual % change).
II.3
R&D Expenditure as a % of GDP
.
II.4
Emission of basket of greenhouse gases relative to Kyoto limits (64,253,000 tonnes CO
2
equivalent).
II.5
Infrastructure investment per capita. PROXY
:
T
ransport
infrastructure investment per capita.
II.6
Housing unit stock and completions.
III.1
‘Consistent Poverty’
- relative
income poverty combined with basic deprivation measure (below 50% and 60% threshold).
III.2
Relative income poverty - % of households below 40%, 50% and 60% low income thresholds.
III.3
Social welfare payments as % of adequacy benchmark.
[image:28.595.137.464.141.689.2]IV Successful Adaptation to Continuing Change
2. Improve the health status of the
population.
1.
Create a framework to facilitate lifelong learning.
2. Create a society in which access to
the labour market is open to all.
3. Develop high quality childcare and
family friendly policies.
4. Create a framework for the further
development of the Information Society
.
5. Promote Ireland’
s role in the
international community
.
6.
Promote Nth/Sth Partnership
III.4
Disability-adjusted life expectancy (DALE) at birth and age 60.
IV
.1
Percentage of 25-44 and 45-64 age Groups in continuing education and
T
raining
IV
.2
Employment rate: Male/Female
IV
.3
Number of Childcare Places per 1,000 children aged 5 years and under (pre-school) and 6 to 15 years (after
-school).
IV
.4
Percentage of workers in the ICT Sector
IV
.5
Net Of
ficial Development
Assistance (ODA) as a percentage of GNP
.
Responsibility of North/South bodies
T
able 2 Column C (iv)
Health. Table 2 Column B (iii) Education. Table 2 Column B (i) Labour Market. Table 2 Columns B (i) Labour Market and B (iii) Family friendly policies. Table 2 Column
[image:29.595.128.457.144.687.2]A(i) Macr oeconomic Performance (2.1) A.1 GNP % change. GDP % change. A.2 GNP
per capita % change.
GDP
per capita % change.
A.3
GNDI per capita % change.
A.4 Inflation. A.5 Budget Deficit/Surplus. A.6 Debt/GNP; Debt/GDP . A (ii) Competitiveness (2.1) A.7
FDI inflows as % GNP
and
GDP
.
A.8
New permanent jobs in foreign-owned companies assisted by State agencies by region.
A.9
T
otal Investment as % GNP
and GDP . B (i) Labour Market (2.1) B.1
Unemployment % of the Labour Force.
B.2
Long-term unemployment as % of the labour force.
B.3
Part-time employment as % of labour force: male and female.
B (ii)
Family-friendly Policies (1.3, Annex
IV
and
4.3)
B.4
Percentage of workers in enterprises adopting family- friendly practices such as job-sharing, work-sharing, part-time work, flexitime, flexi-place/teleworking and term-time working.
B.5
Employment rate for men and women aged 20-44 with and without a child aged 0-5.
C (i)
T
axation (1.1)
C.1
T
ax receipts as % of GNP
& GDP
.
C.2
A
verage tax rates.
C.3
Mar
ginal tax rates.
C.4
The tax wedge.
C (ii)
Income
Adequacy (3.2)
C.5
Social Protection as % of GNP
& GDP
.
C.6
Income Inequality: Share of top to bottom 10% of population, share of top to bottom 20% of population and Gini Coef
ficient.
C (iii)
Housing (2.9 and 3.7)
C.7
Housing af
fordability
indicator - % of gross income spent on housing.
D.
Envir
onment
(2.13)
D.1
Household and commercial waste (tonnes p.a.).
D.2 W aste Management: ● Recycling % ● Landfill % D.3 Drinking W ater
Quality – compliance rates for coliforms: ●
[image:30.595.177.467.139.703.2]Public Supplies ● Group Schemes D.4 River W ater Quality . A. ECONOMIC B. SOCIO-ECONOMIC C. DISTRIBUTION/EQUITY D. ENVIRONMENT T ABLE 3.2 Backgr
ound Indicators for the
Programme for Prosperity and Fairness
Linked to Key Dimensions of Policy
A.10 Nominal Unit labour cost (annual average % change).
A.1
1
Manufacturing Export Diversification by Country and Sector
.
A.12
Business Investment in R&D.
A.13
Government Appropriations and Outlays on R&D as a proportion of GDP
. A (iii) Infrastructur e (2.3) A.14 Road infrastructure. A.15 Rail infrastructure. A (iv)
Information Society (4.4)
A.16
Percentage of ICT
-related
exports.
A.17
Internet hosts and on-line users per 1,000 population.
A.18
Percentage of schools linked to high-speed networks.
A.19
IT
graduates as a % of all
graduates.
B (iii)
Education (2.1/3.1 and 4.1)
B.6
Percentage of population (25-64) that has attained at least upper second-level education and sub-groups within this.
B.7
Percentage of adults at each literary level: ●
Prose ● Document ● Quantitative B.8
Percentage of junior cycle entrants who completed upper second-level, percentage who completed school at lower second-level and percentage who left with no qualifications.
B.9
Net enrolment in tertiary education (18-21).
C.8
Housing quality indicator
. C.9 Local Authority waiting lists. C (iv)
Health (1.4.3 and 3.10)
C.10
Infant Mortality (Rate per 1,000 live births).
C.1
1
Life Expectancy at birth, 40 and 65 years: Male and Female.
C.12
Health Expenditure as % GNP
& GDP: Public and
Private.
C.13
Percentage of Health Expenditure on Primary/Community Care.
C.14
In-patient hospital waiting lists
D.5
A
verage time in
minutes-per
-day
commuting to and from work.
D.6
Buses, coaches and cars per 1,000 population.
A. ECONOMIC
B. SOCIO-ECONOMIC
C. DISTRIBUTION/EQUITY
3.1 OPERATIONAL FRAMEWORKS, POLICY OBJECTIVES AND INDICATORS
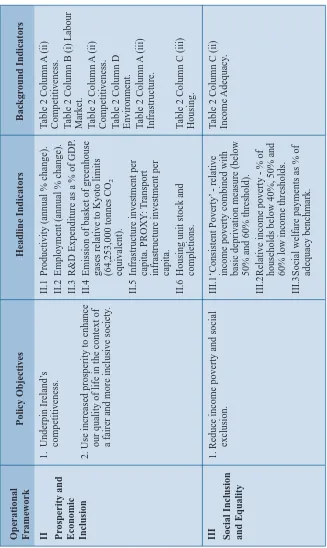
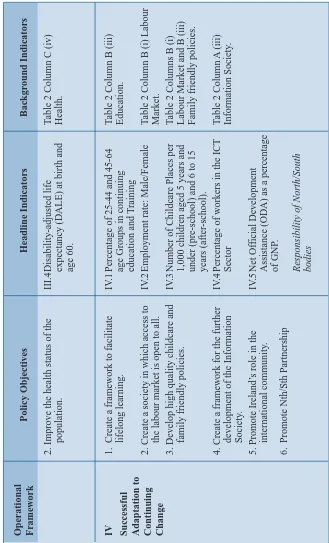
Twenty headline indicators are outlined in Table 3.1, under the first four operational framework headings of the PPF. Operational Framework titles reflect the overarching objectives of the PPF and are presented in the first column of the table. The second column expands on these to outline a series of related policy objectives. The headline indicators measuring these objectives are presented in the third column. Methodological issues and data tables relating to each indicator are outlined in detail in Appendix 1, and the key issues relating to the measurement of progress are discussed below under each of the operational framework headings. The location of the associated background indicators, under the heading of the dimension of policy to which they relate, are outlined in the fourth column of Table 3.1. In specifying policy objectives the approach is selective and consistent with the criteria outlined in Chapter 2 and this approach is carried through in relation to headline and background indicators. Consistent with adherence to the principle of balance, indicators proposed under particular operational frame-works should not be interpreted as discrete and comprehensive representations of a particular objective. They must be interpreted within the broader context. For example, progress in the living standards of the population is not adequately represented by the indicators listed under Operational Framework I. These in turn must be considered in the context of other indicators identified under the other operational frameworks and background indicators, partic-ularly those related to socio-economic and distribution/equity policy dimensions.
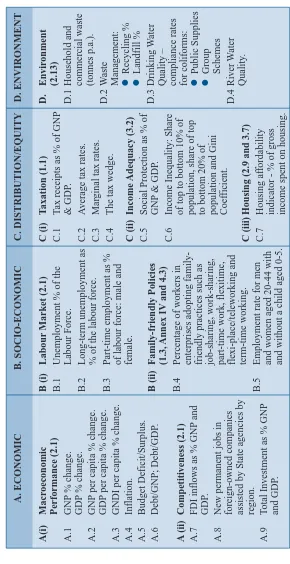
Forty-eight background indicators are identified in Table 3.2 under four policy dimensions as follows:
● Economic;
● Socio-economic: Promoting autonomy and self-sufficiency; ● Distribution/Equity; and
With the exception of the “Environment” heading each of these is sub-divided to specify particular policy headings and links to particular paragraphs of the PPF. For example, nineteen indicators are identified under the Economic dimension of policy in column A of Table 3.2 but these are divided into six ‘macro-economic performance’ indicators and seven ‘competitiveness’ indicators, which relate to paragraph 2.1 of the PPF, two infrastructure indicators that relate to paragraph 2.3 and four ‘Information Society’ indicators that relate to paragraph 4.4. Detailed Methodology and Data Notes relating to each of the background indicators are presented in Appendix 2.
Part II
Benchmarking Progress
on the
This section consists of five chapters, one devoted to each of the first four operational frameworks of the PPF and a summary and concluding chapter. The four operational frameworks are:
1. Living Standards and the Workplace Environment; 2. Prosperity and Economic Inclusion;
3. Social Inclusion and Equality; and
4. Successful Adaptation to Continuing Change.
In each chapter the key policy objectives and associated indicators are outlined. This is followed by an assessment of data availability and an outline of progress from 1997 to 2000 on key objectives. The 2000 data or the latest data prior to that are identified as the benchmarks against which progress on the PPF should be measured. The ideal situation would be for this exercise to take place concurrent with the framing of the PPF. This would mean that indicators and the associated benchmarks against which progress would be measured would be in place when the programme policy objectives were being formulated. This is the kind of approach that was adopted in the National Development Process. An exercise such as that is not realistic in the negotiation of national agreements due to the dynamics of negotiating such an agreement and the time frame involved. Yet, at a minimum, basic indicators and the associated benchmarks against which progress can be measured should be formulated. Two problems have inhibited this process in the past: (i) absence of agreement on indicators in some areas, and (ii) data deficiencies. As will become clear throughout this report the latter is still a problem.
CHAPTER 4
IMPROVING LIVING STANDARDS
AND THE WORKPLACE ENVIRONMENT
The achievement of higher living standards and improvements in the environment for work are the prime responsibility of the first operational framework, but policy in a range of areas covered in other frameworks impacts on these objectives and should be considered in evaluating progress on the benchmarks established here. Following the criteria specified in Chapter 2 the overarching objectives reflected by Framework I are operationalised into three policy objectives and five headline indicators.
4.1 POLICY OBJECTIVES AND HEADLINE INDICATORS The three policy objectives are to:
I.1 achieve higher living standards;
I.2 achieve improvement in the work environment; and I.3 enhance workplace relations through enterprise-level
partnership.
The first four headline indicators outlined in the third column of Table 3.1 and described in detail in Appendix 1, relate to the objective of achieving higher living standards:
HI.1 Irish GNP and GDP per capita as a percentage of EU GDP per capita nationally and by region;
HI.2 Percentage of taxpayers subject to higher rate of income tax; HI.3 Percentage of minimum wage not subject to income tax; and HI.4 Coverage of occupational pensions as percentage of National
The fifth headline indicator addresses a significant element of improving the work environment:
HI.5 Occupational injury rate per 1,000 at work.
The second headline indicator, HI.2 Percentage of taxpayers subject to higher rate of income tax, addresses a commitment made in the PPF relating to taxation and pensions. The social partners agreed to the objective “of ensuring that, over time, at least 80 per cent of taxpayers are not subject to the higher rate of income tax” (paragraph 1.1.4). This is supplemented with an indicator relating to percentage of the minimum wage not subject to income tax (H1.3). The rationale for this is that it “is an agreed policy objective of the Government and the social partners that, over time, all those earning the minimum wage will be removed from the tax net” (PPF paragraph 1.1.3).
The fourth headline indicator, HI.4 Coverage of occupational pensions as percentage of NPPI targets by sex, age, and occupational group, also relates to a specific PPF commitment. Acknowledging the National Pension Policy Initiative target for occupational pensions of 70 per cent of the total workforce over age 30, the parties to the PPF agreed to co-operate “to actively promote improvements in the coverage of occupational pension schemes” over its lifetime (paragraph 1.2). While no comprehensive data are currently available on coverage of occupational pensions, the survey of occupational pension coverage proposed in the PPF is being planned and the results are anticipated within the lifetime of the programme. The best estimates of coverage relate to 1995. Combining actual and estimated figures, the Pension Board (1998) estimated that 46 per cent of the workforce (49 per cent of men and 40 per cent of women) had occupational pension coverage in that year.
The objective of enhancing workplace relations through enterprise-level partnership is to be achieved primarily through institutional development. The initiatives proposed under this heading are broad ranging and relate to building on experience to date and the further development of institutional supports. Other significant parts of this operational framework are also dependent on institutional develop-ment, for example, the modernisation of the public service (PPF, paragraph 1.4) and the annexes relating to equal opportunities and family-friendly policies at the level of the enterprise. While it may be appropriate to develop quantitative indicators to measure progress in these areas in the future, it is not amenable to measurement through quantitative headline indicators at present. It is anticipated that the National Centre for Partnership and Performance will develop appropriate indicators in this area.
4.2 BACKGROUND INDICATORS
The location of the related background indicators is outlined in the fourth column of Table 3.1 and the specific indicators are listed in Table 3.2 under the sub-headings: Macro-economic Performance, Taxation, Income Adequacy and the Labour Market. The linkage of each of these to a particular paragraph or paragraphs of the PPF is identified in brackets. Detailed Methodology and Data Notes are presented in Appendix 2. The identification of a greater number of background indicators reinforces the point that the headline indicators are selected to reflect a general situation rather than being intended as comprehensive descriptors of particular policy objectives.
4.3 MEASURING PROGRESS IN LIVING STANDARDS AND THE WORKPLACE ENVIRONMENT
TABLE 4.1
Measuring Progress in Living Standards and the Workplace Environment
Note: N/A: Information is not available.
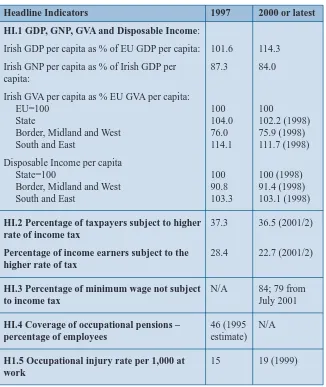
The first four indicators in Table 4.1, HI.1 to HI.4, measure progress in the achievement of higher living standards (see Table 4.1, column 2 re policy objectives). The first measure, which is an explicitly comparative measure, indicates that GDP per capita had exceeded EU GDP by 1997 and had reached 114 per cent of the EU average in 2000. Yet it is important to bear in mind that there is a significant
Headline Indicators
HI.1 GDP, GNP, GVA and Disposable Income:
Irish GDP per capita as % of EU GDP per capita:
Irish GNP per capita as % of Irish GDP per capita:
Irish GVA per capita as % EU GVA per capita: EU=100
State
Border, Midland and West South and East
Disposable Income per capita State=100
Border, Midland and West South and East
HI.2 Percentage of taxpayers subject to higher rate of income tax
Percentage of income earners subject to the higher rate of tax
HI.3 Percentage of minimum wage not subject to income tax
HI.4 Coverage of occupational pensions – percentage of employees
H1.5 Occupational injury rate per 1,000 at work
2000 or latest
114.3 84.0 100 102.2 (1998) 75.9 (1998) 111.7 (1998) 100 (1998) 91.4 (1998) 103.1 (1998) 36.5 (2001/2) 22.7 (2001/2)
difference between GDP and GNP in Ireland. In 2000 GNP was equivalent to 84 per cent of Irish GDP or about 96 per cent of the EU GDP per capita. The strength of Ireland’s economic performance is reflected in the fact that all of the background economic performance indicators – GNP and GDP percentage change; GNP and GDP per capita percentage change; GNDI per capita percentage change, inflation, budget surplus and the debt/GNP and GDP – are positive in their direction of change and in performance relative to EU averages for 1997 and 2000 or nearest year available (Appendix 2). Data for 2000 are available for all of these indicators except GNDI and inflation.
Objective 1 status for Structural Funds purposes and the commitment of the state industrial location agencies to regional dispersion of industry should help to redress the imbalance in development reflected by these indicators. The figures provided in Table 4.1 and in Appendix 2 provide clear benchmarks against which progress should continue to be measured.
4.4 TAX, PRSI AND PENSIONS
TABLE 4.2
Total Tax Revenues as a Percentage of GDP at market prices1
Source: OECD (2000), Taxing Wages 1999-2000, Annex Table II.A. Note: 1. Total tax revenue includes personal income taxes, social security
[image:43.595.131.459.357.409.2]contributions (employers and employees) and all other taxes.
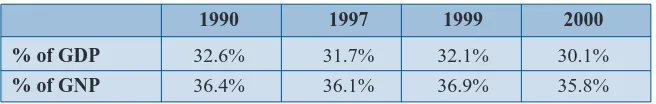
TABLE 4.3
Tax as a Percentage of GDP and GNP
Source: Department of Finance (2000 and 2001), Budgetary and Economic
Statistics, Tables 4 and 12.
The average rate of tax paid by the Average Production Worker (APW), who is single and without children, indicates a similar decreasing trend over time and relative to our EU partners, and this is maintained when employee social security contributions are included (Appendix 2, Indicator C.2). The pattern over time is similar for marginal tax rates at various income levels from 50 per cent to 500 per cent of average industrial earnings. The comparable figures based on 67 per cent, 100 per cent and 167 per cent of average industrial earnings indicate a consistent improvement relative to the Netherlands and Denmark. Relative to the UK the situation had improved considerably by 2000 for those with 67 per cent of average industrial earnings but marginal tax rates are still considerably higher in Ireland for those at the average and 167 per cent levels. A similar pattern is evident with the tax wedge, that is the difference between the cost to the employer of employing someone and the value of earnings to the employee, defined as
1990 1997 1999 2000 % of GDP 32.6% 31.7% 32.1% 30.1%
% of GNP 36.4% 36.1% 36.9% 35.8%
1992 1994 1998 Ireland 35 36 32
Denmark 47 50 50
Netherlands 45 43 41
income tax plus employee and employer social security contribu-tions as a percentage of labour costs: The change over time is positive at all income levels whether measured from 1987 to 1999 or 1996 to 1999 but the tax wedge for the average production worker is still marginally lower in the UK: 30.8 per cent relative to 32.4 per cent in Ireland in 1999 (Appendix 2, Indicator C.4).
4.5 OCCUPATIONAL INJURIES
The fifth headline indicator, HI.5 Occupational injury rate per 1,000 at work, indicates a disimprovement in the situation over the 1997 to 1999 period. This is a very disturbing trend and indicates the urgency of legislative proposals and associated policy action in this area. The Safety, Health and Welfare at Work Act, 1989 is under review by the Health and Safety Authority. The completion of this review will enable legislative proposals to be developed that could strengthen and update statutory health and safety provisions. These are essential if the objective of the PPF to enhance the health and safety culture of all workplaces is to be realised.
4.6 SUMMARY OF TRENDS
CHAPTER 5
ENHANCING PROSPERITY
AND ACHIEVING ECONOMIC INCLUSION
Commitments under operational framework II of the PPF are identified under thirteen headings covering a wide range of policy issues including the overall economic context, enterprise policy, public transport infrastructure, rural and regional development, housing and environment policy. The overarching thrust of the framework is encapsulated in the two following policy objectives: II.1 Underpin Ireland’s competitiveness; and
II.2 Use increased prosperity to enhance our quality of life in the context of a fairer and more inclusive society.
5.1 INDICATORS
Six headline indicators were identified in Table 3.1.to benchmark the policy objectives.
The first three headline indicators relate directly to underpinning competitiveness:
HII.1 Labour Productivity (annual percentage change); HII.2 Employment (annual percentage change); and HII.3 R&D Expenditure as a percentage of GDP.
These are supplemented with a range of background indicators relating directly to competitiveness (Table 3.2 column A: A (ii)) and labour market indicators that reflect, and impact on, competitiveness (Table 3.2 column B: B (i) Labour Market).
The other three headline indicators relate to quality of life under the dimensions of environment, infrastructure and housing:
HII.4 Emission of basket of greenhouse gases relative to Kyoto limits;
HII.6 Housing unit stock and completions.
These are supplemented with background indicators under each of the dimension headings in Table 3.2, columns D (Environment), A (Infrastructure) and C (Housing) respectively.
The first headline indicator, HII.1 Labour Productivity (annual percentage change), indicates the change in unit of output per unit of labour input. This is a measure of a dynamic, competitive and technologically advanced economy, indicating a flexible workforce as well as adaptable businesses. An important facet of this indicator for Ireland is that labour productivity is significantly higher, and has grown faster, in foreign-owned than in Irish-owned companies. High labour productivity is therefore, to a significant degree, reflective of the high level of FDI in Ireland and its technological nature.
Two definitions are commonly used for the second indicator, HII.2 Employment (annual percentage change): the proportion of people of working age 15 to 64 in employment (OECD, Eurostat Labour Force Surveys), and the proportion of people aged 15 years and over in employment (calculated from the Irish QNHS surveys). This is the clearest indication of the demand for labour and reflects economic activity and growth.1High employment rates should also, although do not necessarily, indicate, and contribute to, improved social circumstances.
The third headline indicator, HII.3 R&D Expenditure as a percentage of GDP, comprises all of a country’s expenditure on Research and Development activities as a proportion of GDP. It includes expenditure by government, businesses and industry and investment from abroad.2 Research and Development is an important driver of progress in an economy and society and is essential to increasing innovation through technological progress and the development of ‘knowledge capital’ (Fitz Gerald et al,
1. The employment and unemployment rates are influenced by and are indicators of labour supply and demand, and are considered in Table 7.1 and Table 3.2 B: Labour Market.
1999: 61-2 and 296-8). The indicator illustrates the level of priority attached to the development of a knowledge-based economy, thereby contributing to the development of increased productivity and competitiveness. Investment in R&D is essential to ensure that Ireland can position itself at the cutting edge of industrial development and innovation. The creation of linkages between industry, academia and the social partners can aid in maximising the return on the State’s investment in R&D to the benefit of all in society. In addition, investment in R&D contributes to the development of a skilled and adaptable workforce and a population that can embrace the changes emerging as a result of rapid and ongoing technological advances. This indicator is supplemented with one relating to business investment in R&D and one related to Government appropriations and Outlays on R&D as a percentage of GDP (Table 3.2: A (ii): Competitiveness and Appendix 2).
The fourth headline indicator, HII.4 Emission of basket of
greenhouse gases relative to Kyoto limits (64,253,000 tonnes CO2
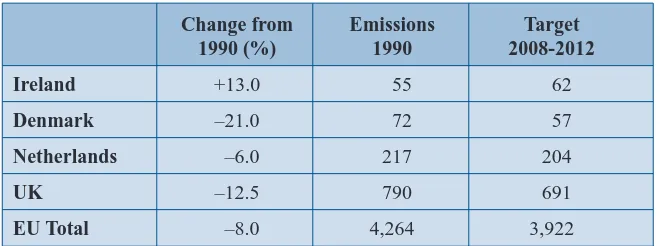
equivalent,) reflects Ireland’s commitment under the Kyoto protocol. At the UN climate conference in Kyoto in December 1997, the industrialised world agreed a protocol to reduce greenhouse gas emissions. The Kyoto agreement uses 1990 as its benchmark year. Under the Kyoto Protocol, industrial countries agreed to reduce their greenhouse gas emissions (six gases) by 5 per cent of their 1990 levels by 2008-2012. Within this requirement, the EU as a whole agreed to reduce emissions by 8 per cent. As part of this commitment, and recognising Ireland’s converging rate of economic growth, it was agreed that the ceiling on Ireland’s growth in greenhouse gas emissions would be 13 per cent above 1990 levels. The Government is legally bound under the agreement to take action to reduce the emissions. The National Climate Change Strategy produced by the Department of the Environment and Local Government outlines the programme for action.
of the total national emissions. Research is currently being undertaken on producing an inventory of these gases, funded by the NDP and the EPA, with results expected in 2002. The net emissions of the three main greenhouse gases (carbon dioxide (CO2), methane (CH4) and nitrous oxide (N2O)) are presented in Table 5.1. The major human emissions of GHGs in Ireland include carbon dioxide (CO2), in particular through the burning of fossil fuels, methane (CH4) and nitrous oxide (N2O). Energy use is the single most important contributor of GHGs. Agriculture is the other major contributor. In the period 2008-2012 Ireland’s Kyoto commitment is to limit the net growth in emissions to 13 per cent above 1990 levels or to 62 MT CO2 equivalent (Table 5.2). Ireland had already exceeded this limit by 2000.
TABLE 5.1
Total Net Green House Gas Emissions, Ireland 1990 and 1998 and Projections for 2000 (in Kilo tonnes)
Source: Department of the Environment and Local Government (2000),
National Climate Change Strategy Ireland and Environmental Protection Agency (2000), Emissions to Air 1990-1998.
Note: 1. The base year for these gases (HFCs, PFCs and SF6) is 1995 as agreed to in the Kyoto protocol, as data for emissions in 1990 are inadequate and emissions were insignificant until 1995. The initial estimations are that in 1995 total emissions of all these gases together represented 0.5 per cent of total emissions. This is expected to rise very rapidly to the period 2010. Much of the rise is due to the replacement of CFCs with HFCs.
2. Net emissions is total emissions less sinks (Kyoto basis).
Carbon Methane Nitrous HFC Net total % Dioxide (CH4) Oxide PFC emissions increase
CO2 (N2O) SF61 as CO2
equivalent2
1990 31,575 12,836 9,085 256 53,752 –
1998 40,028 13,631 10,069 256 63,239 17.65%
TABLE 5.2
The Burden Sharing Targets Agreed by EU Member States (Emissions measured in Mtonnes of CO2Equivalent)
Source: Department of the Environment and Local Government (2000), Report
of the Consultation Group on Greenhouse Gas Emissions Trading.
This headline indicator is supplemented with six background environmental indicators (Table 3.2, column D: Environment). The fifth headline indicator measuring progress in prosperity and economic inclusion relates to infrastructure reflecting the use of increased prosperity to enhance our quality of life in the context of a fairer and more inclusive society. There are no reliable data on Expenditure on Infrastructure per capita but data will be available from county level up and for each of the Operational Programmes, sub-programmes, measures and projects under the National Development Plan. To facilitate cross-national comparisons this should be standardised using purchasing power standards. Until data become available, Transport Infrastructure Investment per capita is the proxy for HII.5 and provides a comparative ranking for Ireland within the European Union. This is available for the 1990-98 period in the EU Transport in Figures Statistical Pocket Book (2000). This supplemented with two background indicators relating to road and rail infrastructure (Table 3.2, columns A: Infrastructure).
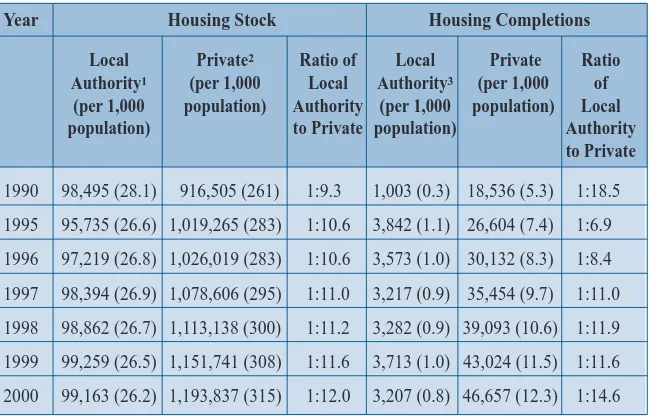
HII.6 Housing unit stock and completions per 1,000 population, the sixth headline indicator under this framework, refers to the number of existing housing units (stock) and the number of units completed
Change from Emissions Target 1990 (%) 1990 2008-2012 Ireland +13.0 55 62
Denmark –21.0 72 57
Netherlands –6.0 217 204
UK –12.5 790 691
in a given period (flow). The stock of housing provides a snapshot of available housing units at any one time while completions provide a dynamic indicator of change in the supply of housing. Distinguishing between social and private housing is important in the benchmarking of progress as they are linked elements of the housing system (NESC, 1999). Social housing units are comprised largely of local authority housing. Despite the fact that voluntary housing has frequently been advocated as an element of social housing in Ireland it still accounts for less than one per cent of the housing stock, that is around 11,000 units and production is highly variable: from 1,101 in 1995 it was reduced consistently to 478 in 1998. The provisional figure for 2000 is 971. As house prices and private rents increase the demand for social housing increases. Similarly, social housing completions have an impact on other housing sectors. Many of those who are eligible for social housing currently reside in unsuitable or unaffordable private rented accom-modation, some of which may be rent assisted (NESC, 1999: 503-5).3Social housing provision can lessen the demand for private rented stock; a more open and higher quality of private accom-modation could lessen the demand for private purchase and social housing. The headline housing indicator is supplemented with three indicators relating to affordability, quality and local authority waiting lists (Table 3.2, C: Housing and Appendix 2).
5.2 MEASURING PROGRESS IN PROSPERITY AND ECONOMIC INCLUSION
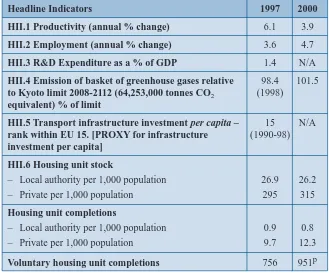
The overarching objective of achieving prosperity and economic inclusion in Ireland is reflected in the policy objectives of underpinning Ireland’s competitiveness and using increased prosperity to enhance our quality of life in the context of a fairer and more inclusive society. The data to locate Ireland on the associated indicators in 1997 and 2000 are presented in Table 5.3.
As with the GDP and GNP figures and the background macro-economic data presented under Operational Framework I, the data
TABLE 5.3
Measuring Progress in Prosperity and Economic Inclusion
Note: N/A: Information is not available. p: Provisional.
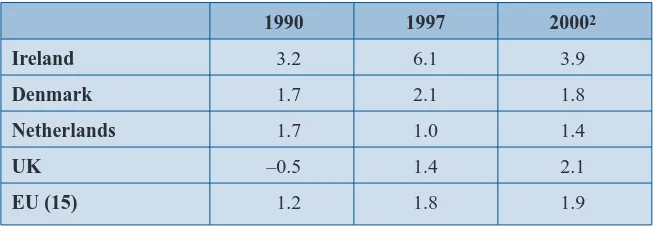
relating to productivity (indicator HII.1) and employment (indicator HII.2) are impressive in terms of progress over time (Table 5.3) and relative to EU averages (Tables 5.4 and 5.5 and Appendix 1). Changes in labour productivity and in employment, which underpin and reflect Ireland’s competitiveness, must be interpreted within the context of the background competitiveness and labour market indicators outlined in Table 3.2 and presented in detail in Appendix 2. Data on most of these indicators reinforce the positive story, particularly the Foreign Direct Investment (FDI) inflows as a percentage of GDP, and total investment, measured by Gross Fixed Capital Formation (GFCG), as percentages of GNP and GDP. The regional indicator for FDI is New Permanent Jobs Created by
Headline Indicators 1997 2000 HII.1 Productivity (annual % change) 6.1 3.9
HII.2 Employment (annual % change) 3.6 4.7
HII.3 R&D Expenditure as a % of GDP 1.4 N/A
HII.4 Emission of basket of greenhouse gases relative 98.4 101.5
to Kyoto limit 2008-2112 (64,253,000 tonnes CO2 (1998)
equivalent) % of limit
HII.5 Transport infrastructure investment per capita – 15 N/A
rank within EU 15. [PROXY for infrastructure (1990-98)
investment per capita] HII.6 Housing unit stock
– Local authority per 1,000 population 26.9 26.2
– Private per 1,000 population 295 315
Housing unit completions
– Local authority per 1,000 population 0.9 0.8
– Private per 1,000 population 9.7 12.3
TABLE 5.4
Labour Productivity, percentage change1(prices, wages and labour costs)
Source: Eurostat (2000), EC Economic Data Pocket Book December 2000. Note: 1. Percentage change p.a.:GDP at 1995 market prices per person
employed.
2. DG ECFIN Economic Forecasts, Spring 2000.
TABLE 5.5
Employment percentage change, 1987, 1990, 1997, 2000
Source: OECD (2000) OECD Economic Outlook December 2000 and OECD
Employment Outlook June 2000 and Eurostat (2000), EC Economic Data Pocket Book December 2000.
Note: 1. DG ECFIN economic forecasts, Spring 2000. 2. QNHS Feb 2001.
Foreign-Owned Companies supported by IDA Ireland, Enterprise Ireland, Shannon Development and Udaras na Gaeltachta (A8). While the net changes in employment are positive for all regions in the 1994 to 2000 period, these figures are not particularly helpful without detailed analysis relating to population and labour force.
1987 1990 1997 20001
Ireland 0.6 3.3 3.6 4.72
Denmark 0.9 –0.8 2.2 0.8
Netherlands 1.6 3.0 3.4 2.5
UK 2.6 0.3 1.6 0.9
EU 15 1.1 1.5 0.8 1.5
1990 1997 20002
Ireland 3.2 6.1 3.9
Denmark 1.7 2.1 1.8
Netherlands 1.7 1.0 1.4
UK –0.5 1.4 2.1
[image:53.595.135.457.406.519.2]The third headline indicator, HII.3 R&D Expenditure as a percentage of GDP, presents a considerably less impressive picture than the employment and productivity change indicators. The latest year for which data are available is 1997. The 1.4 per cent of GDP in that year and in 1996 is low relative to the EU average of 1.8 per cent and especially relative to Denmark (2.0 per cent), the Netherlands (2.1 per cent) and the UK (1.9 per cent). Two of the background indicators provide some further information. Business Investment in R&D (Appendix 2, A12) was marginally above the EU average in 1997 but considerably below the OECD average. Two-thirds of this was carried out by foreign-owned firms but only a quarter of these carry out any R&D (National Competitiveness Council, 2000: 57). Government Investment in R&D (Appendix 2, A13) was less than half the EU percentages in 1997 and 1998. It is noteworthy that Ireland’s R&D expenditure on higher education and government institutions, at 0.42 per cent of GDP, was, with Portugal’s expenditure, the lowest of thierteen EU countries in 1998, the latest year for which data are available. The EU average expenditure was 0.66 per cent of GDP and the median was 0.7 per cent. As a crucial element of Ireland’s competitiveness, various dimensions of expenditure on R&D and related activity are examined in some depth in the Annual Competitiveness Report for 2000 produced by the National Competitiveness Council (2000: 57-59 and Tables A6 and A7).
The fourth headline indicator, HII.4 Emission of basket of
greenhouse gases relative to Kyoto limits (64,253,000 tonnes CO2
compared to a European average in the late 1990s of 66 per cent and only 35 per cent in the Netherlands and 22 per cent in Denmark (Appendix 2:D2). The compliance rate for coliforms, which measures the overall rate of microbiological quality of water for human consumption was 91 per cent in public schemes and 64 per cent in group schemes in 1997 (Appendix 2:D3). In the 1995-1997 period, 67 per cent of river water was unpolluted, 18 per cent was slightly polluted, 14 per cent was moderately polluted and 1 per cent was seriously polluted (Appendix 2:D4).
The fifth headline indicator measuring progress in prosperity and economic inclusion relates to infrastructure reflecting the use of increased prosperity to enhance our quality of life in the context of a fairer and more inclusive society. Until data become available Transport Infrastructure Investment per capita is the proxy for Infrastructure Investment per capita. It provides a comparative ranking for Ireland within the European Union. In the 1990-1996 period, the latest available Ireland ranked thirteenth in the EU. Ireland also ranks poorly on the background indicators of road and rail infrastructure: last of fourteen (1996) and last of thirteen (1998) respectively (Appendix 2: A16) (National Competitiveness Council, 2000: Table A13).
population. This difference in the two trends is reflected in the decrease in the ratio of local authority to private houses from 1:10.6 in 1995 to 1.12.0 in 2000. The decrease in the ratio of local authority to private housing is more marked in housing completions from 1:6.9 in 1995 to 1:14.6 in 2000. In addition to the local authority housing, social housing includes a small voluntary housing element, estimated to account for less than one per cent of the housing stock in the late 1990s (NESC, 1999: 508-510). Over 1,000 voluntary housing units were constructed in 1995 and this dropped consistently to less than 500 in 1998. The provisional figure for 2000 is 951 (Table 5.3).
TABLE 5.6
Housing Unit Stock and Completions 1990-2000
Source: Department of the Environment and Local Government (1999), Annual
Housing Statistics Bulletin 1999, and figures provided by the Department of the Environment and Local Government; Central Statistics Office (2000), Population and Migration Estimates April 2000: Dublin: Central Statistics Office.
Note: 1. This stock figure refers to the number of local authority houses let on 31st December of the previous year.
2. These figures are based on estimates provided by the Department of the Environment and Local Government.
3. This includes housing completions and acquisitions.
Year Housing Stock Housing Completions Local Private2 Ratio of Local Private Ratio
Authority1 (per 1,000 Local Authority3 (per 1,000 of
(per 1,000 population) Authority (per 1,000 population) Local population) to Private population) Authority
to Private
1990 98,495 (28.1) 916,505 (261) 1:9.3 1,003 (0.3) 18,536 (5.3) 1:18.5
1995 95,735 (26.6) 1,019,265 (283) 1:10.6 3,842 (1.1) 26,604 (7.4) 1:6.9
1996 97,219 (26.8) 1,026,019 (283) 1:10.6 3,573 (1.0) 30,132 (8.3) 1:8.4
1997 98,394 (26.9) 1,078,606 (295) 1:11.0 3,217 (0.9) 35,454 (9.7) 1:11.0
1998 98,862 (26.7) 1,113,138 (300) 1:11.2 3,282 (0.9) 39,093 (10.6) 1:11.9
1999 99,259 (26.5) 1,151,741 (308) 1:11.6 3,713 (1.0) 43,024 (11.5) 1:11.6
Data on three background housing indicators is provided in Section C(iii) of Appendix 2. These are local authority waiting lists, housing affordability and housing quality.
[image:57.595.128.458.473.569.2]Local Authority Waiting Lists (Appendix 2: C9) increased from 23,242 in 1991 to 27,427 in 1996 to 39,179 in 1999. These figures reflect ‘net approved need’ that is applications that have been assessed and approved for housing by local authorities. Details of the category of housing need by family status are given in Appendix 2. Table 5.7 provides a summary of the largest categories of need in 1996 and 1999. Amongst these the percentage unable to afford their own accommodation increased from 28 to 34 per cent. It is noteworthy that in 1999 almost 6 per cent of those assessed to be in need were homeless and a further 6 per cent were elderly. Travellers comprised 3.5 per cent of those in need of local authority housing, that is 1,406 single people or family units. This reflects a market increase on the 1996 figure of 749 Traveller family units which is n