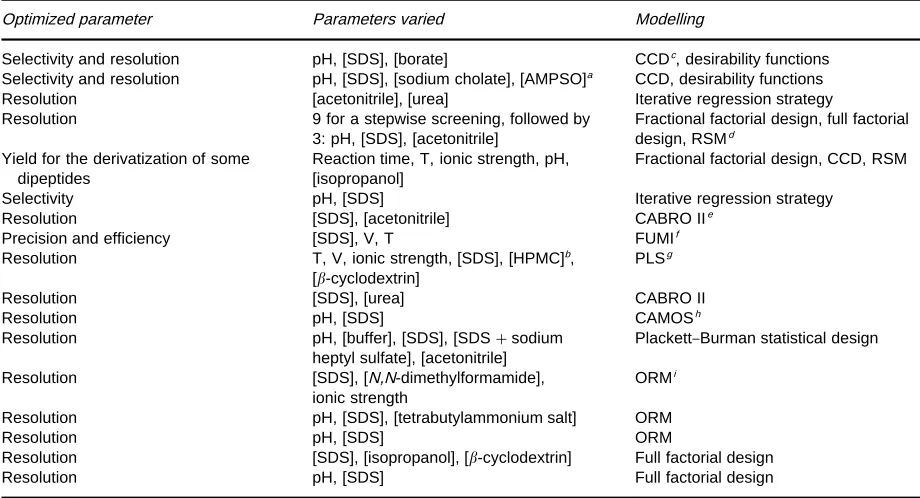
Table 4 Statistical optimization schemes used in MEKC
Optimized parameter Parameters varied Modelling
Selectivity and resolution pH, [SDS], [borate] CCDc, desirability functions Selectivity and resolution pH, [SDS], [sodium cholate], [AMPSO]a CCD, desirability functions
Resolution [acetonitrile], [urea] Iterative regression strategy
Resolution 9 for a stepwise screening, followed by
3: pH, [SDS], [acetonitrile]
Fractional factorial design, full factorial design, RSMd
Yield for the derivatization of some dipeptides
Reaction time, T, ionic strength, pH, [isopropanol]
Fractional factorial design, CCD, RSM
Selectivity pH, [SDS] Iterative regression strategy
Resolution [SDS], [acetonitrile] CABRO IIe
Precision and efficiency [SDS], V, T FUMIf
Resolution T, V, ionic strength, [SDS], [HPMC]b,
[-cyclodextrin]
PLSg
Resolution [SDS], [urea] CABRO II
Resolution pH, [SDS] CAMOSh
Resolution pH, [buffer], [SDS], [SDS#sodium
heptyl sulfate], [acetonitrile]
Plackett}Burman statistical design
Resolution [SDS], [N,N-dimethylformamide],
ionic strength
ORMi
Resolution pH, [SDS], [tetrabutylammonium salt] ORM
Resolution pH, [SDS] ORM
Resolution [SDS], [isopropanol], [-cyclodextrin] Full factorial design
Resolution pH, [SDS] Full factorial design
aAMPSO"3-[(1,2-dimethyl-2-hydroxyethyl)amino]-2-hydroxypropanesulfonicacid;bHPMC"hydroxypropyl methylcellulose;ccentral composite design;dresponse surface modelling;ecomputer-assisted bivariate resolution optimization II;ffunction of mutual information; gpartial least squares;hcomputer-assisted multivate optimization strategies;ioverlapping resolution mapping.
V, voltage; T, temperature.
Further Reading
Camilleri P (1998)Capillary Electrophoresis,Theory and Practice, 2nd edn, pp. 135d182. New York: CRC Press.
Guzman NA (1993)Capillary Electrophoresis Technology, pp. 65d87, 693d704. New York: Marcel Dekker.
Khaledi MG (1998) High-Performance Capillary Elec-trophoresis, pp. 77d140. New York: John Wiley.
Poole CF and Poole SK (1997) Interphase model for retention and selectivity in micellar electrokinetic chromatography.Journal of Chromatography A 792: 89d104.
Riekkola M-L, Wiedmer SK, ValkoH IE and SireHn H (1997)
Selectivity in capillary electrophoresis in the presence of
micelles, chiral selectors and non-aqueous media. Journal of Chromatography A792: 13d35.
Rosen MJ (1989)Surfactants and Interfacial Phenomena, 2nd edn, pp. 108d206. New York: John Wiley.
Terabe S, Otsuka K, Ichikawa K, Tsuchiya A and Ando T (1984) Electrokinetic separations with micellar solu-tions and open-tubular capillaries.Analytical Chemistry 56: 111d113.
Terabe S (1989) Electrokinetic chromatography: an inter-face between electrophoresis and chromatography. Trends in Analytical Chemistry8: 129d134.
Vindevogel J and Sandra P (1992)Introduction to Micellar Electrokinetic Chromatography, pp. 1d231. Heidelberg:
HuKthig Buch Verlag.
Microtechnology
T. McCreedy, University of Hull, Hull, UK
Copyright^ 2000 Academic Press
Introduction
Electrophoresis is an established separation tech-nique, frequently used for mixtures ranging from
methods used relatively large scale apparatus, but during the later 1960s, and early 1970s, reports ap-peared describing separations being performed in small bore tubesRlled with buffer solution. This work was extended in the early 1980s, with capillaries being a key feature of the basic methodology. This was the start of capillary electrophoresis (CE); how-ever, it was not until the mid 1980s that great interest was shown towards a new approach to separation science. From that moment, development and com-mercialization came very quickly and soon there were a number of commercial instruments available for routine laboratory use.
It is not possible to cover all aspects of electrophor-esis in an article such as this; indeed there are several topics that have been omitted. Fluid logic devices and freeze}melt switching are two such examples;
an-other important area not included is the use of paral-lel bundles of microcapillaries that permit multiple analyses to be performed at a high throughput.
The basic element of any CE system is the separ-ation capillary, typically 10}100m internal
dia-meter and 30}100 cm long. Each end of the capillary
is located in a small reservoir, which contains buffer solution and a platinum anode or cathode; typically potentials of up to 30 kV can be applied between them. Detection is achieved by a range of in-line detection methods, such as ultraviolet absorbance and other detection methods, such as mass spectro-metry, can be interfaced to the capillary.
Separation is achieved due to the differing elec-trophoretic mobilities of the analytes in the sample,
but in addition electroosmotic Sow (EOF) takes
place. This phenomenon gives rise to bulkSow of the solution in the capillary without the need for an external pump. For a unmodiRed silica capillary, the direction of Sow would be from the anode to the cathode, which enables all uncharged species to be carried to the detector. This technique offers very high separation efRciencies and rapid analysis. This feature, coupled with the simplicity of the instrumen-tation, makes the technique ideally suited to minia-turization.
Interest in miniaturizing analytical systems in not new; indeed, the idea of a micro total analysis system (often referred to asTAS) has been mooted for some
time within the scientiRc community (see, for
example, the paper by Martin cited in Further Read-ing). The ideal approach is to include sample manip-ulation and detection on a chip-sized device; this has given rise to the term ‘lab on a chip’. Such systems employ microstructures fabricated on glass or other substrates to form integrated devices rather than at-tempting to construct miniaturized systems from discrete components. However, there is also
consider-able interest in the development of discrete components, such as micropumps. The conference proceedings from the recent Micro Total Analysis Systems ’98 give some indication as to the diversity of the developments. While on-chip injection is feasible, some prior degree of preparation may still be neces-sary. For example, particulate matter would quickly block the channels, so pre-Rltering would be required in such situations. Before examining in more detail electrophoresis on chips, it is important to consider the fabrication of such microchannel devices.
Fabrication of Electrophoresis
Devices
There are numerous fabrication methods available, and the complexity of possible designs is virtually limitless. A popular fabrication technique is the use of photolithographic masking in conjunction with wet or chemical etching. The simplest case would be the fabrication of a single channel in a piece of glass. First, the glass would be coated with a layer of depos-ited metal and subsequently photoresist, e.g. by spin coating, then the pattern mask is placed on top of the photoresist. This masked surface is subsequently ex-posed to ultraviolet light, which transfers the pattern on to the photoresist. The unprotected area can then be removed, along with the underlying metal surface. An etching solution, such as hydroSuoric acid/nitric acid, is used to etch away the glass, forming the chan-nel in the chip. This surface of the chip protected by the metal and photoresist layer does not etch. This pro-cess can be seen inFigure 1. There are a few problems with this approach; theRrst is that only certain mater-ials can be etched. The second is that, as the channel is etched deeper, the width also increases. This becomes more of a problem as the depth increases, resulting in channel with nonvertical sides. This problem can also create difRculties at channel intersections, which do not have true intersecting corners due to the acceler-ated etching of the exposed corners.
There are many alternatives to the wet etch ap-proach. Dry etch processes include reactive ion and laser etching; these offer a way to cut precise channels of small dimensions. Silicon is gaining in popularity as an alternative substrate to glass for chip fabrica-tion, and by employing more than one etching tech-nique complex devices can be produced.
Figure 1 The fabrication process for a separation chip fab-ricated from silica. The first step is to place the mask on top of the silica base plate covered in deposited metal and photoresist (step 1). After this has been exposed to UV light, the chip is developed to remove the exposed photoresist and metal. It is then etched, e.g. with hydrofluoric/ nitric acids (step 2); etching does not occur where the metal and photoresist remains. The final stage (step 3) is the bonding of the cover plate on to the base plate. The two etched channels can clearly be seen.
primarily since it allows the use of a wide range of new materials, and the prospect of mass production. It requires a template to be constructed, often by wet etching or mechanical milling. This template can be considered as the negative image of the channels, and is oftenRnally produced in a more durable material, such as nickel. From this robust template, it is
pos-sible to mass-produce thousands of channel systems with considerable speed.
All of these methods create half the chip; the next step is to attach the cover plate, i.e. the other half of the chip. It is common to locate the holes for the necessary reservoirs in this plate; the reservoirs them-selves are frequently constructed by attaching cylin-ders, e.g. truncated pipette tips, to the top plate. For glass and silica-based systems, it is a simple step to bond the top plate on to the channels by a heating and cooling cycle (the cooling cycle is required to avoid thermally stressing the glass). The Rxing of the top plate to polymeric materials can be more complex; however, perhaps the simplest method is to use a ther-mally activated adhesive to laminate the top plate on to the chip. Typical channel dimensions are 200m wide by 60m deep, and vary in length from 5 mm to several centimetres. Of course, many other channel dimensions can be created. Some typical patterns can be seen inFigure 2.
Theoretical Considerations
There are two important effects that need to be con-sidered when discussing electrophoresis in micro-channels; these are similar to the more conventional capillary electrophoresis. TheRrst is electrophoretic
mobility, and the second is electroosmotic Sow
(EOF). EOF is otherwise referred to as electroendos-moticSow.
Electrophoretic Mobility
This process forms the basis for the separation in the channel, and dictates the migration velocity of a given ion in the channel. The electrophoretic mobility (e) is related to the migration velocity (v) by eqn [1], where Eis the electricReld strength:
v"eE [1]
The units ofe,vandE are cm2V\1s\1, cm s\1, and V cm\1respectively. The electrophoretic mobil-ity is proportional to the ionic charge and frictional forces. Thus, if two mobile species differ in either their charge or the frictional forces, then separation will occur. Since uncharged molecules have an electro-phoretic mobility of zero, movement will not occur; this is why electrophoresis cannot separate neutral molecules. For ions of the same size,ewill be greater for ions with greater charge while for ions of the same charge,e will be greater for smaller ions.
Electroosmotic Flow
Figure 2 Some typical channel arrangements. Reservoirs A and B start and terminate the separation channel. Reservoirs C and D permit a known amount of sample to be injected into the separation channel. The reservoirs E and F permit the addition of other reagents to the separation channel.
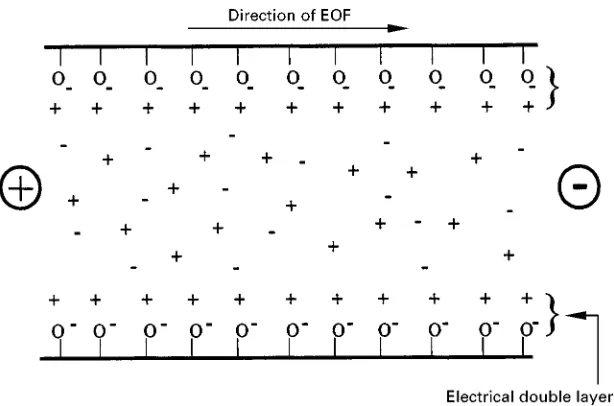
reaching linear velocities of around 5 cm min\1 or greater. The rate of movement due to EOF is normal-ly greater than the electrophoretic mobility, thus en-suring that all ionic (and uncharged) species pass the detector. However, unlike electrophoretic mobility, EOF will only occur in the presence of an electrical double layer at the surface of the channel. InFigure 3, an axial view of a channel etched in glass can be seen; the surface is covered in silanol groups.
When the pH of the buffer is above&pH 9, all the silanol groups are ionized. Cations from the buffer migrate towards the negative wall of the channel, and a double layer is formed. When a voltage is applied across the channel, these cations migrate towards the cathode, thereby inducing bulk Sow. Electro-driven Sow has a characteristicallySat proRle compared to the parabolic proRle observed for pressure-driven sys-tems. This signiRcantly reduces the dispersion due to Sow, and is considered to be a reason for the high efRciency separations possible. Another reason for the low dispersion observed is that the Reynolds num-bers for liquids in such a system are very low, which results in limited dispersion. The electroosmotic
mo-bility (EOF) is given in eqn [2] whereis the viscosity of the buffer,is the dielectric constant of the buffer and is the zeta potential (charge on the capillary wall):
EOF"(/) [2] The EOF velocity can be calculated from eqn [3] which has striking similarities to eqn [1]. Here, the EOF velocity (v) is related to the electroosmotic mo-bility (EOF), and the electricReld gradient (E):
v"EOFE [3]
From this, it is apparent that the overall velocity of the ionic species is the algebraic sum of the migration velocity, and the EOF velocity. By summing the two velocity terms and subsequent rearrangement of the equation, the actual velocity (va) of an ionic species is given by eqn [4]:
va"(E#EOF)E [4]
Figure 3 The double layer formed in silica channel. The layers of cations which collect along the walls of the channel will migrate towards the cathode when a voltage is applied. This gives rise to the electroosmotic flow (EOF) with the characteristic flat flow profile.
direction of EOF needs to be reversed. This can be achieved by coating the walls of the channels with a cationic surfactant. This gives an apparently posit-ive charge to the walls, so that anions (not cations) will form the double layer. Then, when the potential is applied, EOF will be in the opposite direction. Since the inSuence of the double layer is generally con-sidered to extend less than 1m into the solution, overlap of the double layer should not be an issue for channels of greater than 5m minimum dimension. However, for channels of smaller dimension, theSat Sow proRle model may no longer be valid, and great care should be exercised in describing theSow.
To prevent EOF completely, the walls of the chan-nel need to be rendered neutral. In silica chanchan-nels, this ought to be achievable by coating the walls with a compound such as trimethylchlorosilane, to end-cap all terminal silanol groups. However, in practice, it is impossible to eliminate all EOF since residual surface charge remains. Since many microsystems are now being constructed from polymeric substrates, EOF normally does not occur to any appreciable extent. This is due to the absence of ionizable or charged surface groups. In this situation, EOF could be in-duced by coating the walls of the channel with a charged compound, such as cetyltrimethylam-monium bromide.
Practical Considerations
Perhaps the key practical consideration is whether integrated on-chip detection will be employed, or whether the separated compounds will be transferred to another device, such as a mass spectrometer. In
a similar context to conventional capillary electro-phoresis separations, on-chip detection is the ideal option, since it minimizes dispersion and the dead volume associated with the transfer of analytes from the chip to a detector. The dead volume will normally be far in excess of the separation volume, thus band broadening will be a serious problem.
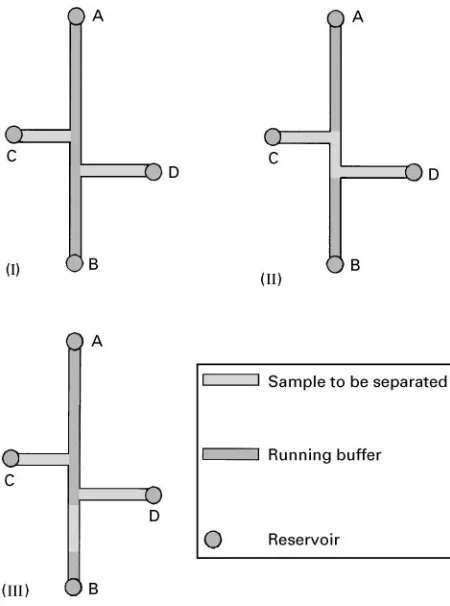
The other key issue is sample introduction. The simplest system relies on the EOF to introduce the sample into the separation capillary. Consider the channel arrangement in Figure 4. The channels are etched into silica, and no deactivating treatment is applied. Under normal conditions (I), the applied voltage between reservoirs A and B induces EOF. In addition, the potentialReld gradient will give rise to electrophoretic separations.
Since only buffer isSowing, this does not give rise to any apparent separation effect. When the voltage is manipulated such that it is now between reservoirs C and D (II), EOF is induced between the reservoirs, thus the sample is introduced, and occupies a small section of the main channel. Once the voltage is restored between A and B, the separation step begins (III). Here, the sample is moved by the EOF towards reservior D, and separation occurs due to elec-trophoretic mobility.
Figure 4 Sample introduction into the separation channel. (I) When the voltage is applied between reservoirs A and B, the separation channel is filled with running buffer. (II) To inject a sample, the voltage is applied between C and D: the sample moves into a short section of the separation channel. (III) With the voltage restored across A and B, the sample moves along the separation capillary, and separation occurs.
and nondiscriminatory route for sample introduction. This can be achieved by either applying pressure to one reservoir in order to force the analyte through the system, or by deformation of the chip (in situations where the polymer isSexible). In either case, a valve-less injection method is used; this greatly simpliRes the operational aspect of these systems.
Applications
In this section, several types of application will be considered. While much of the discussion will be related to the separation of compounds on chips using electrophoresis, it is impossible to neglect the poten-tial of EOF alone forSuid mobility, which is unaffec-ted by back-pressure.
Electrophoretic Separations
Much of the literature available on chip-based trophoretic separations features capillary zone
elec-trophoretic (CZE) separations; however, there are many other types of separation possible, such as iso-tachophoresis and electrokinetic focusing.
Perhaps the simplest applications are based on CZE within silica microchannels. Here EOF and elec-trophoretic mobility can be utilized, the EOF for injection and bulkSow of solutions through the capil-lary, and electrophoretic mobility for the actual sep-aration process. A typical sepsep-aration capillary would be 50 mm long, 45m wide and 8m in depth, with an applied potential in the range 600}1200 V along the 50 mm length. The types of samples that can be separated by this technique are extensive (not surpris-ing, given the diversity of the applications for conven-tional CZE) but include small anions and cations, monoclonal antibodies, theophylline and DNA frag-ments. There are a number of potential detectors, but those based on optical or electrochemical methods are the most frequently used.
Electrochemical detection can easily be incorpor-ated on to a microchip, but requires the detector to be located after the high voltage section of the channel. This is necessary to prevent the high voltage causing interference with the detection. This can be achieved in such a system as described above, by locating the electrochemical detector in the channel just after the ground electrode. The EOF occurring in the channel
would pump the Suid along the channel from the
ground electrode to the detector electrodes. Over this short region, band broadening should not pose a sig-niRcant problem. It is similar in principle to the por-ous junction technique widely used in conventional CE. It is possible to achieve limits of detection of micromolar levels or better with electrochemical detection.
Spectroscopic methods fall into two main classes
}absorbance andSuorescence. Absorbance
measure-ments are simple to effect, but commonly suffer from relatively low sensitivity. This is primarily due to the channel dimensions resulting in a very small path length. Measurements across a 50m channel would give rise to a very small absorbance, since absorbance is proportional to path length. It is possible to in-crease the path length (Figure 5), but absorbance measurements do not have the sensitivity ofS uores-cence measurements, although they are generally ap-plicable to a wider range of analytes. In addition, for practical reasons, dual-channel systems are not easily set up and this can lead to instability in the detector signal.
Figure 5 UV detection can be made more sensitive by increas-ing the path length of the measurement. When the absorbance of the analytes is measured across the channel at pointx, the path length is equal to the channel width (typically 50m). By making the measurement at point y, the path length is equal to the channel length (typically 3}5 mm).
channel, in order to minimize the scatter from the walls of the channels. By careful alignment, it is possible to minimize the background, and obtain very sensitive measurements. There are many other detec-tion methods, including optical waveguide sensors and chemiluminescence, but Suorescence detection currently offers the most sensitive analysis.
Similar results can be obtained with channels pro-duced from polymeric support materials. There is one issue that must be addressed with certain materials, e.g. plastics; that is, the backgroundSuorescence that is frequently observed. This can be due to the actual substrate, or the adhesive used to seal the chip. Care-ful selection of materials helps to reduce the problem. However, it is the prospect of the mass production of thousands of chips with hundreds of channels per chip from just one master template that is particularly attractive. Once mass production is achieved, the devices will become truly disposable.
Electrokinetic Induction of Flow
The factor often overlooked with microsystems is the value of EOF for Suidic manipulations. EOF will
occur at potentials of 100}200 V cm\1, and can be
used to drive Suids through channels, and indeed physical objects such as cells, e.g.Escherichia coli. It is possible to transport whole cells around the chan-nels on a microchip. In addition to the EOF, there will also be electrophoretic separations occurring, but in practice, these are small compared to the EOF on uncoated silica surfaces. To be of practical use, it is necessary to have the ability to make meaningful measurements on the contents of the cells. This can be most easily achieved by lysis of the cells with deter-gent. It would then be possible to measure com-pounds, which would otherwise have been trapped within the cell wall. Since the volume of the channels is small, the released compounds will not be extensively diluted, and the time to analysis will be very short; this is particularly important if the aim is to study rates of reaction or unstable com-pounds.
EOF serves to deliver the sample beyond the high voltage area if it is intended to use off-chip detection. For example, to transfer the separated compounds from a separation chip to a mass spec-trometer, EOF can be used to deliver the compounds to an electrospray interface. Indeed, it is possible to generate the electrospray between the terminal end of the capillary and a suitably located conductor, with-out the need to apply a conductive coating to the end of the chip.
The Future
Electrically driven separations on microchips have a number of advantages over conventional CE. The Rrst is the further reduction in reagent consumption, in terms of both sample and buffer solutions. This will reduce the running costs of the system, and also the associated waste disposal costs. Second, as methods to mass-produce the devices become more widespread, the cost will decrease. This will allow totally disposable systems to be used. Finally, perhaps the most important advantage will be the portability of analyser systems, which will be able to be used in remote on-site mode. Without doubt, microtechnol-ogy revolutionized the electronics industry, and it will do the same for much chemical analysis.
to an electrophoretic separation chip is one possible answer. However, there is no reason why reactions cannot be carried out on such devices. Since it does not require the investment of a large chemical plant, the reactions can be performed where required, thus reducing the need to transport hazardous chemicals across countries. Since many reactors can be con-structed on a single chip, and many chips located in the same area, it is evident that this technology will provide hazardous or chemically unstable chemicals where they are required.
Further Reading
Altria KD (ed.) (1996) Capillary Electrophoresis Guide-book,Principles,Operation,and Applications. New Jer-sey: Humana Press.
Harrison DJ and Van den Berg A (eds) (1998)Micro Total Analysis Systems ’98. Dordrecht: Kluwer Academic Publishers.
Haswell SJ (1997) Developments and operating character-istics of microSow injection analysis systems based on electroosmoticSow. Analyst 122: 1Rd1OR.
Manz A and Becker H (1997)Microsystem Technology in Chemical and Life Sciences. Berlin: Springer.
Madou M (1996)Fundamentals of Microfabrication. Boca Raton: CRC.
Martin AJP (1962) Opening lecture. In: Van Swaay M (ed.) Fourth International Symposium on Gas Chromatogra-phy. London: Butterworths.
Oefner PJ, Bonn GK and Chiesa C (1995)Encyclopaedia of Analytical Chemistry, pp. 1041}1152. London:
Aca-demic Press.
Pethig R and Markx GH (1997) Applications of dielec-trophoresis in biotechnology, Trends in Biochemistry 15: 426}432.
Regnier F (1999) The evolution of analysis in life science research and molecular medicine: the potential role for separations. Chromatographia 49: S56dS64.
Tsuda T (ed.) (1995)Electric Field Applications, pp. 47}73.
Weinheim: VCH.
Nonaqueous Capillary Electrophoresis
S. H. Hansen, I. Bj[rnsdottir and J. Tj[rnelund,
Royal Danish School of Pharmacy, Copenhagen, Denmark
Copyright^ 2000 Academic Press
Electrophoresis is a separation technique that is nor-mally performed in an aqueous environment. This is due to the fact that the separation mechanism is based on the difference in migration rate of charged species in an electric Reld. Species (ions/molecules or par-ticles) with a difference in their charge over size ratio will exhibit a difference in migration rate. Most charged species are fairly soluble in aqueous media and thus water is the most obvious solvent for elec-trophoresis. However, in a number of nonaqueous solvent systems, it is possible to obtain sufRcient conductivity to perform electrophoresis. If such sys-tems are utilized with the technique of capillary elec-trophoresis, a number of advantages compared to aqueous systems are obtained in the separation of small molecules. Nonaqueous electrophoresis of bi-opolymers like polysaccharides, nucleic acids and proteins is not of practical use due to lack of solubility of such molecules in organic solvents.
Nonaqueous Capillary Electrophoresis
Only a few attempts to perform nonaqueous paper electrophoresis have been described and these articles
were reviewed in 1978. In 1984 nonaqueous capillary electrophoresis (NACE) was brieSy mentioned in a single publication, but not utilized further. How-ever, since 1993 the use of nonaqueous media for capillary electrophoresis has seen renewed interest in the separation of drug substances due to the high separation selectivity obtained in these systems.
The electrophoretic migration of the solutes is in-Suenced by the nature of the solvent or solvent mix-ture used for the electrophoresis medium in three main ways:
1. The mobility may change due to changes in the size of the solvated ion.
2. The dielectric constant of the organic solvent may inSuence the equilibrium of the protolytic dis-sociation. The higher the value of the dielectric constant, the higher the degree of ionization of acids and bases.
3. The acid}base property of the solute, expressed by
its pKa value, may change due to the differenti-ating effect of many organic solvents.
The latter effect of the three is the most signiRcant, as the dissociation constant, Ka, may change many orders of magnitude for different solvents.