Munich Personal RePEc Archive
Estimating and Forecasting Conditional
Volatility and Correlations of the Dow
Jones Islamic Stock Market Index Using
Multivariate GARCH-DCC
Omer, Gamal Salih and Masih, Mansur
INCEIF, Malaysia, INCEIF, Malaysia
26 August 2014
1
Estimating and Forecasting Conditional Volatility and Correlations of the Dow
Jones Islamic Stock Market Index Using Multivariate GARCH-DCC
G
amal Salih Omer
1and Mansur Masih
2Abstract
2
volatility decay. The t-distribution appears to be more appropriate in capturing the fat-tailed nature of the distribution of stock returns and the conditional correlations of returns of all Dow Jones Islamic Markets, Dow Jones Islamic UK, and Dow Jones Islamic US Indices with other indices are not found constant but changing. The policy implications of this finding are that the shariah investors should monitor these correlations and mange their investment portfolios accordingly. In addition to this, the different financial markets offer different opportunities for portfolio diversification.
______________________________
Keywords: conditional volatility and correlations of Islamic assets, forecast, MGARCH-DCC
______________________________
1
Ph.D. research student, INCEIF, Lorong Universiti A, 59100 Kuala Lumpur, Malaysia.
2Corresponding author, Professor of Finance and Econometrics, INCEIF, Lorong Universiti A, 59100 Kuala Lumpur,
Malaysia. Email: [email protected]
________________________________________
1. Introduction
The recent global financial crisis has exerted enormous negative impacts on conventional institutions and markets. Hence, a need has been felt for exploring alternatives to conventional financial practices that allow reducing investment risks, increasing returns, enhancing financial stability, and reassuring investors and financial markets. Given this, following the crisis, one has unobserved a renewed interest in Islamic finance, based on Sharia rules, as an approach that might cover products and instruments driven by greater social responsibility, ethical and moral values, and sustainability, and hence, may be better safeguarded against financial crises.
The Islamic financial system is based on the fundamentals of Shari‘ah (Islamic Law) that requires gains from investments to be earned in an ethical and socially responsible manner that comply with teachings of Islam (DeLorenzo, 2000). Equities traded under Shari‘ah indices undergo a screening process to ensure they are free from prohibitive elements as
3
compliant investors to evaluate or screen whether a particular company is halal (lawful) or haram (unlawful) for investment (Wilson, 2004; Derigs and Marzban, 2008). There two types of screening, namely:
(I) Qualitative screens: this screening process focuses on the activity of a company that is used as the main principle in Islamic investment criteria. For a company that does not comply with Shariah principles, for example, a company involves in production of alcohol for drinking, gambling, entertainment, and riba-based financial institutions, then, investment in this type of company is prohibited.
(II) Quantitative screens: this screening process refers to three financial parameters of a company, namely:
(1) Debt/equity ratio. If a company‘s debt financing is more than 33 percent of its capital,
then it is not permissible for investment.
(2) Interest-related income. If interest-related income of a company is more than 10 percent of its total income, then it is not permissible for investment. This income, however, should not come from its main business activities but from placing its surplus funds in investments that could yield interest income (Abdul Rahman et al,. 2010).
(3) Monetary assets. This parameter refers to the composition of account receivables and liquid assets (cash at banks and marketable securities) compared to total assets. Various minimums have been set for the ratio of non-liquid assets (assets that are not in the form of money) necessary to make an investment permissible. Some set this minimum at 51 percent while a few cite 33 percent as an acceptable ratio of non-liquid assets to total assets.
Islamic banking and finance is no longer an uncertain experiment. Even though Islamic banking and finance is in its infancy—only forty years old compared to the four-hundred-year old conventional banking and finance industry—it currently is booming. Increasing
demands for tools to measure Shari‘ah compliant investments from both Islamic and non -Islamic investors are rapidly impacting the financial services industry as a whole. And Dow Jones Indexes has been in the forefront of meeting this demand. The choice of the DJIM is justified by the fact that it is the most widely used and most comprehensive representative time series for the Islamic stock market ( Hammoudeh et al., 2013)
Dow Jones Indexes launched the Dow Jones Islamic Market Index [DJIMSM] in 1999, in Manama, Bahrain. It was the first attempt by any global index provider to create a
measurement tool for Shari‘ah-compliant investors and to reduce the research costs of
ascertaining and measuring Shari‘ah-compliance by creating a global universe of Shari‘ah
4
who outsource Shari‘ah screening to pre-existing Shariah boards to minimize expenses, Dow Jones Indexes made the financial and quality commitment to organize its own Shari‘ah supervisory board for the purpose of advising on the DJIM Indexes. The DJIM Shari‘ah supervisory board serves much like a board of directors for the Index on Shari‘ah compliance. As the first such index and due to its unique characteristics, the DJIM has become the initial standard of Shari‘ah-compliant investing in Muslim countries, offering incentive for companies to meet the standards of Dow Jones Indexes‘ DJIM methodology screens to be included in a high-profile Shari‘ah-complaint index. The DJIM screens have since been adopted by the Auditing & Accounting organization of Islamic Financial Institutions [AAOIF].
Volatility is a measure of variability in the price of an asset and is associated with unpredictability and uncertainty about the price. Even it is a synonym for risk; higher volatility means higher risk in the respective context. With regard to stock market, the extent of variation in stock prices is referred to stock market volatility. A spiky and rapid movement in the stock prices may throw out risk averter investors from the market. Hence a desired level of volatility is demanded by the markets and its investors. The traditional methods of volatility analysis never considered the effect of conditional volatility, time varying volatility. Appropriate modelling of volatility is of importance due to several reasons:
(i) When volatility is interpreted as uncertainty, it becomes a key input to many investment decisions and portfolio creations. Given that, investors and portfolio managers have certain bearable levels of risk, proper modelling (and forecasting) of the volatility of asset prices over the investment holding period is of paramount importance in assessing investment risk; (ii) Volatility is the most important variable in the pricing of derivative securities. To price an option, one needs to know the volatility of the underlying asset from now until the option expires;
(iii) Financial risk management has taken a dominant role since the first Basle Accord was established in 1996, making proper modelling (and forecasting) of volatility a compulsory risk-management exercise for financial institutions around the world.
5
has implications for portfolio selection, the pricing of derivative securities and risk management.
A major issue facing the investors in the contemporary financial world is how to minimize risk while investing in a portfolio of assets. An understanding of how volatilities of and correlations between asset returns change over time including their directions (positive or negative) and size (stronger or weaker) is of crucial importance for both the domestic and international investors with a view to diversifying their portfolios for hedging against unforeseen risks as well as for dynamic option pricing.
In modern portfolio theory, the main theme advocates investors to diversify their assets across national borders, as long as returns to stock in these other markets are less than perfectly correlated with the domestic market. It is well established that greater diversification benefits exist the less correlated the markets are. Generally, there are two popular measures of diversification benefits: gain in expected returns and reduction in risk. An understanding of how volatilities of and correlations between asset returns change over time including their directions (positive or negative) and size (stronger or weaker) is of crucial importance for both the domestic and international investors with a view to diversifying their portfolios for hedging against unforeseen risks. Lower international correlation across stock markets is the starting place of global portfolio diversification strategy (Solnik, 1974). If correlations between stock returns are high, a loss in one stock is likely to be accompanied with another loss in other stock markets as well. Therefore, benefits of diversification are higher if the correlation between the stock returns is low or negative. Hence, an increase in co-movements between asset returns of international stock markets can therefore diminish the advantage of internationally diversified investment portfolios (Ling and Dhesi, 2010). It has been further identified in literature that correlations amongst markets are evolving through time due to changes in interdependence across markets (Engle, 2002). Moreover, market returns are not only time varying, but may also be dependent on time scales highlighting the importance of investment horizons (Gencay et al, 2001).
6
remained inconclusive with results reporting contradicting evidence. Hence this subject needs further investigation.
These reasons motivate this study to focus on selected global Dow Jones Conventional and Dow Jones Islamic indices through applying Multivariate GARCH to estimate DCC. The unique contributions of the paper which enhance existing literature are in empirically testing
for the ‗time-varying‘ volatilities and correlations of the selected sample of Dow Jones indexes. Therefore, in this paper, we aim to estimate and forecast conditional volatility of and correlations between daily returns of the selected Dow Jones Islamic price indexes and as a proxy of Dow Jones non – Islamic indexes through the application of the recently-developed Dynamic Multivariate GARCH approach to investigate the following empirical questions: i. Are the time-varying volatility parameters of these selected Dow Jones stock indices they decaying or not?
ii. Are these volatility parameters mean-reverting?
iii. Are the conditional volatilities and conditional correlations between these indices are time
– varying or constant?
v. Are the conditional volatilities and conditional correlations between these selected can be forecasting?
vi. Does the exclusion of conventional indices impact the benefit of portfolio diversification for the UK and US shariah investors?
Our empirical results indicate that:
The t-DCC estimation procedure is applied to a portfolio composed of seven Dow Jones indices returns, over the period 02 January 2003 to 31 Jan 2013, split into an estimation sample (12003 to 2010) and an evaluation sample (2011 to 2013). The results strongly reject the normal-DCC model in favour of a t-DCC specification. The t-DCC model also passes a number of VaR diagnostic tests over the evaluation sample.
7
The rest of the paper is organized as follows: Section 2 provides a brief description of the literature review. Following this, a brief description of the methodology is given in section 3. While Section 4 presents the data and the empirical results with their interpretation in the views of the author. Finally, the concluding remarks with the policy implications are given in Section 5.
2. Literature Review
Modern portfolio theory championed by Markowitz states that, amongst other things, ―when we hold diversified portfolios, the contribution to portfolio risk of a particular security will depend on the covariance of that security‘s return with those of other securities, and not the
security‘s variance‖ (Bodie et al. 2009).
If assertions of the Capital Asset Pricing Model (CAPM) hold true in equity markets, equity returns only reflect systematic risk. The underlying assumption is that investors are fully diversified in their respective portfolios.
These theories were followed by a considerable number of empirical studies that attempted to test the validity of the international portfolio diversification by analysing the levels of interdependence and linkages across national stock markets. One of the earliest empirical papers by Agmon (1972), using weekly returns data, found no significant linkages amongst the common stocks of Germany, Japan, the UK and the USA and hence supports the idea of international portfolio diversification. However, the stock markets crash of 1987 provided new insights into the literature of financial markets interdependence which contradicted past theories and empirical results. Among these studies, such as studies by Eun and Shim (1989), Von Furstenberg and Jeon (1989), Bertera and Mayer (1990), examined various stock price indices around the stock market crash of 1987 and found a substantial amount of interdependence among national stock markets.
Many recent studies have empirically tested and provided evidence that the correlations across national markets may not be constant and are evolving through time. For e.g. Yang (2005) examined the international stock market correlations between Japan and the Asian Four Tigers (Taiwan, Singapore, Hong Kong, and South Korea) and found that stock market correlations fluctuate widely over time and volatilities appear to be contagious across markets. In addition, correlations increase during periods of high market volatilities when risk diversification is needed most, and that is bad news for international diversification
8
Despite the surge in Islamic financial assets, and expanding reach of Islamic financial institutions and instruments geographically over the past two decades the literature on Islamic stock markets is scarce. There have been efforts to study the performance of capital market related investment products at firm level. Empirical efforts to analyse the interdependence and performance of the Islamic stock indices across the globe have been rather a recent phenomenon, mainly due to the increased interest in the area of Islamic banking and finance. Among these studies, Hakim and Rashidian (2004) attempted to study the returns performances of the Dow Jones Islamic Market Index (DJIM), Dow Jones World Index (DJW) and Dow Jones Sustainability World Index (DJS). Using a capital asset pricing model (CAPM) framework, they found that DJIM has done relatively well compared to the DJW, but has underperformed the DJS. Hussein (2005) analysed the DJIM returns for the period 1996 to 2003 and found that Islamic indexes provide investors with positive abnormal returns throughout the entire bull period, but they under-perform their non-Islamic index counterparts during the bear market period. Achsani et al (2007) in general finds that the interdependence of the Islamic stock markets tends to be asymmetric across a wide geographical area. While there are strong correlations between the Islamic stock indices of Indonesia and Malaysia, the US and Canada, and Japan and Asia Pacific, this is not exactly the case for across the region basis. In addition, the study found that the Islamic stock market in the US has a strong influence on the other Islamic stock markets, while the reverse is not true. In particular, the Indonesian, Malaysian, Canadian and Asia Pacific stock markets have smaller effects on the
US‘ Islamic stock market. In contrast to the earlier study, Aziz and Kurniawan (2007)
conclude that there are potential diversification benefits for investors considering the Islamic stock markets in Indonesia and Malaysia. In particular, detailed empirical investigation using recent econometric analysis found that the Jakarta Islamic Index and the Kuala Lumpur
9
Buerhan Saitiet.al (2013), analyze the daily returns of five Shariah-compliant stock indices (such as, FTSE Shariah China Index, FTSE Shariah India Index, FTSE Sharia USA index, FTSE Malaysia EMAS Shariah Index and Dow Jones Shariah Index) covering the period from 26 October 2007 to 9 March 2011, they found that dynamic conditional volatilities and conditional correlations of all these Shariah indices are not constant but are changing and time-varying. Moreover, there is relatively low and even at times negative dynamic conditional correlation between FTSE Shariah China index and FTSE Shariah USA index. Sania Ashraf. P.P1 & Malabika Deo2(2013) investigates the nature and behaviour in Shariah market of GCC countries with daily returns spanning from 01/12/2008 to 31/08/2013 employed GARCH (1, 1), E- GARCH (1, 1) and T- GARCH (1, 1) , they found that past volatility highly influences the current volatility of all the series under study. Possibly a few studies have been done using multivariate GARCH model to estimate Dynamic Conditional Correlations and variances at equity indices level in Islamic finance.
3. Methodology
3.1 Multivariate GARCH – Dynamic Conditional Correlation
One of the earliest volatility models, autoregressive conditional heteroscedastic (ARCH), was proposed by Engle (1982) which captured the time-varying conditional variances of time series based on past information. This model was then enhanced by Bollerslev (1986) who proposed a generalized ARCH (GARCH) which took into account both past error terms and conditional variances into its variance equation simultaneously to avoid the problem that the number of parameters to be estimated becomes too large as the number of lagging periods to be considered increases in the ARCH model. Bollerslev (1990) further extended the GARCH model in a multivariate sense to propose a Multivariate GARCH – Constant Conditional Correlation (MGARCH- CCC) model where the conditional correlations amongst different variables were assumed to be constant. The MGARCH-CCC model only allows the variances of each variable to be time varying while keeping the correlation coefficient among them constant. However, while the CCC assumption makes estimation simple, it may be inconsistent with reality (Longin and Solnik, 1995, 2001). Therefore, Engle (2002) finally proposed an M-GARCH-DCC model where the conditional correlations amongst variables were allowed to be dynamic.
10
returns such as, the forward and futures returns of various maturities are substitutes or complements in terms of taking risk.
Motivation behind the Dynamic Conditional Correlation (DCC) Model:
. DCC allows for the analysis of time variation in both mean and variance equation.
Whereas, Rolling Regressions and Kalman Filters are intended to examine time varying relationships entered only in the mean equation.
DCC allows us to look at how correlations change over time. DCC approach follows ARCH model solution to modeling the evolving nature of volatility. Specifically,
ARCH models estimate a weighted average of a variable‘s entire history of volatility
with more weight given to the recent past and less weight given to the long past observations. Similarly, the DCC model estimates a weighted average of correlations that incorporates the entire history of a relationship between variables.
The DCC approach allows series to have periods of positive, negative, or no correlation. Thus both direction and strength of the correlation can be considered. When two series move in the same direction, the correlation increases and is positive. When they move in the opposite directions, the correlation is decreased and may become negative.
The DCC approach allows asymmetries, meaning that the weights are different for positive and negative changes to a series, which is an insightful advantage of this model.
The DCC approach is well suited for situations where the model structure is well known. This model is not advisable when the series are very short. Relative advantages of DCC are reduced when time varying volatility is not an issue.
DCC estimation involves 2 steps:
(i) Univariate volatility parameters are estimated by using GARCH models for each of the variables. So if there are two variables, then two GARCH equations are estimated. Just as an example,
ℎ𝑡 = ∁0+ 𝑏1ℎ𝑡−1+𝑏2ℎ𝑡−2+𝑚1 ∈𝑡−2 1 𝐼 ∈> 0 (GJR, 1993 Asymmetric GARCH equation)
11
(ii) The standardized residuals (εt) from the first step are used as inputs for estimating a time -varying correlation matrix (by estimating DCC equation parameters).
Ht = Dt Rt Dt
Here:
Ht: Conditional covariance matrix
Dt: Diagonal matrix of conditional time varying standardized residuals that are obtained from the univariate GARCH models (on-diagonal elements or variance or volatility component) Rt: Time varying correlation matrix (off-diagonal elements)
The likelihood of the DCC estimator is written as:
𝐿 = −0.5 (k log 2π T
t=1
+ 2 log Dt + log Rt +ϵt′R−t1ϵt )
(a) In the first step, only the volatility component (Dt) is maximized; i.e. the log likelihood is reduced to the sum of the log likelihood of univariate GARCH equations.
(b) In the second step, correlation component (Rt) is maximized (conditional on the estimated Dt) with elements εtfrom step 1. This step gives the DCC parameters, α and β,
𝑅𝑡 = 1−∝ −𝛽 𝑅 +𝛼𝜀𝑡−1𝜀𝑡−1 +𝛽𝑅𝑡−1 (DCC Equation)
If α =β=0, then Rt is simply and CCC model is sufficient. The models have GARCH-type dynamics for both the conditional correlations and the conditional variances. The time-varying conditional variances can be interpreted as a measure of uncertainty and thus give us insight into what causes movement in the variance.
The two-step estimation of the likelihood function is consistent, albeit inefficient (Engle and Sheppard, 2001). The DCC allows asymmetries, meaning the weights are different for positive and negative changes to a series. The asymmetries are in the variances (not in the correlations) (Cappiello, Engle and Shephard, 2003).
Conditional correlation is a forecast of the correlation that would be appropriate next period
conditional on this period‘s data. Therefore the uncertainty in this forecast (assuming
correctly specified model) is simply due to only parameter uncertainty.
Bollerslev (1990) assumed that the conditional variance for each return, hit (i=1, …, m)
follows a univariate GARCH process, that is, CCC specification:
12
Where
𝑎
𝑖𝑗 represents the ARCH effects or short-run persistence of shocks to return j and𝛽
𝑖𝑗 represents the GARCH effects, or contribution of shocks to return i to long-runpersistence.
CCC specification above assumes independence of the conditional variances across returns and does not accommodate asymmetric behavior.
In order to accommodate the asymmetric impacts of positive and negative shocks, Glosten et al. (1992) proposed the asymmetric GARCH or GJR specification for the conditional variance, which for r=s=1, is given by:
ℎ
𝑖𝑡=
𝑤
𝑖+
∝
𝑖∈
𝑖2,𝑡−1+
𝑌
𝑖𝐼
𝑖,𝑡−1∈
2𝑖,𝑡−1+
𝛽
𝑖ℎ
𝑖,𝑡−1(Asymmetric Conditional Variance Model)
Where,
𝐼
𝑖𝑡 is an indicator function to distinguish between positive and negative shocks on conditional volatility.In order to capture the dynamics of time-varying conditional correlation Гt, Engle (2002) and Tse and Tsui (2002) proposed the following DCC model:
Г
𝑡=
1
− 𝜃
1− 𝜃
2Г
+
θ
1h
t−1+
θ
2Г
t−1In which 𝜃1 and 𝜃2 are scalar parameters to capture the effects of previous shocks and previous dynamic conditional correlations on current DCC.
DCC is a popular estimation procedure which is reasonably flexible in modeling individual volatilities and can be applied to portfolios with a large number of assets (Pesaran and Pesaran, 2007). To capture the fat-tailed nature of the distribution of asset returns, it is more appropriate if the DCC model is used with a multivariate t-distribution, especially for risk analysis where the tail properties of return distributions are of most concern. Engle (2002) suggested that the log-likelihood function of the DCC model can be maximized by using a two step procedures. This procedure, however, will no longer be applicable to such a t-DCC specification and a simultaneous approach to the estimation of the parameters of the model which includes the degrees of freedom parameter of the multivariate t distribution would be needed (Pesaran and Pesaran, 2007) .
The standardized returns used by Engle (2002) are as follows:
𝑍
𝑖𝑡=
𝜎
𝑟
𝑖𝑡 𝑖,𝑡−1𝜆
𝑖13
(i) The Individual GARCH (1,1) models are fitted to the ‗m‘ asset returns separately, and then,
(ii) The coefficient of the conditional correlations, θ, is estimated by Maximum Likelihood Estimator (MLE) (assuming that asset returns are conditionally Gaussian).
This procedure has two main drawbacks:
(i) The Gaussianity assumption does not hold for daily returns and its use can under-estimate the portfolio risk
(ii) The two-stage approach is likely to be inefficient (although consistent) even under Gaussianity.
Pesaran, therefore, proposes an alternative formulation of conditional correlations ( 𝜌 𝑗,𝑡−1 ) (
∅) that makes use of realized volatilities. Pesaran estimates correlations based on devolatized returns that are nearly Gaussian.
ȓ
𝑖𝑡=
𝜎
𝑟
𝑖𝑡 𝑖𝑡𝑟𝑒𝑎𝑙𝑖𝑧𝑒𝑑=
𝑟
𝑖𝑡𝜎
𝑖𝑡𝜌
For daily returns a value of p=20 tends to render 𝑟 𝑖𝑡 nearly Gaussian.
The t-DCC estimation procedure was applied to a portfolio composed of six currency futures, four 10 year government bonds and five equity index futures over the period 02 January 1995 to 31 December 2006 by Pesaran and Pesaran (2007). They found that the results strongly reject the normal-DCC model in favor of a t-DCC specification. There has been a general trend towards a lower level of volatility in all markets, with currency futures leading the way.
Tests of Mean-Reversion:
In the empirical applications we shall consider the mean reverting as well as the non-mean reverting specifications, and experiment with the two specifications of the conditional correlations that are based on standardized returns.
The decomposition of Ht allows separate specification of the conditional volatilities and conditional cross asset returns correlations. For example, one can utilize the GARCH (1,1) model for the variance 𝜎𝑖2,𝑡−1, namely
𝑉 𝑟
𝑖𝑡𝛺
𝑡−1=
𝜎
𝑖2,𝑡−1=
𝜎
𝑖21
− 𝜆
1𝑖− 𝜆
2𝑖+
𝜆
1𝑖𝜎
𝑖2,𝑡−2+
𝜆
2𝑖𝑟
𝑖2,𝑡−1Where, 𝜎 𝑖2is the unconditional variance of the ith stock return.
14
A more general mean reverting specification is given by
𝑞
𝑖𝑗,𝑡−1=
𝜌
𝑖𝑗1
− 𝜆
1− 𝜆
2+
𝜆
1𝑞
𝑖𝑗,𝑡−2+
𝜆
2𝑟
𝑖,𝑡−1𝑟
𝑗,𝑡−1Where𝜌 𝑖𝑗, is the unconditional correlation between𝑟𝑖𝑡𝑎𝑛𝑑𝑟𝑗𝑡𝑎𝑛𝑑𝜆1+𝜆2 < 1 . One would
expect
𝜆
1+
𝜆
2 to be close to 1 in order to be non-mean reverting (does not come back tothe mean or equilibrium). The non-mean reverting case can be obtained when
𝜆
1+
𝜆
2= 1
. Therefore, in order to test the existence of non-mean reversion, we need to put a restriction of𝜆1+𝜆2 = 1.
4. Data and the empirical results & Interpretations
The data set used in this study consist of selected Dow Jones Islamic and Non-Islamic which includes, DJIM Europe , DJ Islamic US , DJ Islamic , DJ Islamic UK, DJ Islamic World Emerging Markets., DJGL World $, and D J Composite 65 Stock Ave– Price Indices to estimate their conditional volatility and correlations between them. Five out of the seven are global Islamic indices and tow is global conventional indices. All the data required is derived solely from Dow Jones Indices family to allow for a level of homogeneousness in conventional indices, in both the underlying universe of stocks and calculation of index pricing. The rule of homogeneity applies for Islamic indices as well, providing us with a consistent shariah screening methodology.
Daily returns of Indices spanning from 01/1/2003 to 31/3/2013. The sample period from January 30, 2003 to December, 13, 2010 amounting to 2053 daily observations are used for estimation and the remaining sample period is used for evaluation. The stock prices were converted into returns as;
Rt = [Loge (Pt) - Loge (Pt-1)]*100
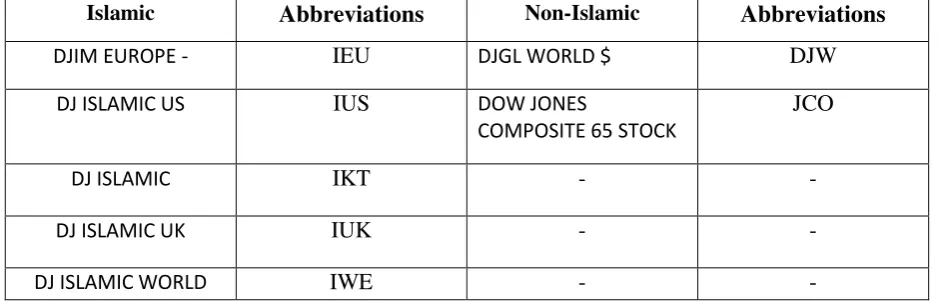
[image:15.595.64.534.606.757.2]. The indices that have been used and their abbreviations are shown in the following table:
Table 1: Selected Dow Jones Indices
Islamic Abbreviations Non-Islamic Abbreviations
DJIM EUROPE - IEU DJGL WORLD $ DJW
DJ ISLAMIC US IUS DOW JONES
COMPOSITE 65 STOCK
JCO
DJ ISLAMIC IKT - -
DJ ISLAMIC UK IUK - -
15 EMERGING MKTS.
4.2. ML GARCH Estimates of the Gaussian DCC and of the t-DCC models on the seven
selected Dow Jones Islamic and Non Islamic Indices Daily Returns
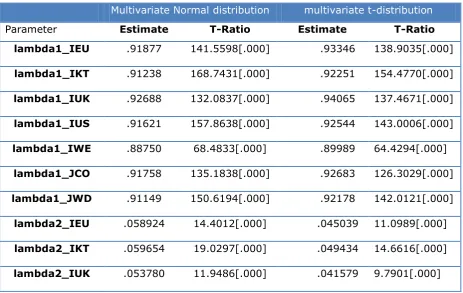
Table 2 summarises the maximum likelihood estimates of λi1 and λi2 for the seven selected of Dow Jones indices returns, and δ1 and δ2, comparing multivariate normal distribution with multivariate student t-distribution. From table 2 we observe that the highly significance
estimates of all the volatility decay parameters and the values of λi for I =1, 2,…,7 are very closed to unity which implying gradual volatility decay for all indices. Also from Table 2, it is observed that the maximized log-likelihood value for t-distribution -7331.7is larger than the maximized log likelihood under normal distribution -7553.1. This suggests that the student t-distribution is a more appropriate representation of the fat tailed nature of indices. This observation is in agreement with findings of Pesaran & Pesaran (2009). To further substantiate this we observe the degree of freedom which is 10.3495, well below the critical level of 30 and any other value one would expect for a multivariate normal distribution. These conclusions are robust to the way returns are standardized for computation of cross asset return correlations. Henceforth our analysis of the study works with the t-distribution
[image:16.595.67.531.461.754.2]estimates.
Table 2: ML GARCH Estimates of the Gaussian DCC and of the t-DCC models
Multivariate Normal distribution multivariate t-distribution
Parameter Estimate T-Ratio Estimate T-Ratio
lambda1_IEU .91877 141.5598[.000] .93346 138.9035[.000]
lambda1_IKT .91238 168.7431[.000] .92251 154.4770[.000]
lambda1_IUK .92688 132.0837[.000] .94065 137.4671[.000]
lambda1_IUS .91621 157.8638[.000] .92544 143.0006[.000]
lambda1_IWE .88750 68.4833[.000] .89989 64.4294[.000]
lambda1_JCO .91758 135.1838[.000] .92683 126.3029[.000]
lambda1_JWD .91149 150.6194[.000] .92178 142.0121[.000]
lambda2_IEU .058924 14.4012[.000] .045039 11.0989[.000]
lambda2_IKT .059654 19.0297[.000] .049434 14.6616[.000]
16
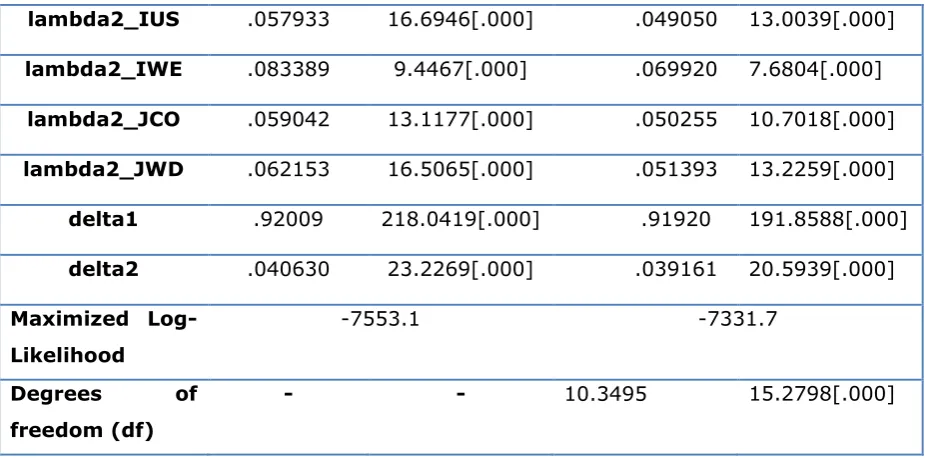
lambda2_IUS .057933 16.6946[.000] .049050 13.0039[.000]
lambda2_IWE .083389 9.4467[.000] .069920 7.6804[.000]
lambda2_JCO .059042 13.1177[.000] .050255 10.7018[.000]
lambda2_JWD .062153 16.5065[.000] .051393 13.2259[.000]
delta1 .92009 218.0419[.000] .91920 191.8588[.000]
delta2 .040630 23.2269[.000] .039161 20.5939[.000]
Maximized
Log-Likelihood
-7553.1 -7331.7
Degrees of
freedom (df)
[image:17.595.67.532.67.299.2]- - 10.3495 15.2798[.000]
Table 3 shows the estimated unconditional volatilities (diagonal elements) are in red colure and the unconditional correlations (off-diagonal elements) of the seven selected Dow Jones indices.
In table 3 below a cursory glance at the diagonal element which representing the unconditional volatilities show the highest volatility for the Dow Jones Islamic UK (IUK) which approximately is 1.5259 and the lowest volatility for the Dow Jones Islamic Market which is equal to 1.0853.
Unconditional volatilities of the seven indices returns are very high which rank between 1.0853 and 1.5259, which implies that returns on those seven selected indices are, overall, more volatile. Furthermore, we could see that Dow Jones Islamic market and Dow Jones World Price index are relatively less volatile compared to other Dow Jones Islamic and Dow Jones Composite Stock Indices. In term of unconditional correlations among the selected indices, a cursory examination of the unconditional correlations reported in Table 3, it appears that the highest correlations is between Dow Jones Islamic Market (IKT) and Dow Jones World (JWD) which amount to .97999 and the lowest one appears between Dow Jones Islamic World Emergency (IWE) and Dow Jones Composite 65 Stock (JCO) which amount to .39147 implying the benefit of international portfolio diversification.
Table 3: Estimated Unconditional Volatility & Correlation Matrix for the 7 Selected Dow Jones Indices
[image:17.595.67.530.70.299.2]17
1.4491 .80023 .95994 .51716 .68236 .49014 .82549
IKT .80023 1.0853 .76702 .90283 .68795 .85328 .97999
IUK .95994 .76702 1.5259 .49503 .65663 .46750 .78662
IUS .51716 .90283 .49503 1.2547 .41449 .95123 .84852
IWE .68236 .68795 .65663 .41449 1.3667 .39147 .72440
JCO .49014 .85328 .46750 .95123 .39147 1.2588 .82826
JWD .82549 .97999 .78662 .84852 .72440 .82826 1.0924
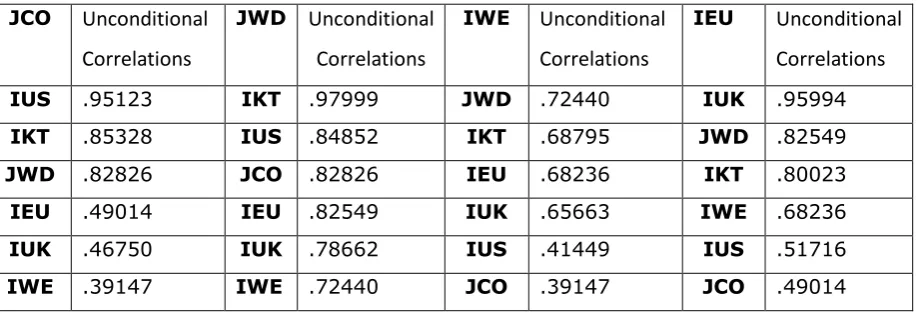
To have a clear picture of the relative correlation among Shariah indices, we ranked the unconditional correlations as in table 4 below (from highest to lowest).
The rankings indicate some interesting facts. Firstly, almost both Non- Islamic Indices have low correlations with the Dow Jones Islamic Europe Index (IEU) and high correlations with Dow Jones Islamic Markets (IKT) and Dow Jones Islamic US (IUS). Secondly, Dow Jones Islamic Europe shows that it has relatively high correlation with Dow Jones Islamic UK (IUK) index. These imply that in order to fully benefit from portfolio diversification, portfolios should include IWE. Last Dow Jones Islamic UK Index has relatively high correlation with Dow Jones Islamic Europe (IEU). An investor inside of UK must be careful when he/she selects portfolios.
From an USA investor‘s perspective, we notice that there is relatively low correlation
[image:18.595.72.531.583.740.2]between Dow Jones Islamic USA Index and Dow Jones Islamic Emergency (IEW) and Dow Jones Islamic Europe Islamic stock). It is a concern for the investors as any movement in the return of either of the two indices causes the other to move in the opposite direction and hence portfolio diversification benefit could be achieved by an USA investors..
Table 4: Unconditional Correlations Ranked by Value in descending order
JCO Unconditional
Correlations
JWD Unconditional
Correlations
IWE Unconditional
Correlations
IEU Unconditional
Correlations
IUS .95123 IKT .97999 JWD .72440 IUK .95994
IKT .85328 IUS .84852 IKT .68795 JWD .82549
JWD .82826 JCO .82826 IEU .68236 IKT .80023
IEU .49014 IEU .82549 IUK .65663 IWE .68236
IUK .46750 IUK .78662 IUS .41449 IUS .51716
18
Considering that shariah screening criteria, completely removes the conventional financial sector from Islamic indices, the common fallacy is that there should be zero correlation between Islamic indices and Dow Jones World and Dow Jones Composite 65 Stock indices. But our figures disprove this fallacy, the reason being two fold. The first being that shariah screening criteria removes the conventional financial institutions, not Islamic institutions, and with DJW comprising of Muslim economies from ASEAN and Middle East, Islamic banks and financial institutions are amongst the constituent lists of the index. Secondly and more importantly is the inter-linking of all sectors of economies, and heavy dependence of corporations on financial sector for financing. Any crisis in the financial sector spills over and impacts other sectors of economies in the form of high cost and unavailability of funds.
This leads to vicious cycle of enhanced costs, low profitability‘s affecting the intrinsic value and the equity prices of the corporation. This spillover effect is the main reason of the existence of correlation amongst financial services sector indices and Islamic indices.
4.3. Plotting the Estimated Conditional Volatilities and Correlations
Thus far, our analyses and conclusions on volatilities and correlations have been made on an unconditional basis. In other words, we take the average volatility and correlation in the sample period. However, the assumption that volatility and correlation remain constant throughout a period spanning over 10 years does not appeal to intuition. It is more likely that volatility and correlation are dynamic in nature and therefore the Dynamic Correlation Coefficient (DCC) model employed in this paper in order to address this issue.
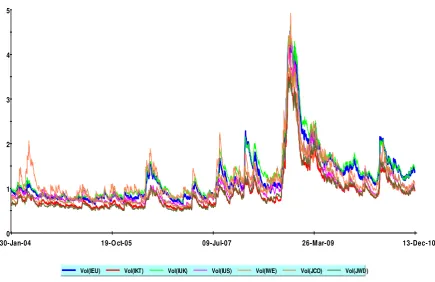
We began with observing the temporal dimension of volatility. We charted the conditional volatilities for the seven sector indices as in the following figure:
19
From the above graph, we can observe that the conditional volatilities of all selected Dow Jones indices returns move more closely together. The convergence of volatilities could reflect the starting of the US financial crisis, particularly during 2008 and 2009 the crisis period, as well as a decline in the patterns there after.
Overall the results show that returns on those seven selected Dow Jones stock indices are stable. This confirms that Shariah-compliant equities Dow Jones Islamic Markets are less volatile than their conventional counterparts, both in times of crisis as well as in times of stability. One reason for this is because excessive financial leverageis prohibited. However this is not held true for individual country Dow Jones Islamic indices.
[image:20.595.96.532.108.390.2]Then we turned our attention to conditional correlations. Firstly, we compared the correlation between Dow Jones Islamic Markets and all others selected Dow Jones indices and the results presented in figure 2 below:
Figure 2: Conditional correlation between Dow Jones Islamic Markets and all others selected
Dow Jones Indices
0 1 2 3 4 5
30-Jan-04 19-O ct-05 09-Jul-07 26-M ar-09 13-Dec-10
Plot of conditional volatilities of all selected Dow Jones Islamic and Non- Islamic indicies
20
.
From the Figure 2, we can see that conditional correlations of returns on Dow Jones Islamic Markets (IKT) Index with others indices are not constant, but are time varying and have been
rising over time. We notice that Dow Jones Islamic Market Index has relatively less correlation with Dow Jones Islamic Emergency Markets (IEW) Index and Dow Jones Islamic UK (IUK)index while relatively high correlation with Dow Jones Islamic US(IUS) and both Dow Jones World (DJW) and Dow Jones Composite 65 Stock (JCO) Indices. This also confirms our results which were presented earlier in table 3. This result suggests that Dow Jones Islamic Market Index is a leading variable in order to detect the return movement of other Dow Jones Indices and moreover, it offer opportunities to the investors to gain from their portfolio diversifications. Also, we notice that the high correlation between returns on Dow Jones Islamic Markets (IKT) and Dow Jones Islamic US (IUS) this may be because of greater influence of Dow Jones Islamic US on Dow Jones Islamic Markets Index.
Secondly, we compared the correlation between Dow Jones Islamic UK and all others selected Dow Jones indices and the results presented in figure 3 below:
Figure 3: Conditional correlation between Dow Jones Islamic UK and all others selected Dow Jones Indices
0.0 0.1 0.2 0.3 0.4 0.5 0.6 0.7 0.8 0.9 1.0
30-Jan-04 19-O ct-05 09-Jul-07 26-M ar-09 13-Dec-10
Plot of conditional correlations between IKT and all other selected Dow Jones Islamic and Non-Islimic Indicies
21
From the Figure 3 above, we can see that conditional correlations of returns on Dow Jones Islamic UK (IUK) Index with others indices are not constant, but are time varying and have
been rising over time also. We notice that Dow Jones Islamic UK Index has relatively less correlation with Dow Jones Islamic Emergency Markets (IEW) Index and Dow Jones Islamic US (IUS)index and Dow Jones World Index while relatively high correlation with Dow Jones Islamic Markets (IKT) and Dow Jones Composite 65 Stock (JCO) Indices. This also confirms our results which were presented earlier in table 3. This result suggests that Dow Jones Islamic UK Index is a leading variable in order to detect the return movement of other Dow Jones Indices and moreover, it offer opportunities to the investors in the UK to gain from their international portfolio diversifications. Also, we notice that the high correlation between returns on Dow Jones Islamic UK (IUK) and Dow Jones Islamic Europe (IEU) this may be because of greater influence of Dow Jones Islamic UK on Dow Jones Islamic Europe Index.
Thirdly, we compared the correlation between Dow Jones Islamic US and all others selected
Dow Jones indices and the results presented in figure 4 below:
Figure 4: Conditional correlation between Dow Jones Islamic US and all others selected Dow Jones Indices
0.0 0.1 0.2 0.3 0.4 0.5 0.6 0.7 0.8 0.9 1.0
30-Jan-04 19-O ct-05 09-Jul-07 26-M ar-09 13-Dec-10
Plot of conditional correlations between IUk and all others selected Dow Jones Islamic and Non- Islamic indicies
[image:22.595.99.487.131.356.2]22
From the Figure 4 above, we can see that conditional correlations of returns on Dow Jones Islamic US (IUS) Index with others indices are slightly stable, and are slightly time varying and have been changing over time also. We notice that Dow Jones Islamic UK Index has relatively less correlation with Dow Jones Islamic Emergency Markets (IEW) Index and Dow Jones Islamic UK(IUK)index and Dow Jones Islamic Europe Index while relatively high correlation with Dow Jones Islamic Markets (IKT) and Dow Jones Composite 65 Stock (JCO) Indices and Dow Jones World. This also confirms our results which were presented earlier in table 3. This result suggests that Dow Jones Islamic US Index is a leading variable in order to detect the return movement of other Dow Jones Indices and moreover, it offer opportunities to the investors in the US to gain from their international portfolio diversifications. Also, we notice that the high correlation between returns on Dow Jones Islamic UK (IUK) and Dow Jones Islamic Markets (IKT) and Dow Jones World and composite Stock Inices this may be because of greater influence of Dow Jones Islamic US on these Dow Jones Islamic and Non-Islamic global Indices.
4.4.1 Testing for Linear Restrictions
-1 0 1 2 3 4 5
30-Jan-04 19-Oct-05 09-Jul-07 26-Mar-09 13-Dec-10
Plot of conditional correlations between IUS and all others selected Dow Jones Islamic and Non- Islamic Indicies
23
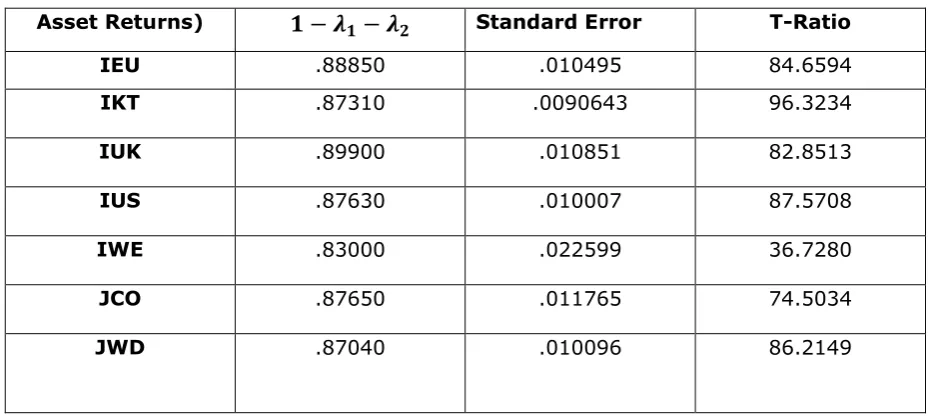
In this section, the focus is on the problem of testing the hypothesis that one of the assets returns has non-mean reverting volatility. That is λi1 and λi2 be the parameters for the conditional volatility equation of the ith asset we wish to test:
: H0: λi1 + λi2 = 1
[image:24.595.64.530.213.422.2]Under H0 the process is non-mean reverting, and the unconditional variance for the asset does not exist.
Table 5: Testing for linear Restrictions
Asset Returns) 𝟏 − 𝝀𝟏− 𝝀𝟐 Standard Error T-Ratio
IEU .88850 .010495 84.6594
IKT .87310 .0090643 96.3234
IUK .89900 .010851 82.8513
IUS .87630 .010007 87.5708
IWE .83000 .022599 36.7280
JCO .87650 .011765 74.5034
JWD .87040 .010096 86.2149
The above result suggests that the assets returns are very slow but statistically significant mean reverting volatility for all indices.
4.4.2 Testing the validity of the t-DCC model
To introduce robustness in our empirical results, we performed the VaR and distribution
diagnostic tests.
The result of LM test statistic for serial correlation on the probability integral transform variable is as follows:
Lagrange Multiplier Statistic CHSQ (12) = 14.8942 [.247] F Statistic F (12,545) = 1.2455 [.248] H0: t-DCC model is correctly specified
H1: t-DCC model is not correctly specified
24
Graph 5: Comparing the empirical cumulative distribution function with that of a uniform
H0:The probability integral transforms are uniformly distributed.
H1: The probability integral transforms are not uniformly distributed.
In the above figure, we can see that the Kolmogorov-Smirnov test statistic is 0.067599, which is greater than 5% critical value. Therefore, we can reject our null hypothesis that the probability integral transforms are uniformly distributed.
4.4.3Testing for VaR Exceptions
[image:25.595.91.507.133.384.2]Testing for VaR exceptions we get the following graph of the VaR of the portfolio for the forecasting period, which shows an increasing pattern during 2011 the first year of the forecasting period, indicating that portfolio risk is likely to increase over time. However, during 2012 the second year of the forecasting period it shows decreasing pattern which indicates diminishing portfolio risk over time.
Table 6: Testing for VaR Exceptions
Estimate Expected value S. Normal T.
Statistic
Mean Hit Rate .98925 .99000 -.17870 [.858]
0.0 0.1 0.2 0.3 0.4 0.5 0.6 0.7 0.8 0.9 1.0
0.0 0.1 0.2 0.3 0.4 0.5 0.6 0.7 0.8 0.9 1.0
Kolmogorov-Smirnov Goodness-of-Fit Test = .067599 5% Critical value = .057573
25
From the above table, we can see that the mean hit rate (0.98925) is very close to the expected value (0.99000), and the test statistic is not significant. Both are supporting the validity of the t-DCC model.
Graph 6: Plot of VaR
4.5 Forecasting Conditional Correlations
To this end we re-estimated the model over the evaluation sample period, January 2, 2011 to January 31, 2013 and obtained very similar results as those reported in Table 3. The time series plots of volatilities are displayed in Figures 1 for selected Dow Jones Indices. Conditional correlations of IKT with other indices, IUK with other indices and IUS with other indices are shown in Figures 7, 8 and 9, respectively. To reduce the impact of the initialization on the plots of volatilities and conditional correlations initial estimates for 2009 are not shown. These figures show declining trends in volatilities over the estimated sample period, and a rising trend in correlations except the conditional correlations of IUS with other indices which show slightly stable trends. These results are the same as those results obtained under full sample period suggesting the ability of our model to forecasting reliable conditional correlations.
Graph 7: Conditional Correlations of IKT over others Dow Jones Selected indices
12 14 16 18 20 22 24 26 28 30 32 34
14-Dec-10 28-Jun-11 10-Jan-12 24-Jul-12 31-Jan-13
Plot of VaR
26
Graph 8: Conditional Correlations of IUK over others Dow Jones Selected indices
0.5 0.6 0.7 0.8 0.9 1.0
15-Jan-09 17-Jul-09 18-Jan-10 20-Jul-10 14-Jan-11
Plot of conditional correlations between IKT and all others selected Dow Jones Islamic and Non-Islamic Indicies
27
Graph 9: Conditional Correlations of IUS over others Dow Jones Selected indices
4.6 MGARCH Applied to a set of OLS residuals
0.2 0.3 0.4 0.5 0.6 0.7 0.8 0.9 1.0
15-Jan-09 17-Jul-09 18-Jan-10 20-Jul-10 14-Jan-11
Plot of conditional correlations between IUK and all others selected Dow Jones Islamic and Non-Islamic Indicies
Cor(IUK,IEU) Cor(IUK,IKT) Cor(IUS,IUK) Cor(IWE,IUK) Cor(JCO,IUK) Cor(JWD,IUK)
-1 0 1 2 3 4 5
30-Jan-03 26-Jan-05 23-Jan-07 19-Jan-09 14-Jan-11
Plot of conditional correlations between IUS and all others selected Dow Jones Islamic and Non-Islamic indicies
28
The main objective here is to estimate a t-DCC model on residuals obtained from a regression of returns on indices on their past values. To performs this we need to applied a two step estimation method, where in the first step residuals are obtained by running separate OLS regressions for each variable, and in the second step the DCC model is applied to these residuals. It is applied over the full estimation sample period.
[image:29.595.71.531.278.492.2]From the result as in Appendix, we can see that the asset specific estimates of the volatility and correlation decay parameters are highly significant and are very close to the second estimation output that presented in table 1. Then we inspect the regression results for each equation and the results which we obtained are presented in table 7 below:
Table 7: Ordinary Least Square Estimation for the selected dependent variables
Dependent
Variables
Repressors’ Coefficients T- Ratios [Prob]
IEU IEU (-1) -.024908 -1.2774[.202]
IKT IKT (-1) .10942 5.6480 [.000]
IUK IUK (-1) -.038732 -1.9870[.047]
IUS IUS (-1) -.10666 -5.5068[.000]
IWE IWE (-1) .20259 10.6058[.000]
JCO JCO (-1) -.094605 -4.8767[.000]
JWD JWD (-1) .14687 7.6176[.000]
From the above result presented in table 7, we can see that the estimated parameter for the temporal lag of the variables IKT, IUK, IUS,IWE ,JCO, and JWD are close to zero as their coefficients estimates are (.10942),( -.038732),( -.10666),( .20259),( -.0946050),and (.14687) respectively they are all significant at 5% level. These results suggest smaller influence of first lag values on their returns. The exception is for IEU which its estimated parameter for the temporal lag is close to zero as well but statistically is insignificant, therefore, it suggest larger influence of the first lag value on its return.
5. Conclusion, findings, and policy implications
29
US Shariah investors to diversify their portfolios by hedging against unforeseen risks. The daily indices return ranging a period of 10 years from 01/03/2008 to 31/03/2013.
Our main findings indicate that:
1. All volatility parameters are highly significant, with the estimates very close to unity which implying a gradual volatility decay.
2. The t-distribution is more appropriate in capturing the fat-tailed nature of the distribution of stock returns.
.3. In term of unconditional volatilities the Dow Jones Islamic UK (IUK) appears to have the highest volatility and the Dow Jones Islamic Market appears to have the lowest volatility. In general the unconditional volatilities of the seven indices returns are very high which rank between 1.0853 and 1.5259; which implies that returns on those seven selected indices are, overall, more volatile. However, In terms of unconditional correlations, the highest correlations appears between Dow Jones Islamic Market (IKT) and Dow Jones World (JWD) which amount to .97999 and the lowest one appears to be between Dow Jones Islamic World Emergency (IWE) and Dow Jones Composite 65 Stock (JCO) which amount to .39147 implying the benefit of international portfolio diversification but for Non –Shariah investors. 4. The conditional volatilities of all stock indices returns move more closely together over time. However, there is relatively high volatility in stock indices returns in year 2008 due to the US financial crisis. Overall the results show that returns on those seven Dow Jones selected stock indices are stable. This confirms that Shariah-compliant equities are less volatile than their conventional counterparts, both in times of crisis as well as in times of stability.
5. Conditional correlations of returns of all Dow Jones Islamic Markets, Dow Jones Islamic UK , and Dow Jones Islamic US Indices with others indices are not constant but are changing.
6. There are mean reverting volatility for all selected Dow Jones indices. In terms of the speed of mean reversion, however, most of them are slow to get back to equilibrium.
The policy implications for these results from the point of view of the Shariah investors can be summaries as follows:
30
2. Correlations among the seven selected indices are not constant but are dynamic and time-varying. Hence the investors should monitor these correlations and mange their investment portfolios accordingly.
3. Different financial markets offer different opportunities for portfolio diversification. For instance, the US shariah investors can gain the most by diversifying into the IUK and IEU stock market because of the low correlations between the IUS and the IUK and IEU stock markets.
4. Finally, the timing of investment is also important. There are times when the IUS and the IUK indices are negatively correlated and hence the investors may also gain by timing their portfolio diversification properly.
31 10. References
Achsani, N., Effendi, J., and Abidin, Z. (2007), ―Dynamic interdependence among
international Islamic stock market indices: evidence from 2000-2007‖, Proceedings of the International Conference of the Islamic Capital Markets, Jakarta, Indonesia
Agmon, T. (1972), ―The relations between equity markets: A study of share price co -movements in the United States, United Kingdom, Germany, and Japan‖, Journal of Finance, 27, 839-855.
Aziz, H., and Kurniawan, T. (2007), ―Modelling the volatility of the Sharia index: evidence
from the Kuala Lumpur Sharia index and Jakarta Islamic index‖, Proceedings of the
International Conference of the Islamic Capital Markets, Jakarta, Indonesia
Becker, K., Finnerty, J. and Gupta, M. (1990), ―The intertemporal relation between the US and Japanese stock markets‖, Journal of Finance, 45, 1297-1306
Dacjman, S., Festic, M., and Kavkler, A. (2012), ―European stock market comovement
dynamics during some major financial market turmoils in the period 1997 to 2010 – a comparative DCC-GARCH and wavelet correlation analysis‖, Applied Economic Letters, 19 (13), 1249-1256
Engle, R. (1982), ―Autoregressive conditional heteroskedasticity with estimates of the
variance of the United Kingdom inflation‖, Econometrica, 50, 987–1007
Engle, R. (2002), ―Dynamic conditional correlation: a simple class of multivariate
generalized autoregressive conditional heteroskedasticity models‖, Journal of Business and Economic Statistics, 20, 339–350.
Hakim, S. and Rashidian, M. (2004), ―How Costly is Investor‘s Compliance to Sharia?‖,
paper presented at the 11th Economic Research Forum Annual Conference, Beirut, Lebanon
Hussein, K. (2005), ―Islamic Investment: Evidence From Dow Jones and FTSE Indices‖,
32
Kamil, N., Bacha, O., and Masih, M. (2012), ―Do ‗Sin Stocks‘ Deprive Islamic Stock
Portfolios of Diversification? Some Insights from the Use of MGARCH-DCC‖, Capital Markets Review, 20 (1 and 2), 1-20
Pesaran, B. and Pesaran, H. (2009).,Time Series Econometrics using Microfit 5.0. Oxford: Oxford University Press.