www.wjpps.com Vol 8, Issue 12, 2019. 1311 Kanchan et al. World Journal of Pharmacy and Pharmaceutical Sciences
FORMULATION AND EVALUATION OF BUCCAL TABLETS OF
RIZATRIPTAN BENZOATE
Kanchan Mandal M.* and Dr. Dhara B. Patel
Department of Pharmaceutics Sharda School of Pharmacy, Pethapur, Gandhinar.
ABSTRACT
The study aim was concerned with formulation and evaluation of bioadhesive buccal drug delivery of Rizatriptan Benzoate tablets,
which is extensively metabolized by liver. The tablets were prepared by direct compression using bioadhesive polymers such as hydroxypropyl methylcellulose K15M, hydroxypropyl methylcellulose
K100M sodium carboxymethyl cellulose and Carbopol 971 P. Bioadhesion strength, ex vivo residence time, swelling, and in vitro dissolution studies and ex vivo permeation studies were
performed. Trial batches were taken with all four polymers and finally 32 full factorial design was applied by taking HPMC K15M and
Carbopol 971 P as independent variables. The effect of independent variables was checked
on Drug release at 1 hour and mucoadhesive strength of all factorial batches. The Quadratic
model found significant and both factors gave significant effect in responses proved by
ANOVA analysis. Final batch was taken from the overlay plot after validating the design and
the formulation found stable up 1 month, gives sustained release dissolution profile up to 8
hours and good mucoadhesive strength.
KEYWORDS: Rizatriptan Benzoate, Buccal Tablets, HPMC, Carbopol.
INTRODUCTION
1.1Introduction of Buccal Drug Delivery System Buccal Drug Delivery System[1-4]
A medication can be managed by means of a wide range of courses to create a foundational pharmacological impact. The most well-known technique for medication organization is by means of per oral course in which the medication is gulped and enters the foundational dissemination fundamentally through the film of the small digestive system. The oral course
Volume 8, Issue 12, 1311-1353. Research Article ISSN 2277– 7105
Article Received on 12 Sept. 2019,
Revised on 02 Oct. 2019, Accepted on 22 Oct. 2019,
DOI: 10.20959/wjpr201912-16156
*Corresponding Author
Kanchan Mandal M.
Department of
Pharmaceutics Sharda
School of Pharmacy,
www.wjpps.com Vol 8, Issue 12, 2019. 1312 of medication organization is the most imperative technique for overseeing drugs for foundational impact. The parenteral course isn't routinely utilized for self– organization of drug. It is likely that no less than 90% of all medications used to create fundamental impacts are controlled by the oral course. Assimilation of medications after oral organization may happen at the different body locales between the mouth and rectum.
It has been known for a considerable length of time that buccal and sublingual organization sedate solutes are quickly assimilated into the reticulated vein, which lies underneath the oral mucosa and transported through the facial veins, inward juglar vein, and brachiocephalic vein and are then depleted into the fundamental course. Subsequently the buccal and sublingual courses of organization can be used to sidestep the hepatic first-pass disposal of medications. Inside the oral mucosal pit, the buccal district offers an appealing course of organization for fundamental medication conveyance. The mucosa has a rich blood supply and it is moderately penetrable. The oral depression is very adequate by patients, the mucosa is moderately penetrable with a rich blood supply and the virtual absence of Langerhans cells
makes the oral mucosa tolerant to potential allergens.
Oral mucosal sites[5,6]
Within the oral mucosal cavity, delivery of drugs is classified in to three categories.
1. Sublingual delivery: is the organization of the medication by means of the sublingual mucosa (the film of the ventral surface of the tongue and the floor of the mouth to the fundamental dissemination.
2. Buccal delivery: is the organization of medication by means of the buccal mucosa (the coating of the cheek) to the fundamental flow.
3. Local delivery: for the treatment of states of the oral hole, chiefly ulcers, parasitic conditions and periodontal sickness. These oral mucosal destinations contrast incredibly from each other as far as life structures, penetrability to a connected medication and their capacity to hold a conveyance framework for a coveted time span.
Oral mucosa
www.wjpps.com Vol 8, Issue 12, 2019. 1313 like ceramides and acylceramides which are generally impermeable to water. The mucosa of the delicate sense of taste, the sublingual, and the buccal districts, in any case, are not keratinized contain just little measures of ceramides.
Figure 2.1: Oral cavity.
Absorption pathways[7,8]
The two major routes of drug transport through buccal epithelium include transcellular (intracellular) and paracellular (intercellular) transports. Transcellular route involves permeation across cell membrane, intracellular space and basement membrane either by passive transport (through diffusion and pH partition) or by active transport (viz., facilitated and carrier mediated transport and endocytosis).
Drug transport through transcellular route is a complex function of various physicochemical properties like size, shape, charge, lipophilicity and hydrogen bond potential of substances. Transcellular route is limited to substances with narrow range of molar volume. Paracellular route covers substances with a wide range of molar volumes, within intracellular space, while the hydrophobic molecules pass through the lipid bilayer hydrophilic molecules pass through the narrow aqueous regions adjacent to polar head groups of lipids. Buccal cavity contains a variety of membranes.
Advantages of Buccal Drug Delivery Systems[9,10]
It is possible to stop drug administration as symptoms subsides
Localization of drug in oral cavity for prolonged periods of time can be achieved Administration is easy.
First pass metabolism can be avoided.
Less amount of drug can be administrated there by dose dependent side effects can be
www.wjpps.com Vol 8, Issue 12, 2019. 1314 Tissue permeability can be locally modified there by immunogenic response can be
reduced. This helps in administrating a wide variety of therapeutic agents especially proteins, peptides and ionized species can be administrated through buccal cavity. Choice of route of administration for drugs that are sensitive to acidic pH in stomach and
to those drugs which are unstable at alkaline pH in intestine.
Better bioavailability can be expected for the drugs which show poor bioavailability when
administrated through oral cavity.
Presence of large quantity of water in the form of saliva enhances drug dissolution which
is advantageous over other routes of drug administration especially transdermal and rectal routes.
Drugs whose half life is short (2-8 hrs) can be administrated by this route. E.g.
nitro-glycerine (2 hrs).
Disadvantages of Buccal Drug Delivery Systems[11,12]
Excess hydration causes over swelling of dosage form. This may damage structural
integrity of dosage form due to disruption.
Placing of dosage form for prolonged periods in buccal cavity may lead to discomfort. Chances of swallowing dosage form may occur.
Portion of drug that gets dissolved in saliva follows absorption mechanism of peroral
route. Thus benefits of buccal delivery may not be fulfilled.
Only those drugs which are required in small doses can be administrated by this route. Drugs with unpleasant taste/ odour or those which irritate mucosa cannot be administrated
by this route.
Drugs which are sensitive to buccal pH cannot be administrated.
Theories of Mucoadhesion[13,14]
Mucoadhesion of buccal devices is very important to expect drug delivery in required manner. Many theories have been put forward to explain the mechanism of mucoadhesion. These theories depend on physical and chemical properties of polymers used for mucoadhesion. To some extent interaction between polymers explains the extent of
www.wjpps.com Vol 8, Issue 12, 2019. 1315 1) Electronic theory
This theory is based on charges present on mucoadhesive substrate and mucus layer. These charges being opposite in nature when come in contact with each other, they transfer electrons to form a double electronic layer at interface there by encouraging mucoadhesion.
2) Adsorption theory
Adsorption theory explains the involvement of van der waals forces, hydrogen bonds and electrostatic attractions between the mucoadhesive polymer and mucus layer. According to adsorption theory these forces make mucoadhesive substrate to stick to mucus layer.
3) Wetting theory
This theory is applicable to the systems that are liquid in nature. These liquids exhibit affinity towards the surfaces on which they are tend to spread. It is based on contact angle between mucoadhesive material and mucus layers. In general there should be sufficient contact angle between substances to have adequate spreadability among them. The lesser the contact angle the greater the affinity.
4) Diffusion theory
Diffusion theory states that polymer chains penetrate sufficiently into mucin chains to adequate depth and forms a semi-permanent bond. The degree of penetration depends on diffusion coefficient of polymer, flexibility and nature of polymer chains.
5) Fracture theory
Fracture theory states that strength required for adhesion will be same as that of strength require for separating i.e. fracture strength is related to force required in separating platform and mucus surfaces.
Depending on the positions of their occurrence, fractures may be different types as platform fracture, platform – mucin fracture and mucin fracture. This implies that fracture theory can be used for measuring adhesive strength between platform and mucus surfaces and to evaluate molecular interactions within polymer.
6) Mechanical theory
www.wjpps.com Vol 8, Issue 12, 2019. 1316 phenomenon in the process of mucoadhesion. None of the theories mentioned above could explain all types of mucoadhesion that arises at different conditions. But understanding these theories aids in the development of new mucoadhesive products.
Mechanism of Mucoadhesion[15,16,17]
The mechanism of mucoadhesion or bioadhesion can be better understood through following headings.
a) Bioadhesive interface
Bonds that are responsible for bioadhesion between polymer and mucus layer requires major contribution by bioadhesive polymer. Mucus is highly viscous in nature and contains
glycoproteins or mucins, inorganic salts, proteins, lipids and polysaccharides. Its composition may vary with the source and pathological conditions. b) Physical and chemical interactions at interface: Adhesion between polymer and tissue involves.
i) Primary (ionic or covalent) chemical bonds ii) Secondary chemical bonds
iii) Physical and mechanical bonds
Primary chemical bonds are because of chemical reactions between functional groups of
adhesive substance and mucin layers. These are very important whenever semipermanent bond is essential. These semi-permanent bonds last from few minutes to few hours. Secondary chemical bonds involve in bioadhesive bonds by means of vanderwaals dispersive interactions and hydrogen bonds. Physical and mechanical bonds are formed by inclusion of adhesive polymer in cervices of mucin. Thus, the extent of roughness on mucin surface is important in bioadhesion. Only that material that can adjust within these irregularities of mucin tissue is considered as ideal adhesive system.
www.wjpps.com Vol 8, Issue 12, 2019. 1317
Factors Influencing Mucoadhesion[18,19]
Factors that can influence mucoadhesion can be categorized into Polymer related factors
Environment related factors Physiological variables
1. Polymer related factors a) Molecular weight
The bioadhesive force depends on molecular weight of polymer. Bioadhesive force increases with increase in molecular weight till 1, 00,000. Any further increase beyond this does not
show significant change in bioadhesion. Size and configuration of polymers are of importance in deciding bioadhesion capacity of polymers.
b) Concentration of active polymer
Bioadhesive nature of polymers increases with concentration of polymer. But it is observed that bioadhesive behaviour drops significantly in highly concentrated systems. This reduction
in bioadhesion may be because of the fact that in concentrated solutions, chains present in molecules become coiled and the number of chains available for interpenetration will be
reduced.
c) Flexibility of polymer chains
Flexibility of polymer chain is crucial for interpenetration. Mobility of polymer chain decreases with cross linking of chains. As cross linking density of polymer chains increases,
the length of chain participating in interpenetration reduces and there by suppresses mucoadhesive strength of polymer.
d) Spatial conformation
Bioadhesive strength of polyethylene glycol with molecular weight of 2, 00,000 is similar with that of dextrans whose molecular weight is 19,500,000. This similarity is because of helical structure of dextrans in contrary to the linear structure of poly ethylene glycols. This
www.wjpps.com Vol 8, Issue 12, 2019. 1318 2. Environment related factors
a) Effect of pH
The effect of pH is very important on mucoadhesion. This is evident by cross linking of – COOH group with poly acrylic polymers. It has been reported that degree of hydration of cross linked poly acrylic acid depends on pH of the medium. It was also observed that degree of hydration will be maximum between pH 4 and pH 5 but minimum at alkaline pH.
b) Strength applied
Strength applied during initiation of bioadhesion greatly influences the extent of bioadhesion. This is evident in cases of polymers like poly acrylic acid, di vinyl benzene and carbopol 934P. The extent of bioadhesion by these polymers increases when high pressures are applied.
c) Contact time
The extent of bioadhesion increases with increase in initial contact time.
d) Selection of model substrate surface
Alteration in physical and biological properties of tissue may occur due to unavoidable reasons. In such cases the viability of biological substrate should be examined for properties like permeability and histology of tissue.
e) Swelling
Swelling behavior of polymer depends on both concentration of polymer as well as presence of water at the site of application. Excessive swelling may cause reduction in bioadhesive property of polymer.
3. Physiological variables a) Mucin turnover
www.wjpps.com Vol 8, Issue 12, 2019. 1319 b) Disease state
Mucus layer loses its physicochemical properties during disease conditions like common cold, gastric ulcers, cystic fibrosis, bacterial or fungal infections and even during eye inflammation. Mucoadhesive properties of devices have to be checked during such disease conditions.
Novel Buccal Dosage Forms[20-23] 1. Patches and Films
Patches comprises of two overlays, with a fluid arrangement of the cement polymer being thrown onto an impermeable support sheet, which is then cut into the required oval shape. A
tale mucosal cement film called "Zilactin" - comprising of a heavy drinker arrangement of hydroxyl propyl cellulose and three natural acids. The film which is connected to the oral mucosal can be held set up for something like 12 hours notwithstanding when it is tested with liquids. E.g. buccal film of salbutamol.
2. Buccal mucoadhesive tablets
Mucoadhesive tablets are dry measurement structures and it is to be dampened preceding putting in contact with buccal mucosa. It is twofold layer tablet, comprising of glue grid layer
of polyacrylic corrosive and hydroxy propyl, cellulose with an inward center of cocoa margarine containing insulin and an entrance enhancer (sodium glycocholate).
3. Semisolid Preparations (Ointments and Gels)
One of the first oral mucoadhesive conveyance frameworks – "orabase"– comprises of finely
ground gelatin, gelatin and sodium carboxy methyl cellulose scattered in a poly (ethylene) and a mineral oil gel base, which can be kept up at its site of utilization for 15-150 minutes. Precedent: chitosan glutamate buccal hydrogel with neighborhood soporifics action.
4. Powders
Beclomethasone and Hydroxpropyl cellulose in powder frame when splashed onto the oral mucosa of rodents, a noteworthy increment in the living arrangement time with respect to an
www.wjpps.com Vol 8, Issue 12, 2019. 1320 5. Buccal sprays
Generex bio advances have been presented insulin shower. This innovation is being utilized to build up a detailing for buccal conveyance of insulin for the treatment of sort - 1 diabetes buccal splash conveys a fog of fine beads onto mucosal film most likely on to mucin layer. e.g. Estradiol showers.
1.2Introduction of Disease
Migraines[24]
A migraine is a primary headache disorder characterized by recurrent headaches that are moderate to severe. Typically, the headaches affect one half of the head, are pulsating in
nature, and last from two to 72 hours. Associated symptoms may include nausea, vomiting, and sensitivity to light, sound, or smell. The pain is generally made worse by physical activity. Up to one-third of people have an aura: typically a short period of visual disturbance that signals that the headache will soon occur. Occasionally, an aura can occur with little or no headache following it.
Migraines are believed to be due to a mixture of environmental and genetic factors. About two-thirds of cases run in families. Changing hormone levels may also play a role, as
migraines affect slightly more boys than girls before puberty and two to three times more women than men. The risk of migraines usually decreases during pregnancy. The underlying mechanisms are not fully known. They are, however, believed to involve the nerves and blood vessels of the brain.
Initial recommended treatment is with simple pain medication such as ibuprofen and paracetamol (acetaminophen) for the headache, medication for the nausea, and the avoidance of triggers. Specific medications such as triptans or ergotamines may be used in those for whom simple pain medications are not effective. Caffeine may be added to the above. A number of medications are useful to prevent attacks including metoprolol, valproate, and topiramate.
www.wjpps.com Vol 8, Issue 12, 2019. 1321 migraine lasting longer than 72 hours is termed status migrainosus. There are four possible phases to a migraine, although not all the phases are necessarily experienced:
The prodrome, which occurs hours or days before the headache
The aura, which immediately precedes the headache
The pain phase, also known as headache phase
The postdrome, the effects experienced following the end of a migraine attack
Migraines are associated with major depression, bipolar disorder, anxiety disorders, and obsessive compulsive disorder. These psychiatric disorders are approximately 2–5 times more common in people without aura, and 3–10 times more common in people with aura.
1.3Introduction of Drug
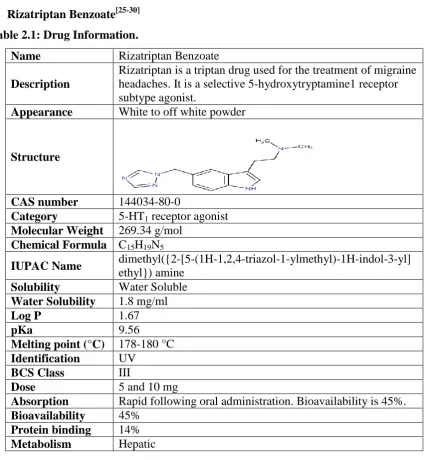
[image:11.595.83.511.304.765.2] Rizatriptan Benzoate[25-30] Table 2.1: Drug Information.
Name Rizatriptan Benzoate Description
Rizatriptan is a triptan drug used for the treatment of migraine headaches. It is a selective 5-hydroxytryptamine1 receptor subtype agonist.
Appearance White to off white powder
Structure
CAS number 144034-80-0
Category 5-HT1 receptor agonist Molecular Weight 269.34 g/mol
Chemical Formula C15H19N5
IUPAC Name dimethyl({2-[5-(1H-1,2,4-triazol-1-ylmethyl)-1H-indol-3-yl] ethyl}) amine
Solubility Water Soluble Water Solubility 1.8 mg/ml
Log P 1.67
pKa 9.56
Melting point (°C) 178-180 °C Identification UV
BCS Class III
Dose 5 and 10 mg
Absorption Rapid following oral administration. Bioavailability is 45%. Bioavailability 45%
www.wjpps.com Vol 8, Issue 12, 2019. 1322 Half life 2-3 hours
Excretion Renal
Indication For treatment of acute migraine attacks with or without aura.
Mechanism of action
Three distinct pharmacological actions have been implicated in the antimigraine effect of the triptans: (1) stimulation of presynaptic 5-HT1D receptors, which serves to inhibit both dural vasodilation and inflammation; (2) direct inhibition of trigeminal nuclei cell excitability via 5-HT1B/1D receptor agonism in the brainstem and (3) vasoconstriction of meningeal, dural, cerebral or pial vessels as a result of vascular 5-HT1B receptor agonism.
1.4Summary of PSAR Report
Sr. No. Patent Application number Title of Patent
1. 201847018291 Pharmaceutical Compositions for Rizatriptan
2. 791/CHE/2011 A Buccal Drug Delivery System
3. 1288/MUM/2008 Pharmaceutical Formulation of Rizatriptan
4. 201841012597 Bilayer Tablet Formulation of Rizatriptan
5. EP20100792884 Mucoadhesive Buccal Tablets for The Treatment
of Orofacial Herpes
Looking at above 05 patents, your Dissertation project is novel up to what extent? Novelty grade: 50 to 90%
RATIONAL OF PATENT
Above five patents describe Formulation of Rizatriptan in different dosage form. No any patented work done on buccal tablets of Rizatriptan. Hence, the selected title is novel.
2. Aim and Objectives 2.1Aim of Work
“Formulation and Evaluation of buccal tablets of Rizatriptan Benzoate”
2.2Rationale
Rizatriptan is a triptan drug used for the treatment of migraine or headaches. It is a selective 5-hydroxytryptamine1 receptor subtype agonist.
Oral dose is 5/10 mg two-three times in a day. Its half-life is 2-3 hr.
It is subject to extensive first-pass hepatic metabolism so the bioavailability of
approximately 45%.
Its log P is 1.67. And pKa is 9.56.
www.wjpps.com Vol 8, Issue 12, 2019. 1323 Hence, Sustained release buccal formulation of Rizatriptan suggested bypassing the first
pass effect may enhance bioavailability and reducing dosing frequency.
2.3Objectives of Work
To carry out pre-formulation studies for possible drug and excipient interactions. (Drug:
Excipient Compatibility study)
To develop and formulate buccal tablets of Rizatriptan. To optimize the polymer concentration.
To achieve drug release more than 90% of drug within 8 hours.
To evaluate the optimized formulated dosage form for various physico-chemical
parameters like weight variation, Hardness, thickness, drug content and Dissolution. To carry out accelerated stability studies on the most satisfactory formulation as per ICH
guideline.
3. MATERIALS AND EQUIPMENTS 3.1List of Materials
Table 3.1: List of materials.
Sr. No. Materials Manufacturer
1 Rizatriptan Benzoate Astron Research Centre, Ahmedabad.
2 PVPK 30 S. D. Fine chemicals, Ahmedabad.
3 Mannitol (Pearlitol SD 200) S. D. Fine chemicals, Ahmedabad.
4 HMPC K15M
HMPC K100M S. D. Fine chemicals, Ahmedabad.
5 Sodium CMC S. D. Fine chemicals, Ahmedabad.
6 Aspartame S. D. Fine chemicals, Ahmedabad.
7 Talc S. D. Fine chemicals, Ahmedabad.
8 Magnesium Stearate S. D. Fine chemicals, Ahmedabad.
9 Ethyl Cellulose S. D. Fine chemicals, Ahmedabad.
10 Carbopol 971 P S. D. Fine chemicals, Ahmedabad.
4. Experimental Work 4.1Preformulation Study 5.1.1 Characterization of API 5.1.1.1 Organoleptic property
This includes recording of colour and odour of the drug using descriptive terminology.
5.1.1.2 Flow Property
Flow properties of API/powder mixtures were investigated. For bulk density determination,
www.wjpps.com Vol 8, Issue 12, 2019. 1324 powder volume was recorded. Tapped density was obtained by tapping the powder 100 times, and resulting powder volume was measured. From the obtained powder density, Carr’s index (CI) and Hausner ratio (HR) of powder mixtures were calculated.
5.1.1.3 Melting point
Melting point was determined, using capillary melting method.
5.1.2 Determination of λ Max
The standard solution of Rizatriptan Benzoate scanned at different concentration in the range of 200-400 nm and the λ max was determined.
5.1.3 Calibration curve for Rizatriptan Benzoate
Calibration curve of Rizatriptan Benzoate was prepared in 6.8 pH phosphate buffer using UV visible spectrophotometer (UV 1700, Shimadzu).
Procedure: An accurately weighed quantity of about 10 mg of Rizatriptan Benzoate was taken in 100 ml volumetric flask dissolved in sufficient quantity of 6.8 pH phosphate buffer then sonicated for 15 min and diluted to 100 ml with the same solvent so as to get the concentration of 100 μg/ml. For various concentration of drug solution, appropriate aliquots
were pipette out from standard stock solution into the series of 10 ml volumetric flask and the volume was made up to the mark with 6.8 pH phosphate buffer to get concentration of 10-60 µg/ml of Rizatriptan Benzoate.
5.1.4 Drug Excipients Compatibility studies FTIR Spectroscopy
Fourier transform infrared (FTIR) technique was used to study the physical and chemical interaction between drug and excipient used. FTIR spectra of pure drug and Physical Mixture were recorded using KBr mixing method.
4.2Dose Calculation
The total dose of Rizatriptan Benzoate for a sustained release buccal tablets formulation was calculated by following four equations using available pharmacokinetic data from a design of one compartment model with simultaneous release of loading dose and a zero order release maintenance dose, as described by Robison and Eriksen;
o k0 = Dike = 5 × 0.693/3 = 1.155 mg
www.wjpps.com Vol 8, Issue 12, 2019. 1325
o Dl = Di-k0Tp = 5-(1.155× 1.5) = 3.267 mg
o Dt = Dl + Dm = 3.267 + 9.240 = 12.507 ≡ 12.5 mg of Rizatriptan Benzoate
Where,
k0 = zero order drug release; ke = 0.693/t1/2; Di = initial dose/conventional dose; Dl = loading dose; Dm = maintenance dose; T = time for action; Tp = time to reach peak plasma concentration; Dt = total dose of drug.
The conventional doses available in the market are 5 mg.
Hence the tablet should contain a total dose of 12.5 mg for 8 hours. Sustained release dosage
form and it should release 3.267 mg in 1st hour like conventional dosage form and remaining dose (9.240 mg) in remaining 7 hours, Hence, the theoretical drug release profile can be generated using above value, which is shown in below table.
Theoretical drug release profile
Time (hour) Total amount of Drug release from
12.5 mg tablet (mg) % CPR
1 3.3 26.4 %
2 4.6 36.8 %
3 5.9 47.2 %
4 7.2 57.6 %
5 8.5 68.0 %
6 9.8 78.4 %
7 11.1 88.8 %
8 12.5 100.0 %
4.3 Preparation of Buccal tablet
Method of Preparation
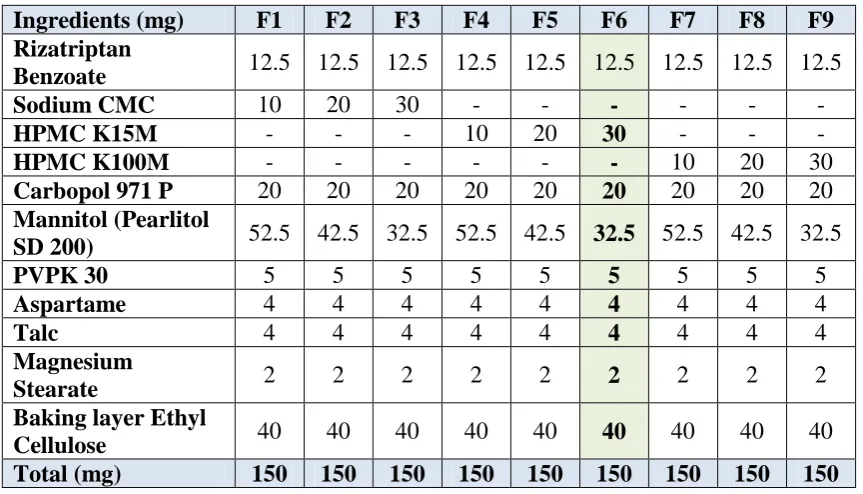
www.wjpps.com Vol 8, Issue 12, 2019. 1326 4.4Formulation of Rizatriptan Benzoate Buccal tablets
Table 4.1: Formulation Table of Trial Batches of Buccal tablets.
Ingredients (mg) F1 F2 F3 F4 F5 F6 F7 F8 F9 Rizatriptan
Benzoate 12.5 12.5 12.5 12.5 12.5 12.5 12.5 12.5 12.5
Sodium CMC 10 20 30 - - - - - -
HPMC K15M - - - 10 20 30 - - -
HPMC K100M - - - - 10 20 30
Carbopol 971 P 20 20 20 20 20 20 20 20 20
Mannitol (Pearlitol
SD 200) 52.5 42.5 32.5 52.5 42.5 32.5 52.5 42.5 32.5
PVPK 30 5 5 5 5 5 5 5 5 5
Aspartame 4 4 4 4 4 4 4 4 4
Talc 4 4 4 4 4 4 4 4 4
Magnesium
Stearate 2 2 2 2 2 2 2 2 2
Baking layer Ethyl
Cellulose 40 40 40 40 40 40 40 40 40
Total (mg) 150 150 150 150 150 150 150 150 150 4.5Application of Factorial Design
32 Full Factorial Design
It is attractive to build up an adequate pharmaceutical definition in most brief conceivable time utilizing least number of worker hours and crude materials. Generally pharmaceutical definitions are produced by transforming one variable at any given moment approach. The strategy is tedious in nature and requires a considerable measure of inventive endeavors. In addition, it might be hard to build up a perfect definition utilizing this established procedure since the joint impacts of autonomous factors are not considered. It is along these lines exceptionally fundamental to comprehend the unpredictability of pharmaceutical details by utilizing built up measurable devices, for example, factorial outline. Notwithstanding the craft of definition, the system of factorial outline is a powerful strategy for demonstrating the relative hugeness of various factors and their associations.
The number of experiments required for these studies is dependent on the number of independent variables selected. The response (Yi) is measured for each trial.
Y = b0 + b1X1 + b2X2 + b12X1X2 + b11X12 + b22X22 ………. (1)
www.wjpps.com Vol 8, Issue 12, 2019. 1327 average result of changing one factor at a time from its low to high value. The interaction terms (X1X2) show how the response changes when two factors are simultaneously changed.
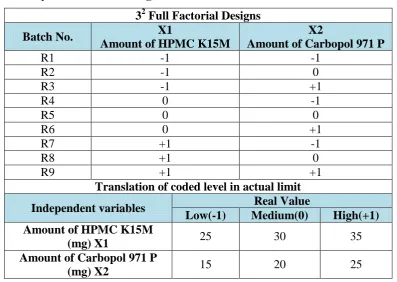
Table 4.2: Layout of factorial design.
32 Full Factorial Designs
Batch No. X1
Amount of HPMC K15M
X2
Amount of Carbopol 971 P
R1 -1 -1
R2 -1 0
R3 -1 +1
R4 0 -1
R5 0 0
R6 0 +1
R7 +1 -1
R8 +1 0
R9 +1 +1
Translation of coded level in actual limit
Independent variables Real Value
Low(-1) Medium(0) High(+1) Amount of HPMC K15M
(mg) X1 25 30 35
Amount of Carbopol 971 P
(mg) X2 15 20 25
All 9 batches were evaluated for the % drug release at 1 hour. (Y1) and Mucoadhesive strength to find out effect of the both parameters (X1, X2).
Independent variables
X1-Amount of HPMC K15M (mg)
X2-Amount of Carbopol 971 P (mg)
Dependent variables
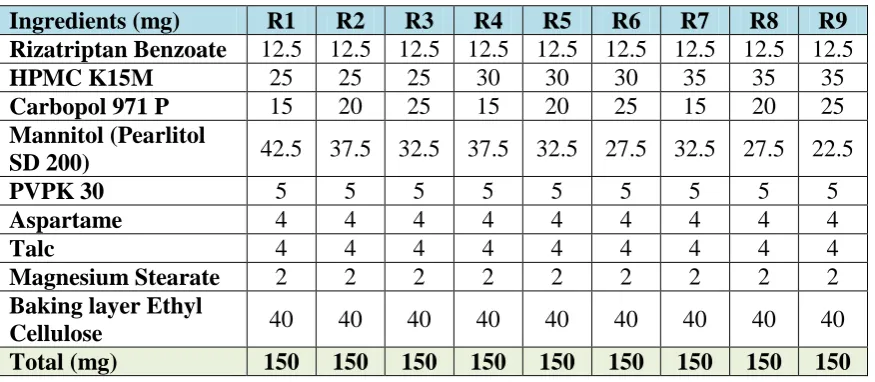
www.wjpps.com Vol 8, Issue 12, 2019. 1328 Table 4.3: Formulation Table of Factorial Batches of Buccal tablets.
Ingredients (mg) R1 R2 R3 R4 R5 R6 R7 R8 R9 Rizatriptan Benzoate 12.5 12.5 12.5 12.5 12.5 12.5 12.5 12.5 12.5
HPMC K15M 25 25 25 30 30 30 35 35 35
Carbopol 971 P 15 20 25 15 20 25 15 20 25
Mannitol (Pearlitol
SD 200) 42.5 37.5 32.5 37.5 32.5 27.5 32.5 27.5 22.5
PVPK 30 5 5 5 5 5 5 5 5 5
Aspartame 4 4 4 4 4 4 4 4 4
Talc 4 4 4 4 4 4 4 4 4
Magnesium Stearate 2 2 2 2 2 2 2 2 2
Baking layer Ethyl
Cellulose 40 40 40 40 40 40 40 40 40
Total (mg) 150 150 150 150 150 150 150 150 150 4.6Evaluation Parameters of Buccal Tablets
(A) Pre compression Parameters
Bulk Density
Calculated based on following formula.
Bulk density = Weight of powder / Bulk volume
Tapped Density
Calculated based on following formula.
Tapped density = Weight of powder / Tapped volume
Compressibility Index (CI)
Calculated based on following formula.
Carr’s Compressibility index (%) = {(TD- BD) / TD} X 100.
Table 4.4: Scale of flow ability by Compressibility index.
C.I. Category Hausner’s Ratio
<10 Excellent 1.00–1.11
11 – 15 Good 1.12–1.18
16 – 20 Fair 1.19–1.25
21 – 25 Passable 1.26–1.34
26 – 31 Poor 1.35–1.45
32 – 37 Very poor 1.46–1.59
>38 Very very poor >1.60
Hausner’s Ratio
www.wjpps.com Vol 8, Issue 12, 2019. 1329 Hausner’s ratio = Tapped density / Bulk density
Angle of Repose
This can be calculated based on following formula. tan θ = h/D
Where, h=Height of funnel D=Diameter of the circle
(B) Post Compression Parameters
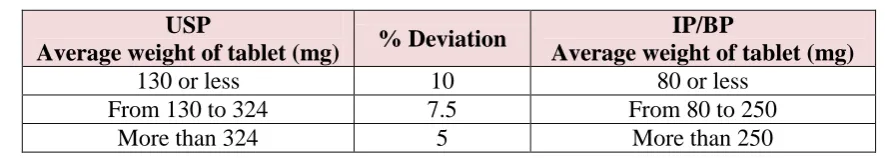
Weight Variation
Twenty tablets from each formulation were weighed using an electronic digital balance and
[image:19.595.73.516.338.417.2]the average weight was calculated.
Table 4.5: IP/BP/USP limit of weight variation test. USP
Average weight of tablet (mg) % Deviation
IP/BP
Average weight of tablet (mg)
130 or less 10 80 or less
From 130 to 324 7.5 From 80 to 250
More than 324 5 More than 250
Hardness
Hardness was determined by compressing the tablets diametrically on three tablets from each batch using Monsanto hardness tester and average values were calculated.
Friability
Friability is the measure of tablet strength. Roche type friabilator was used for testing the friability the following procedure. Twenty tablets were weighed accurately and placed in the tumbling apparatus that revolves at 25 rpm dropping the tablets through a distance of six inches with revolution. After 4 min, the tablets were weighed and the percentage loss was determined.
% loss = initial wt.-final wt. / initial wt. × 100
Thickness
www.wjpps.com Vol 8, Issue 12, 2019. 1330
Drug content
Ten tablets were weighed and grounded in a glass mortar with pestle to obtain fine powder. Powder equivalent to the mass of one tablet from each batch was taken in separate 100 ml
volumetric flask containing 100 ml of 6.8 phosphate buffer, and kept for 15 mins constant stirring. The solution were filtered, diluted and analyzed at 282 nm using UV spectrophotometer.
Swelling study
The tablets were individually weighed (W1) and placed separately in Petri dishes with 5 ml of simulated saliva of pH 6.8. At the time interval of 1, 2, 4, 6 and 8 hrs, tablet was removed from the petridish and excess water was removed carefully using the filter paper. The swollen tablet was then reweighed (W2) and the percentage hydration was calculated using the following formula.
% Swelling Index (S.I) = [(W2-W1)/ W1] ×100 W1 = initial weight
W2= final weight
Surface pH
The surface pH of the buccal tablets was determined in order to investigate the possibility of any side effects in vivo. As an acidic or alkaline pH may cause irritation to the buccal mucosa, it was determined to keep the surface pH as close to neutral as possible. A combined glass electrode was used for this purpose. The tablet was allowed to swell by keeping it in contact with 5 ml of distilled water (pH 7.0 ± 0.05) for 2 hr at room temperature. The pH was
measured by bringing the electrode in contact with the surface of the tablets and allowing it to equilibrate for 1 min.
Mucoadhesion studies
www.wjpps.com Vol 8, Issue 12, 2019. 1331 temperature control system involves placing thermometer in 500 ml beaker and intermittently adding hot simulated saliva (pH 6.8) into 500 ml beaker containing simulated saliva (pH 6.8) maintained at 37.0±0.5 °C.
Mucoadhesive time
A locally modified USP disintegration apparatus was used to determine the ex vivo mucoadhesion (residence) time. The mucosal membrane (fresh sheep buccal mucosa)
was separated by removing the underlying fat and loose tissues. The membrane was washed
with distilled water and then with 6.8 phosphate buffer at 37 °C. Mucosa, 4 cm long, was glued to the surface of a glass slide. One side of the tablet was wetted with one drop of 6.8
phosphate buffer and pasted to the sheep buccal mucosa by applying a light force with fingertip for 20 s. The glass slide was vertically fixed to the apparatus and allowed to move up and down so that the tablet was completely immersed in the buffer solution at the lowest point and was out at the highest point. The beaker was filled with 800 mL of 6.8 phosphate buffer and was kept at 37 ± 1 °C. The time required for the tablet to detach from the buccal mucosa was recorded as the mucoadhesion time.
In-vitro release study
The USP type II dissolution apparatus was used to study the release of drug from buccal tablets. The dissolution medium consists of 900 ml of phosphate buffer pH 6.8. The release was performed at 37 ± 0.5°C, at a rotating speed of 50 rpm. The impermeable layer of the tablet was attached to a glass slide with instant adhesive. The slide was put in the bottom of the dissolution vessel, so that the tablet remained on the upper side of the slide. Dissolution was carried out and samples of 5 ml, at each time intervals were withdrawn at pre determined time intervals and replaced with fresh medium. The samples were filtered through whatman filter paper and were analyzed spectrophotometrically at 286 nm against phosphate buffer pH 6.8 as blank.
kinetic analysis
www.wjpps.com Vol 8, Issue 12, 2019. 1332 value of n falls between 0.5 and 1.0; while in case of fickian diffusion, n ≤ 0.5; for zero-order
release (case II transport), n = 1; and for super case II transport, n > 1.
In vitro buccal permeability studies
In-vitro buccal permeation study was carried out through sheep buccal mucosa using Franz diffusion apparatus (20 ml). Sheep buccal mucosa was obtained from the local slaughter house and stored in phosphate pH 6.8, used within 2 h of slaughter. The mucosa was separated from underlying connective tissues with surgical scissors and clamped in between
donor and receptor compartment of diffusion cell. Buccal tablet was placed with the core facing the mucosa. The donor compartment was filled with 1 ml of phosphate buffer pH 6.8.
The receptor compartment was filled with phosphate buffer pH 6.8 and hydrodynamics in the compartment was maintained by stirring with a magnetic bead at uniform slow speed. 1 ml of sample of sample was withdrawn at regular intervals of time and analyzed UV spectrophotometrically.
Stability Studies
Stability studies will carry out for the best formulation; the best formulation will kept at 40 ± 2°C & 75 ± 5% RH. After 1 month studies were carried out for important parameters like Physical appearance, dissolution and drug content.
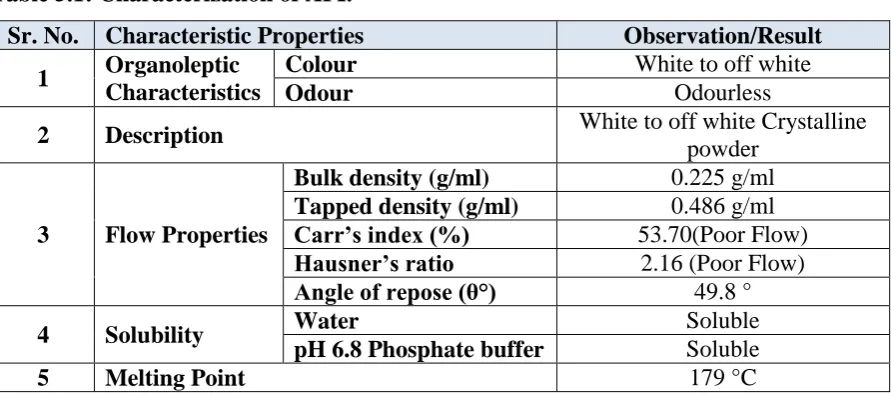
[image:22.595.77.523.519.717.2]5. RESULTS AND DISCUSSION 5.1Preformulation Study Results Table 5.1: Characterization of API.
Sr. No. Characteristic Properties Observation/Result 1 Organoleptic
Characteristics
Colour White to off white
Odour Odourless
2 Description White to off white Crystalline
powder
3 Flow Properties
Bulk density (g/ml) 0.225 g/ml Tapped density (g/ml) 0.486 g/ml Carr’s index (%) 53.70(Poor Flow) Hausner’s ratio 2.16 (Poor Flow) Angle of repose (θ°) 49.8 °
4 Solubility Water Soluble
pH 6.8 Phosphate buffer Soluble
5 Melting Point 179 °C
Based on API characterization results, it concluded that the API having a good solubility so
www.wjpps.com Vol 8, Issue 12, 2019. 1333 API were found poor in nature. Hence to use direct compression approach, some directly compressible excipients should be incorporated. Melting point conforms the API characteristics.
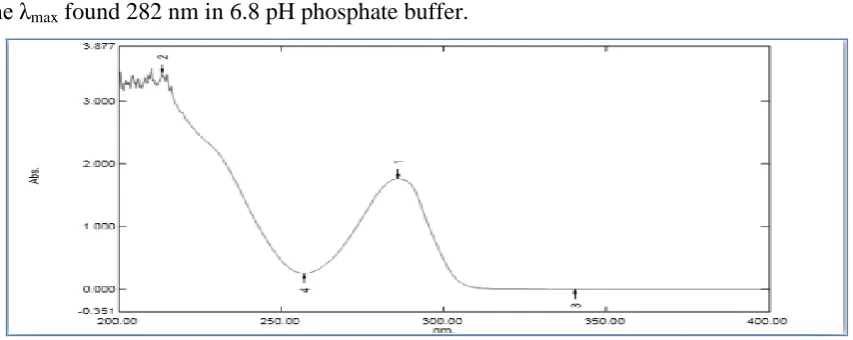
[image:23.595.84.511.170.340.2]5.2Determination of λmax and Calibration curve of Rizatriptan Benzoate The λmax found 282 nm in 6.8 pH phosphate buffer.
Figure 5.1: λmax of Rizatriptan Benzoate in 6.8 pH phosphate buffer.
Table 5.2: Standard calibration curve of Rizatriptan Benzoate in 6.8 pH phosphate buffer.
Concentration (µg/ml) Mean Absorbance at (282 nm) ± SD
0 0
10 0.195 ± 0.002
20 0.380 ± 0.004
30 0.549 ± 0.003
40 0.720 ± 0.006
50 0.911 ± 0.002
[image:23.595.96.499.419.717.2]www.wjpps.com Vol 8, Issue 12, 2019. 1334 5.3Drug- excipient compatibility studies
[image:24.595.100.490.154.353.2]FTIR study revealed that drug was compatible with selected excipients. No any kind of interaction found between drug and excipients.
[image:24.595.98.495.399.576.2]Figure 5.3: FTIR spectra of Pure drug Rizatriptan Benzoate.
Figure 5.4: FTIR of Physical Mixture of Optimized Formulation. Table 5.3: Interaction studies through IR spectroscopy.
FUNCTIONAL GROUP
Pure Drug peak (cm-1)
Final Formulation
peak (cm-1) Observation
C-H 3026.41 3025.45 No interaction
C=C 1459.20 1458.23 No interaction
-C=O 1606.79 1604.63 No interaction
www.wjpps.com Vol 8, Issue 12, 2019. 1335 5.4Evaluation of prepared buccal tablets of trial batches
Pre compression Parameters
Various Precompression parameters were checked before compression step and the results
[image:25.595.69.529.188.377.2]were recorded in below table 6.4.
Table 5.4: Result of Pre compression parameters. Formulation Code Bulk density (g/ml) (n=3) Tapped density (g/ml) (n=3) % Compressibil ity (n=3) Hausner’s ratio (n=3) Angle of repose (Ɵ) (n=3)
F1 0.50 ± 0.06 0.58 ± 0.03 13.79 ± 0.02 1.16 ± 0.06 29.92º
F2 0.51 ± 0.10 0.59 ± 0.06 13.27 ± 0.04 1.15 ± 0.07 27.90º
F3 0.49 ± 0.07 0.57 ± 0.04 13.88 ± 0.05 1.16 ± 0.08 28.22º
F4 0.46 ± 0.06 0.53 ± 0.01 12.55 ± 0.08 1.14 ± 0.03 21.12º
F5 0.52 ± 0.05 0.59 ± 0.02 11.41 ± 0.09 1.13 ± 0.04 28.20º
F6 0.52 ± 0.10 0.60 ± 0.08 13.04 ± 0.07 1.15 ± 0.05 27.14º
F7 0.51 ± 0.09 0.57 ± 0.07 11.15 ± 0.04 1.13 ± 0.06 29.08º
F8 0.46 ± 0.04 0.52 ± 0.06 12.21 ± 0.06 1.14 ± 0.04 26.21º
F9 0.47 ± 0.08 0.54 ± 0.04 13.60 ± 0.03 1.16 ± 0.06 28.32º
Based on the above data of flow property, it concludes that the blend flow is good in nature
and smoothly handled in compression.
Evaluation of post compression parameters
The weight variation test was conducted for each batch of all formulations F1 to F9 as per I.P and the results are shown in Table 6.5. The weight variation test for all the formulations complies with the IP limit (± 7.5%).
The thickness of the tablets was found to be almost uniform in all formulations F1 to F9.
Adequate tablet hardness is necessary requisite for consumer acceptance and handling. The hardness of tablets of all formulations (F1 to F9) ranged between 4.7 to 5.5 kg/cm2 and the results are shown in Table 6.5.
The friability test for all the formulations were done as per the standard procedure in I.P. The results of the friability test are tabulated in Table 6.5. The results indicated that the friability was less than 1% for all formulations ensuring that the tablets were mechanically strong.
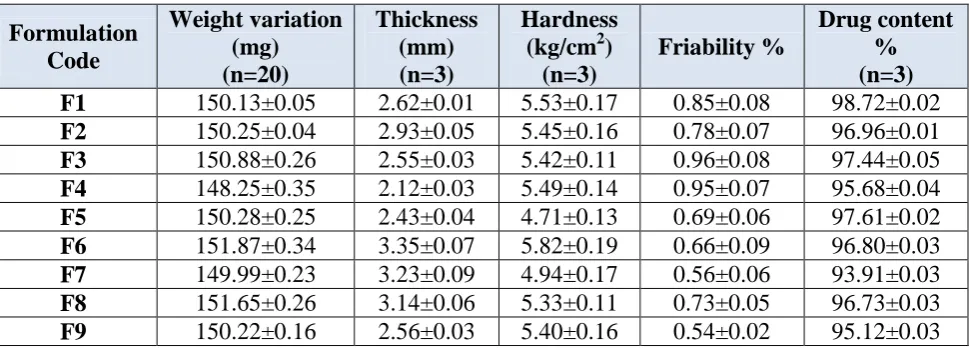
www.wjpps.com Vol 8, Issue 12, 2019. 1336 indicate that the percentage of drug content was found to be 96 to 99% hence it was concluded that all the formulations were within the acceptable limits.
Table 5.5: Results of post compression parameters. Formulation Code Weight variation (mg) (n=20) Thickness (mm) (n=3) Hardness (kg/cm2)
(n=3)
Friability %
Drug content % (n=3)
F1 150.13±0.05 2.62±0.01 5.53±0.17 0.85±0.08 98.72±0.02
F2 150.25±0.04 2.93±0.05 5.45±0.16 0.78±0.07 96.96±0.01
F3 150.88±0.26 2.55±0.03 5.42±0.11 0.96±0.08 97.44±0.05
F4 148.25±0.35 2.12±0.03 5.49±0.14 0.95±0.07 95.68±0.04
F5 150.28±0.25 2.43±0.04 4.71±0.13 0.69±0.06 97.61±0.02
F6 151.87±0.34 3.35±0.07 5.82±0.19 0.66±0.09 96.80±0.03
F7 149.99±0.23 3.23±0.09 4.94±0.17 0.56±0.06 93.91±0.03
F8 151.65±0.26 3.14±0.06 5.33±0.11 0.73±0.05 96.73±0.03
F9 150.22±0.16 2.56±0.03 5.40±0.16 0.54±0.02 95.12±0.03
Surface pH and Mucoadhesive Strength Determination Surface pH
Surface pH of all the formulations F1 to F9 was found to be 7.01±0.25 to 7.20±0.21. Hence, it can be expected that there would be no local irritation to the mucosal surface and all the formulation can be used safely.
Bioadhesive strength
[image:26.595.58.543.146.321.2]The In- vitro bioadhesion study was performed using a modified physical balance and measure the strength (g) required to detach the tablet was noted. The bioadhesion characteristic was affected by the concentration of bioadhesive polymers used. Increase in concentration of polymer increased the bioadhesive strength of the formulation shown as Table 6.6 the strength of bioadhesion was between 23.97 ± 0.22 to 33.52 ± 0.03 g.
Table 5.6: Result of surface pH and Mucoadhesive Strength measurement. Formulation Code Surface pH Mucoadhesive
strength (g)
Residence Time (hours)
F1 7.10±0.33 29.66±0.07 4.9±0.5
F2 7.20±0.21 25.49±0.02 5.4±0.9
F3 7.20±0.11 33.52±0.03 5.9±0.6
F4 7.11±0.22 32.19±0.27 8.0±0.5
F5 7.09±0.32 27.89±0.28 8.0±1.0
F6 7.01±0.25 23.97±0.22 8.0±1.0
F7 7.11±0.66 26.03±0.27 8.0±1.0
F8 7.13±0.33 31.21±0.05 8.0±1.0
www.wjpps.com Vol 8, Issue 12, 2019. 1337
In-vitro release study
[image:27.595.71.561.159.529.2]In-vitro drug release study was performed to determine the release rate of the Rizatriptan Benzoate from the mucoadhesive buccal tablet. Results are shown in the table 6.7.
Table 5.7: % Drug release of the Rizatriptan Benzoate.
Time (hour) F1 F2 F3 F4 F5 F6 F7 F8 F9
0 0 0 0 0 0 0 0 0 0
1 35.9 30.4 26.8 33.2 30.4 30.5 12.6 10.9 8.6
2 52.6 48.3 45.9 43.9 40.3 39.8 30.6 25.3 19.6
3 70.6 65.8 61.5 58.8 55.9 54.9 40.1 35.2 30.4
4 86.8 83.2 82.6 69.4 66.7 63.8 49.4 45.3 41.3
5 99.5 96.9 92.8 82.4 78.3 75.6 59.4 55.6 49.5
6 99.5 99.3 98.7 91.6 86.9 86.4 70.1 66.2 62.3
7 99.5 99.4 99.8 98.7 96.9 94.1 79.4 76.2 73.9
8 99.5 99.6 99.9 99.9 97.8 98.5 89.4 85.9 82.8
Figure 5.5: % Drug release of Batch F1-F9.
From the comparison of drug release data of F1-F9 batch, it concluded that amount of polymer is playing very important role in formulation. Amount of polymer increase will increase the drug release time. All three of polymers give good release. But formulation F7 which contains HPMC K15M was release drug up to 8 hours. In contrast Sodium CMC givers early release within 5-6 hours. Further the HPMC K100M was retard the release and only 80-90% release at the end of 8 hours.
Swelling Index of Mucoadhesive Buccal Tablets
www.wjpps.com Vol 8, Issue 12, 2019. 1338 contact with water for 1 h to 8 hrs. The highest hydration (swelling) i.e. 62 was observed with the formulation F6. This may be due to quick hydration of polymer (HPMC K15M).
Table 5.8: Swelling.
Formulation code 0.5 hrs 1 hrs 2 hrs 4 hrs 6 hrs 8 hrs
F1 22 27 32 35 38 40
F2 17 23 35 37 42 44
F3 24 28 30 31 33 37
F4 27 31 35 39 41 44
F5 29 31 34 37 41 48
F6 23 29 33 48 54 62
F7 25 27 30 32 35 39
F8 29 31 37 40 44 47
F9 29 33 44 49 53 55
Index of Mucoadhesive Buccal Tablets F1-F9
Based on trial batches results, most satisfactory batch F6 which was near to the theoretical drug release profile having good mucoadhesive strength and residence time selected for further factorial screening.
5.5Analysis of Factorial batches R1-R9
[image:28.595.85.513.496.673.2]Factorial batches R1-R9 was checked for all evaluation parameters and the results were recorded in below table 6.9-6.11.
Table 5.9: Results of Pre compression parameters of factorial batches. Formulation
Code
Bulk density (g/ml)
(n=3)
Tapped density (g/ml)
(n=3)
%
Compressibility (n=3)
Hausner’s ratio (n=3)
R1 0.42 ± 0.02 0.49 ± 0.04 14.29 ± 0.04 1.17 ± 0.04
R2 0.45 ± 0.04 0.51 ± 0.05 11.76 ± 0.06 1.13 ± 0.07
R3 0.43 ± 0.05 0.53 ± 0.03 18.87 ± 0.02 1.23 ± 0.08
R4 0.48 ± 0.02 0.56 ± 0.03 14.29 ± 0.04 1.17 ± 0.05
R5 0.48 ± 0.03 0.55 ± 0.05 12.73 ± 0.05 1.15 ± 0.06
R6 0.48 ± 0.05 0.54 ± 0.04 11.11 ± 0.08 1.13 ± 0.04
R7 0.46 ± 0.04 0.50 ± 0.06 08.00 ± 0.07 1.09 ± 0.08
R8 0.43 ± 0.06 0.49 ± 0.04 12.24 ± 0.05 1.14 ± 0.02
www.wjpps.com Vol 8, Issue 12, 2019. 1339 Table 5.10: Results of post compression parameters of factorial batches.
Formulation Code Weight variation (mg) (n=20) Thickness (mm) (n=3) Hardness (kg/cm2)
(n=3)
Friability %
Drug content %(n=3)
R1 149.21±0.19 2.72±0.05 5.60±0.10 0.55±0.01 99.25±0.05
R2 151.13±0.28 2.36±0.09 5.29±0.15 0.59±0.02 99.10±0.04
R3 152.15±0.36 2.45±0.08 5.30±0.09 0.63±0.06 98.45±0.03
R4 149.36±0.39 2.32±0.05 5.25±0.13 0.45±0.02 98.14±0.04
R5 150.54±0.45 2.49±0.07 5.10±0.19 0.39±0.08 97.65±0.07
R6 151.12±0.29 3.30±0.08 5.35±0.12 0.60±0.03 99.42±0.02
R7 149.99±0.36 3.15±0.03 5.15±0.11 0.49±0.01 98.41±0.04
R8 150.46±0.42 3.00±0.05 5.48±0.13 0.53±0.03 98.16±0.05
[image:29.595.65.532.298.471.2]R9 151.42±0.28 2.89±0.06 5.50±0.18 0.44±0.05 96.25±0.06
Table 5.11: Evaluation of mucoadhesive properties of factorial batches. Formulation
Code
Surface pH (n=3)
% Swelling in 8 hours (n=3) Mucoadhesive strength (g) (n=3) Residence Time (hours)
R1 6.90±0.35 32.2±1.5 25.61±0.42 >8 hours
R2 7.10±0.31 35.4±2.6 27.40±0.15 >8 hours
R3 7.05±0.20 39.9±2.8 31.83±0.19 >8 hours
R4 7.10±0.10 42.5±1.9 30.24±0.26 >8 hours
R5 7.00±0.05 48.3±2.8 32.51±0.28 >8 hours
R6 7.10±0.15 51.7±3.5 34.22±0.38 >8 hours
R7 6.95±0.20 56.4±3.9 35.82±0.65 >8 hours
R8 6.90±0.10 59.2±4.1 37.93±0.28 >8 hours
R9 7.10±0.15 66.3±2.8 38.41±0.51 >8 hours
All results found satisfactory. Weight variation limit passed by all batches. Hardness was good enough and friability was below 1%. Good swelling index of all batches. Also, the Precompression parameters were good and hence the flow of blend was good enough. Surface pH was neutral as required. All batches have a residence time up to 8 hours. Mucoadhesive strength was also good enough.
Table 5.12: Drug release study of factorial batches.
Time (hour) 0 1 2 4 8
R1 0±0.00 39.9±5.4 50.1±3.1 74.5±2.7 99.9±1.6
R2 0±0.00 39.6±3.8 49.2±3.5 72.3±1.8 98.9±1.4
R3 0±0.00 38.4±2.5 48.3±2.4 70.2±1.7 99.9±0.9
R4 0±0.00 36.9±1.9 46.8±2.6 69.4±1.3 99.9±0.4
R5 0±0.00 35.9±2.6 45.2±1.4 67.9±2.2 99.9±0.9
R6 0±0.00 33.5±3.8 42.9±2.5 65.9±3.4 99.7±0.7
R7 0±0.00 31.5±4.6 42.5±2.3 63.9±2.9 99.9±0.3
R8 0±0.00 27.9±3.9 39.5±1.9 59.5±2.1 99.8±0.4
www.wjpps.com Vol 8, Issue 12, 2019. 1340 Figure 5.5: Drug release of factorial batch R1-R9.
% Drug release study of factorial batches clearly indicated that the amount of polymer
directly impact on dissolution. Higher the amount of polymer, decrease in drug release. Lower amount of polymer fast release the drug from the matrix. Hence the criteria were set as per theoretical drug release profile. Hence the best fitted batch was R8 which gives almost similar profile as per theoretical drug release profile.
Further, % permeability (diffusion) study was done for the factorial batches to check the % permeability of the drug in buccal mucosa. As compared to other batches, R8 gives satisfactory drug release. It gives more than 80% drug release in 8 hour which is good
enough. The permeability data was given in below table 6.13.
Table 5.13: Drug Permeability study of factorial batches. % Drug Permeability (n=3)
Time (hour) 0 1 2 4 8
R1 0±0.0 25.5±2.5 39.7±3.1 59.4±1.9 77.3±2.3
R2 0±0.0 23.6±3.1 37.1±4.5 61.1±1.4 75.8±2.1
R3 0±0.0 21.6±2.9 35.6±1.2 67.2±1.6 73.4±1.6
R4 0±0.0 20.9±1.4 34.2±2.4 54.6±1.2 71.3±1.4
R5 0±0.0 18.6±2.6 31.5±2.5 51.3±1.3 62.3±1.3
R6 0±0.0 15.9±1.9 28.4±1.8 45.6±1.4 55.6±1.7
R7 0±0.0 16.7±2.3 29.4±2.0 50.3±2.3 59.4±1.8
R8 0±0.0 17.7±2.4 42.9±3.1 65.9±2.1 81.2±1.5
[image:30.595.86.510.589.750.2]www.wjpps.com Vol 8, Issue 12, 2019. 1341 Figure 5.6: Drug Permeability study of factorial batch R1-R9.
Based on the factorial batches results the modelling of factorial design was done first and then the validation batch was taken. Once model validated, the final optimized batch was taken and completed analysis was done for that optimized batch.
5.6Analysis of factorial design
[image:31.595.91.507.71.311.2]Following data fitted in design Expert software to analyze the design.
Table 5.14: Factorial design analysis table. Batch Std Run
HPMC K15M
(mg)
Carbopol 971 P
(mg)
% Drug release at
1 hour
Mucoadhesive Strength (g)
R1 1 1 -1 -1 39.9 25.6
R2 2 2 -1 0 39.6 27.4
R3 3 3 -1 1 38.4 31.8
R4 4 4 0 -1 36.9 30.2
R5 5 5 0 0 35.9 32.5
R6 6 6 0 1 33.5 34.2
R7 7 7 +1 -1 31.5 35.8
R8 8 8 +1 0 27.9 37.9
www.wjpps.com Vol 8, Issue 12, 2019. 1342
ANOVA for Quadratic model Response 1: Drug Release at 1 hour
Source Sum of Squares df
Mean
Square F-value p-value Remarks Model 272.30 5 54.46 135.18 0.0010 Significant
A-HPMC K15M 216.00 1 216.00 536.15 0.0002
B-Carbopol 971 P 32.20 1 32.20 79.93 0.0030
AB 14.06 1 14.06 34.91 0.0097
A² 9.10 1 9.10 22.59 0.0177
B² 0.9339 1 0.9339 2.32 0.2252
Residual 1.21 3 0.4029 Cor Total 273.51 8
Factor coding is coded.
Sum of squares is Type III – Partial
The Model F-value of 135.18 implies the model is significant. There is only a 0.10% chance that an F-value this large could occur due to noise.
P-values less than 0.0500 indicate model terms are significant. In this case A, B, AB, A² are significant model terms. Values greater than 0.1000 indicate the model terms are not significant. If there are many insignificant model terms (not counting those required to support hierarchy), model reduction may improve your model.
Polynomial Equation for Drug release at 1 hour;
[image:32.595.85.512.523.742.2]Drug release at 1 hour =35.8889-6A-2.31667B-1.875AB-2.1333A2
www.wjpps.com Vol 8, Issue 12, 2019. 1343 Figure 5.8: Contour plot for Drug release at 1 hour.
ANOVA for Quadratic model Response 2: Mucoadhesive Strength.
Source Sum of
Squares df
Mean Square
F-value
p-value Remarks Model 155.30 5 31.06 56.21 0.0037 Significant
A-HPMC K15M 124.22 1 124.22 224.79 0.0006
B-Carbopol 971 P 27.31 1 27.31 49.42 0.0059
AB 3.24 1 3.24 5.86 0.0940
A² 0.5339 1 0.5339 0.9662 0.3981
B² 0.0089 1 0.0089 0.0161 0.9071
Residual 1.66 3 0.5526
Cor Total 156.96 8
Factor coding is Coded.
Sum of squares is Type III – Partial
The Model F-value of 56.21 implies the model is significant. There is only a 0.37% chance that an F-value this large could occur due to noise.
www.wjpps.com Vol 8, Issue 12, 2019. 1344 Polynomial Equation for Mucoadhesive Strength;
[image:34.595.96.508.125.385.2]Mucoadhesive Strength=3225.56+4.55A+2.13333B
Figure 5.9: Surface plot for Mucoadhesive Strength.
[image:34.595.88.509.418.682.2]www.wjpps.com Vol 8, Issue 12, 2019. 1345 Figure 5.11: Desirability plot.
Figure 5.12: Overlay Contour plot.
Validation of Factorial design
[image:35.595.93.508.367.634.2]www.wjpps.com Vol 8, Issue 12, 2019. 1346 Table 5.15: Check point batch.
X1 0.3761
X2 0.949
Drug release at 1 hour %
Predicated 29.84
Observed 29.10
% Bias 1.02
Mucoadhesive strength %
Predicated 35.80
Observed 35.00
% Bias 1.00
Remarks Acceptable
5.7Optimized Batch
[image:36.595.86.509.309.542.2]Finally, optimized batch (RO1) was prepared from the overlay plot and completed analysis was done for the same.
Figure 5.13: Overlay Contour plot for optimized batch. Table 5.16: Formulation table for Optimized batch RO1.
Ingredients (mg/Tablet) IO1 Rizatriptan Benzoate 12.5
HPMC K15M 39.5
Carbopol 971 P 24.5
Mannitol 18.5
PVPK 30 5
Aspartame 4
Talc 4
Magnesium Stearate 2
Baking layer Ethyl Cellulose 40
www.wjpps.com Vol 8, Issue 12, 2019. 1347 Table 5.17: Evaluation table for Optimized batch RO1.
Parameters Results for RO1 Batch
Appearance White colored round shape tablet
Weight Variation (mg) (±SD) (n=20) 150.10±0.65
Thickness (mm) (±SD) (n=3) 3.05±0.10
Hardness (kg/cm2) (±SD) (n=3) 5.10±0.08
Friability (%) (±SD) (n=3) 0.55±0.03
Drug Content (%) (±SD) (n=3) 99.75±0.05 % Swelling at 8 hours (±SD) (n=3) 61.2±3.9 Mucoadhesive Strength (g) (±SD) (n=3) 35.00±0.25 Residence Time (hours) (±SD) (n=3) 8.0±0.5
Surface pH (±SD) (n=3) 6.90±0.25
% Drug Release of Final Batch RO1
Time (hour) 0 1 2 4 6 8
RO1 0±0.00 29.5±2.6 38.6±2.4 60.3±2.0 81.5±1.5 99.7±0.8
Release Kinetic Study of Final Batch RO1 Batch
Zero order
First order
(R2)
Higuchi plot (R2)
Hixon Crowell
(R2)
Koresmeyer-peppas Plot
(R2) (R2) (R2) (R2) (R2) n
RO1 0.9731 0.7803 0.9784 0.7950 0.9710 0.738
The best fitted model was Higuchi (R2 = 0.9784) and the n and R2 values of Peppas model indicated that the release of drug was found to be non-Fickian diffusion.
Based on ex vivo mucoadhesion, ex vivo residence time and in-vitro release studies formulation RO1 was selected for ex vivo permeation study. Porcine buccal mucosa was selected for Permeation studies. The results of drug permeation from buccal tablets through the porcine buccal mucosa revealed that drug was released from the tablet and permeated through the porcine buccal membrane and could possibly permeate through the human buccal membrane. The drug permeation was slow and steady and 85.6% could permeate through the buccal membrane in 8 hours. The results were given in below table 6.18.
Table 5.18: Ex vivo Permeability study of Optimized batch RO1. % Drug Permeability
Time (hour) 0 1 2 4 6 8
www.wjpps.com Vol 8, Issue 12, 2019. 1348 Figure 5.14: Ex vivo permeability study of RO1 Batch.
Table 5.19: Comparison With marketed product.
Time in hour RO1 Marketed Product
0 0±0.00 0±0.00
1 29.5±2.6 96.9±1.0
2 38.6±2.4 99.9±0.5
4 60.3±2.0 -
6 81.5±1.5 -
8 99.7±0.8 -
As the marketed product was immediate release simple conventional tablets hence release within 1 hour.
[image:38.595.90.507.510.743.2]www.wjpps.com Vol 8, Issue 12, 2019. 1349 5.8 Stability study
Stabiity study of optimized batch RO1 was carried out for 1 month. After 1 month samples were collected and analysed for drug content, In vitro drug release and Appearance of tablets. Results were given in below table. Formulation RO1 was found stable during stability and no any criticle observation recorded.
Table 5.20: Results of stability study of optimized formulation RO1.
Parameter Initial After 1 month
Appearance No Change No Change
Drug Content (%) (±SD) (n=3) 99.75±0.05 99.55±0.15 Drug Release at 8 hours (%) (±SD) (n=3) 99.7±0.8 99.5±0.9 6. CONCLUSION
The present research was carried out to develop mucoadhesive buccal tablets of Rizatriptan
Benzoate. All the prepared tablet formulations were found to be good without capping and chipping. The mucoadhesive buccal tablets of Rizatriptan Benzoate prepared using HPMC K15M, K100M, Sodium CMC and Carbopol 971 P polymers by using direct compression method. The prepared mucoadhesive buccal tablets subjected to infrared spectrum study suggested that there was no drug -excipient interaction. All the prepared tablets were in acceptable range of weight variation, hardness, thickness, friability and drug content as per pharmacopoeial specification. The surface pH of prepared buccal tablets was in the range of salivary pH, suggested that prepared tablets could be used without risk of mucosal irritation. The buccal tablets showed good swelling up to 8 h in distilled water maintaining the integrity of formulation which is required for bioadhesion. The in-vitro release of Rizatriptan Benzoate was extended for 8 h. Formulations F6 batch shows good in- vitro drug release 99%. Hence based on that F6 batch is optimized and further screening was done using factorial design.