www.wjpr.net Vol 3, Issue 9, 2014. 1201
SPECTROPHOTOMETRIC DETERMINATION OF DOMAPRIDONE
IN PHARMACEUTICALS BY USING DIFFERENCE
SPECTROPHOTOMETRIC METHOD
*Dr. Mallapu. E. Rani
Assistant Professor, Dept. of Chemistry, Rayalseema University, Kurnool, Andhra Pradesh, India.
ABSTRACT
A new spectrophotometric method for the estimation of Domapridone in pharmaceutical formulations has been described. In this method the Domapridone containing phenolic groups produce a bathochronic shift in UV region under strong alkaline medium. The drug solution in basic medium is scanned over the UV region by taking the acidic drug solution as blank. From the absorbance values, Spectrum was constructed. Two wave lengths are selected one at positive peak and another at negative peak. The sum of the obsolete values at these wavelengths is called amplitude. The amplitude was proportional to the amount of respective drug. Results of analysis of this method were validated statistically evaluated.
KEYWORD: Domapridone, phenolic groups, UV.
INTRODUCTION
Domapridone chemically 5 – chloro – 1 – [1 –[3(2 oxo – 3h – benzo imidazol 1 – yl) propyl] – 4 piperidyl] – 3 – benzo – imidazol – 2 – one. It is freely soluble in methanol. It is used as control omittings in treatment of various diseases. The structure of Domapridone represented as in figure-1.
Volume 3, Issue 9, 1201-1206. Research Article ISSN 2277– 7105
Article Received on 13 September 2014,
Revised on 08 Oct 2014, Accepted on 31 Oct 2014
*Correspondence for
Author
Dr. Mallapu Easther
Rani
www.wjpr.net Vol 3, Issue 9, 2014. 1202 Fig: 1. Domapridone.
The survey of literature describes various spectrophotometric methods for the analysis of this drug. The objective of the present investigation is to develop a simple, rapid, precise, reproducible and economical method for the estimation of drug formulations by using difference spectrophotometric method.
Experimental
Apparatus
A Spectromic 1001 Spectrometer with 10 mm matched wartz cuvettes was used for absorbance values of the drug solution.
Reagents
All the chemicals used were of analytical grade and Analytical reagent grade methanol was used as solvent.
1. Standard Solution of Domapridone
An accurately weighted 50 mg of Domapridone was dissolved in methanol. The volume was adjusted to 50ml with methanol in 50 ml standard flask. Two ml of this solution was diluted to 50 ml with methanol to give a standard working concentration of solution 200 g / ml.
Spectophotometric Method
www.wjpr.net Vol 3, Issue 9, 2014. 1203 This stock solution concentration of 100 g / ml. Various aliquots of drug solution ranging from 1.0-4.0 ml flask. Was transferred into a serried of 25 ml volumetric flask. To each flask 1 ml of 10% sodium hydroxide was added and made unto the mask with distilled water. These flasks are Scanned over the range of 200-365 mm against the acidic drug solution as blank. From the absorbance values of Domapridone spectrum was constructed (Fig-2) two wave lengths are selected one at positive peak and another values at these wavelengths are called amplitude. The amplitude was proportional to the amount of drug. The calibration curve was plotted between amplitude values verses amount of drug presented in the figure -3.
Figure 2: Spectrum of Domeperidone.
0
0.2
0.4
0.6
0.8
1
1.2
1.4
1.6
1.8
2
0
100
200
400
600
A
m
p
ti
tu
d
e
Amount of Drug (Micro Grams)
Figure 2: Calibration curve of domeperidone.
-1 -0.5 0 0.5 1 1.5
200 225 250 275
Wavelength (nm)
A
b
s
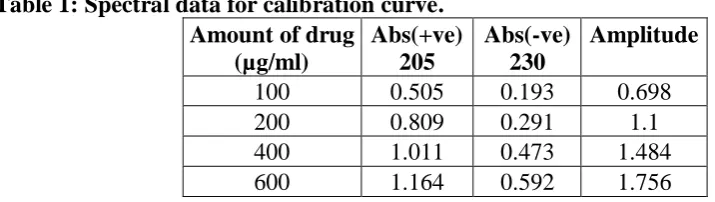
www.wjpr.net Vol 3, Issue 9, 2014. 1204 Table 1: Spectral data for calibration curve.
Amount of drug (µg/ml)
Abs(+ve) 205
Abs(-ve) 230
Amplitude
100 0.505 0.193 0.698
200 0.809 0.291 1.1
400 1.011 0.473 1.484 600 1.164 0.592 1.756 Amount of drug in micrograms / ml.
Method Validation
This method was validated in terms of linearity, accuracy and precision and reprocibility of the sample applications. A linear relation was found between absorbance and concentration in the ranges. Beer‟s law was obeyed in the concentration ranges.
Statistical Analysis
A Statistical analysis was performed on the statistically significant variables using the statistical software. The following parameters were determined. Co-efficient of variation, standard deviation and student –t-test. The Standard deviation and t-test of the methyldopa was calculated from five measurements of replicate samples. The values of standard deviation and teal were shown in table -1. The values of standard deviation and coefficient variation are low, indicates high accuracy and reproducibility of the method. The calculated „t‟ values are less than „t‟ theoretical values with 4(x-1=5-1) degrees of freedom at 5-1. Level of significance, indicate that there is no significant difference between proposed method and standard method.
Table 1: Statistical analysis of the determination of Domapridone.
Sample S.D teala ttab*
Tablet – 1 0.3435 2.213
2.78 Tablet – 2 0.3646 1.472
* Standard deviation
„a‟ calculated „t‟ value by proposed Method. „b‟ theoretical values at 95% confidence limit.
RESULTS AND DISCUSSION
www.wjpr.net Vol 3, Issue 9, 2014. 1205 another at 453 mm the sum of the absolute values at these wavelengths are called amplitude. The amplitude was proportional to the amount of drug. The calibration curve was plotted with the amplitude values verses amount of drug. The standard deviation values and total of the stilborstrol was calculated from five measurements of replicate samples. The values of standard deviation and teal values are low, indicated high accuracy and reproducibility of the method. The data of assay values of commercial formulations was subjected „t‟ values are less than „t‟ theoretical values with 4(2-1=5-1) degrees of freedom at 5% level of significance indicate that there was no significant difference between proposed method and standard method. Hence the procedure described by the proposed assay can be successfully adopted for the estimation of Domapridone in tablets. The results are given in Table-2.
Table-2
Sample Labeled Amount mg/tab Amount found mg/tab %recovery
Tablet – 1 5 4.86 96.0
Tablet – 2 5 4.76 95.2
CONCLUSIONS
The proposed method was found to be simple, precise, accurate, and less time consuming and it can be successfully adopted for the estimation of Domapridone in pharmaceutical formulations.
REFERENCES
1. Mohamed ME et al., “First-derivative UV spectrophotometric assay of domperidone”, Farmaco. 1989; 44(11):1045-52.
2. M. Baudry et al, “3H-Domperidone: A selective ligand for dopamine receptors”, Naunyn-Schmiedeberg's Archives of Pharmacology, September 1979; 308(3): 231-237.
3. M.S. Charde et al., “UV-Spectrophotometric estimation of Ranitidine and Domoperidone in tablet formulation”, Indian Journal of Pharmaceutical Sciences, September-October
2006; 658-659.
4. M.S. Charde et al., “Simulteneous estimation of Ranitidine and Domoperidone in Combined Dosage form”, Indian Journal of Pharmaceutical Sciences, September-October 2006; 660-662.
www.wjpr.net Vol 3, Issue 9, 2014. 1206 6. Sahu R et al., “Simultaneous spectrophotometric estimation of famotidine and
domperidone in combined tablet dosage form”, 2006; 68(4): 503-506.
7. T. M. MacDonald, “Metoclopramide, domperidone and dopamine in man: actions and interactions”, European Journal of Clinical Pharmacology, March 1991; 40(3): 225-230. 8. Vinodhini C etal, “Simultaneous estimation of cinnarizine and domperidone in solid oral