871
©IJRASET: All Rights are Reserved
Experimental Study on Stabilization of Subgrade
by using Waste Rubber Tyre Shread
Prof. Vaijwade Sujit. M1, Wagh Aditya2, Jadhav Akshay3, Dabhade Chaitanya4, Karad RANI5, Pawar Kirti6
1
Lecturer, Department of Civil Engineering, MGM’s Polytechnic, Aurangabad, Maharashtra, India
2, 3, 4, 5, 6
Student, Department of Civil Engineering, MGM’s Polytechnic, Aurangabad, Maharashtra, India
Abstract: The tyre shread as soil stabilizer are cheap in cost and rather they are available abundantly in market. The objective of project is to investigate the effect of Tyre shread (constant percentage) on the strength properties of expansive soil with high compressibility (CH). This project study involves the investigation of the effect of Tyre shread on black cotton soil to which a series of Standard Proctor Tests and California Bearing Ratio (CBR) tests are conducted on both virgin soil and reinforced soil for which tyre shread is used in two condition i.e. tyre shread pass through 4.75mm sieve and retain on 4.75 mm sieve with varying percentages of Tyre shread (3%, 6%, 9%).
Keywords: Tyre shread, black cotton soil, stabilization, California bearing ratio
I. INTRODUCTION
As per Indian scenario the output of waste material are more than 1.3 billion tons, third in all over the world. The scrap tyre per each year is 65million tons and increasing steadily year by year.
Tyre recycling or rubber recycling is the process of recycling vehicles' tyres that are no longer suitable for use on vehicles due to wear or irreparable damage (such as punctures).
These tyres are among the largest and most problematic sources of waste, due to the large volume produced, their durability, and the fact they contain a number of components that are ecologically problematic.
It is estimated that 259 million tyres are discarded annually. The same characteristics that make waste tyres problematic, their cheap availability, bulk, and resilience, also make them attractive targets for recycling. Material recovered from waste tyres, known as "crumb," is generally only a cheap "filler" material and is rarely used in high volumes. They are made to be highly durable and weatherproof, which causes mass landfill space to be used up, as tyres are non bio-degradable.
Soil stabilization is the process which improves the physical properties of soil, such as shear strength, bearing capacity which can be done by use of controlled compaction or addition of suitable admixtures like cement, lime, sand, fly ash or by providing geo textiles, geo synthetics etc.
The new technique of soil stabilization can be effectively used to meet the challenges of society, to reduce the quantities of waste producing useful material from non-useful waste materials. Since the use of tyre automobile company has been advancing speedily and its disposal has been a problem all the time regarding the environmental concern, using tyre in the form of tyre shread as soil stabilizer would reduce the problem of disposing the tyre as well as increases the density and California Bearing Ratio (CBR) of soil in an economical way with the utilization of tyre waste as soil stabilizer Different contents of tyre shread with the size of retain on 4.75mm sieve and passing through 4.75mm sieve (% by weight varying from 0% to 9%) are added to the Black Cotton Soil and the optimum percentage of tyre shread in soil was found out by conducting California Bearing Ratio Test.
II. RELATEDWORK
Umar jan (1) concluded that in his study of “Soil Stabilization Using Shredded Rubber Tyre” Based on the experiments carried out on soil and soil-tyre mixtures, In this study the shreaded tyre used in different percentage i.e.4%,6%,8%,12%by weight of soil.The optimum moisture content as well as maximum dry density is found to decrease with the increase of the percentage of rubber tyre content this might be due to light weight nature of tyre waste and The percentage enhancement in CBR value of stabilized soil is 66.28 % in unsoaked condition whereas an increase in CBR value can considerably trim down the total thickness of the pavement and hence the total cost concerned in the project. Jagtar Singh (2) concluded in his study of “Improvement of Engineering Properties of clayey soil using shredded rubber tyre”.
872
©IJRASET: All Rights are Reserved
the increasing CBR value decreases the thickness of road pavement.Preetpal Singh (3) concluded in his study of “Influence of Tire Chips on the behaviour of Soil: A Review” his paper briefly discussed the impact of the tire chips on the behaviour of soil mixed with the tire chips.
For the utilization of the waste material for geotechnical purposes it is important to understand its impact on the behavior of soil.R. Ayothiraman (4) concluded in his study of “Improvement of sub grade soil with shreaded rubber tyre”. Based on the experiments carried out on soil and soil + tyre mixtures, the following observations and conclusions are drawn: Dry density reduces with increase of % tyre waste; however, there is no significant change in OMC. This could be due to light weight nature of tyre waste. Tyre waste material mixed with soil showed improvement in CBR value with its addition up to 2% and there onwards decreased with further increase in tyre content in unsoaked/soaked condition.
III. METHODOLOGY A. Sample Collection
1) Black Cotton Soil: The black cotton soil used in the present study is locally available soil taken from balapur village near gandhile Aurangabad. The material was excavated from 1m below the ground surface. Soil is the principal material for the construction of embankment and sub grade of highways. The design and performance of the pavement, particularly the flexible pavement, depends on the type of sub grade soil and its properties. Some of the essential laboratory tests were carried out to determine the engineering properties i.e. index properties, atterberg limits, and compaction and strength characteristics of the soils. Laboratory tests were carried out as per relevant IS codes.
2) Waste Rubber Tyre Shread: Waste rubber tyre shread is collected from kiran remoulding factory near Harsul T-point, Aurangabad. The disposal of waste tyre causes environmental pollution, it’s a sustainable waste. Tyre can be recycled or reuse i.e. in the form of waste rubber shread form we can use this waste tyre. Such waste of tyre be used as additives for stabilized soil.
B. Experimental Work
1) Water Content (W %): It is nothing but moisture content present in untreated soil sample or it is defined as weight of water present in soil to the weight of soil solids in percentage. It should be determined with reference of relevant IS code IS 2720 PART II by oven drying method.
2) Sp. Gravity: It is simply defined as the ratio of unit wt. of soil solid to the unit wt. of standard liquid i.e. water. This test should be performed with the help of relevant IS code IS2720 Part III.
3) Atterberg Limits
a) Liquid Limit (Wl): It is defined as the minimum water content at which soil is in liquid state, but has a small shearing strength against flowing. It arbitrary limit between liquid and plastic states of consistency of soil.
b) Plastic Limit (WP): It is defined as water content at which soil is in plastics state. It is arbitrary limit between plastic and semi-solid state of consistency of a soil.
c) Plasticity Index (IP): The range of consistency within which a soil exhibits plastics properties is called as plasticity index or plastic range.
d) Standard Proctor Test: When the soil is compacted, it is generally compacted along with adding water. Upto an optimum water content gives maximum dry density to soil. If water content less than that of optimum value or more than optimum value then it will give less compacted density i.e. dry density thus to determine this optimum moisture content the common test is adopted as standard proctor test with relevant IS code IS 2720 part VII.
C. California Bearing Ratio Test
It is ratio of force per unit area required to penetrate a soil mass with the circular plunger of 50mm diameter. At the penetrating rate of 1.25mm/minute to that required for corresponding penetration or load caring capacity of standard material. simply it the relative measure of penetration of soil w.r.to loading and it is defined as the ratio of load sustained by the specimen at 2.5 or 5mm penetration to the load sustained by Standard Aggregate at corresponding penetration level.
873
©IJRASET: All Rights are Reserved
IV. EXPERIMENTALRESULTS
[image:3.612.49.553.302.500.2]The properties of black cotton soil should be determined with the help of relevant IS codes as the mention below with the test result of soil
Table.no.1 shows the properties of black cotton soil i.e. un-treated soil (Plain soil+ 0% tyre shread).
Sr. No Properties Values
1 Water Content 5.33%
2 Sp. Gravity 2.36
3 Liquid Limit 60%
4 Plastic Limit 55.56%
5 MDD 1.62gm/cm3
6 OMC 18.2%
7 CBR (Unsoak) 3.49%
8 CBR (Soak) 1.95%
A. The Following Graphs Showing Compaction Curve At Various Condition Of Various Dosage Of Tyre Shread
In this study the tyre shread are used in two condition
1) Tyre shread paasing through 4.75mm sieve
2) Tyre shread retain on 4.75mm sieve
0 0.5 1 1.5 2
0 5 10 15 20 25
d ry d en si ty
water content (%)
compaction curve 1.35 1.4 1.45 1.5 1.55 1.6 1.65
0 5 10 15 20 25
d r y d e n si ty
water content (% )
compaction curve
[image:3.612.58.533.558.717.2]Graph No.1 Graph No.2
Fig no1 shows compaction curve for plain soil + 0% tyre shread at which MDD is1.62 gm/cm3 and OMC of 18.2%. Fig no.2 shows compaction curve for plain soil + 3% tyre shread (passing through 4.75mm sieve) at which value of OMC is 18% and MDD is 1.71gm/cm3.
1.6 1.65 1.7 1.75 1.8
0
10
20
30
d ry d en si ty
water content (%) compaction curve 1.6 1.65 1.7 1.75 1.8 1.85
0 5 10 15 20 25
d ry d e n si ty
water content (%)
compaction curve
874
[image:4.612.69.559.121.298.2]©IJRASET: All Rights are Reserved
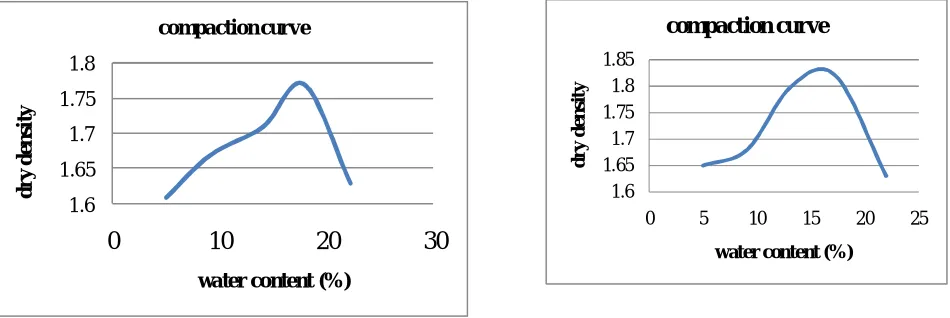
Fig no.3 shows compaction curve for plain soil + 6% tyre shread (passing through 4.75mm sieve) at which value of OMC is 17.9% and MDD is 1.77gm/cm3. Fig no.4 shows compaction curve for plain soil + 9% tyre shread (passing through 4.75mm sieve) at which value of OMC is 17.3% and MDD is 1.82gm/cm3.
1.4 1.45 1.5 1.55 1.6
0 5 10 15 20 25
d r y d e n s it y
water content (% ) compaction curve
1.5 1.55 1.6 1.65
0 5 10 15 20 25
dr y d en s it y
water content (% )
compaction curve
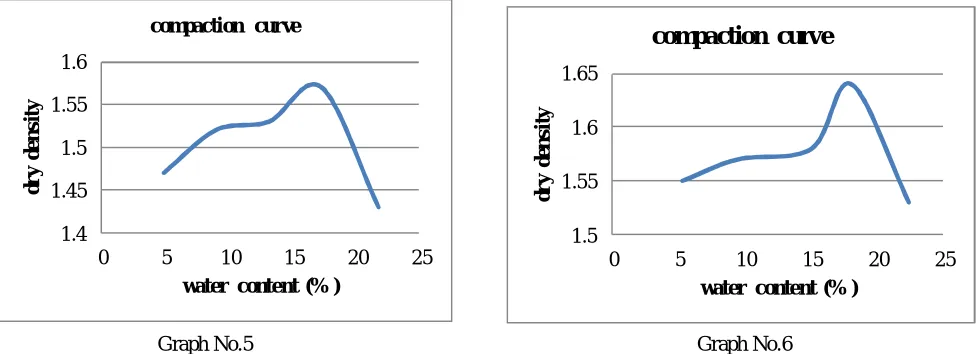
[image:4.612.61.556.358.522.2]Graph No.5 Graph No.6
Fig no.5 shows compaction curve for plain soil + 12% tyre shread (passing through 4.75mm sieve) at which value of OMC is 17.3% and MDD is 1.53gm/cm3. Fig no.6 shows compaction curve for plain soil + 3% tyre shread (retain on 4.75mm sieve) at which value of OMC is 18.1% and MDD is 1.64gm/cm3.
1.6 1.65 1.7 1.75 1.8
0 5 10 15 20 25
d r y d e n s it y
water content (% )
compaction curve
1.52 1.54 1.56 1.58 1.6 1.62 1.64
0 5 10 15 20 25
dr y d en s it y
water content (% ) compaction curve
Graph No.7 Graph No.8
Fig no.7 shows compaction curve for plain soil + 6% tyre shread (retain on 4.75mm sieve) at which value of OMC is 18.1% and MDD is 1.76gm/cm3. Fig no.8 shows compaction curve for plain soil + 9% tyre shread (retain on 4.75mm sieve) at which value of OMC is 17.9% and MDD is 1.63gm/cm3.
[image:4.612.123.492.615.724.2]B. Compaction Characteristics of BCS
Table.no.2. shows the compaction characteristic of black cotton soil. Material Passing through 4.75mm sieve Retain on 4.75 mm sieve
Sample OMC MDD OMC MDD
Plain Soil 18.2 1.62 ..
Plain Soil+3% 18 1.71 18.1 1.64
Plain Soil+6% 17.9 1.77 18.1 1.76
Plain Soil+9% 17.3 1.82 17.9 1.63
875
©IJRASET: All Rights are Reserved
Graph No. 9 Graph No. 10
Ghraph No. 9 shows the variation of Maximum Dry Density with increse in Persentage of Tyre Shread which is passing through 4.75 mm IS Sieve. Ghraph No.10 shows the variation of Maximum Dry Density with increse in Persentage of Tyre Shread which is retained on 4.75 mm IS Sieve.
C. CBR Results
1) Type 1- tyre shread passing through 4.75mm sieve
Table.no.3. Load-Penetration Relations of CBR Test of un-soak CBR.
Penetration In mm
Loading In kg
0% tyre shread
3% tyre shread
6% tyre shread
9% tyre shread
12% tyre shread
0 0 0 0 0 0
0.5 11.76 29.79 28.22 28.22 18.03
1 28.22 39.98 44.69 40.77 36.06
1.5 38.42 60.37 67.42 76.83 47.82
2 43.90 67.42 82.32 87.02 68.99
2.5 47.82 75.26 98.78 108.98 79.18
3 51.74 79.18 103.49 110.54 83.10
3.5 54.10 85.46 108.19 112.11 86.24
4 55.66 90.94 110.54 114.46 89.38
4.5 57.23 94.08 112.90 116.82 90.94
5 60.37 97.22 115.25 118.38 92.51
7.5 63.50 106.62 119.17 122.30 94.86
10 69.78 112.90 123.87 124.66 98.78
12.
876
©IJRASET: All Rights are Reserved
Table.no.4. Load-Penetration Relations of CBR Test of soak CBR.
Penetration (mm)
Loading In kg 0% tyre
shread
3% tyre shread
6% tyre shread
9% tyre shread
12% tyre shread
0 0 0 0 0 0
0.
5 9.41 12.54 25.09 21.95 18.03
1 12.54 21.95 40.77 38.42 32.14
1.
5 18.03 32.93 51.74 51.74 43.90
2 20.38 39.98 63.50 68.99 48.61
2.5 26.66 49.39 72.13 76.83 57.23
3 27.44 51.74 74.48 83.10 59.58
3.
5 28.22 53.31 76.83 90.94 65.86
4 28.22 54.10 78.40 94.08 68.99
4.
5 29.01 54.88 80.75 101.14 71.34
5 29.79 55.66 82.32 104.27 76.83
7.
5 32.14 59.58 90.94 106.62 79.18
10 33.71 65.07 95.65 111.33 83.10
12
.5 36.85 67.42 97.22 113.68 87.81
2) Type 2- Tyre Shread retain on 4.75mm sieve
Table.no.5. Load-Penetration Relations of CBR Test of un-soak CBR.
Penetration (mm)
Load in kg 0% tyre
shread
3% tyre shread
6% tyre shread
9% tyre shread
0 0 0 0 0
0.5 11.76 16.46 26.66 28.22
1 28.22 32.14 43.90 40.77
1.5 38.42 43.12 54.10 76.83
2 43.90 51.74 63.50 87.02
2.5 47.82 61.15 69.78 67.42
3 51.74 64.29 72.91 110.54
3.5 54.10 69.78 76.05 112.11
4 55.66 75.26 79.18 114.46
4.5 57.23 79.18 85.46 116.82
5 60.37 82.32 93.30 83.89
7.5 63.50 90.16 102.70 122.30
10 69.78 94.08 110.54 124.66
877
©IJRASET: All Rights are Reserved
Table.no.6. Load-Penetration Relations of CBR Test of soak CBR.
Penetration (mm)
Load in kg 0% tyre
shread
3% tyre shread
6% tyre shread
9% tyre shread
0 0 0 0 0
0.5 11.76 10.98 20.38 12.54
1 28.22 18.03 32.93 20.38
1.5 38.42 24.30 39.98 30.58
2 43.90 32.93 47.82 36.06
2.5 47.82 39.98 54.10 41.55
3 51.74 43.12 55.66 42.34
3.5 54.10 45.47 61.94 47.82
4 55.66 46.26 67.42 52.53
4.5 57.23 47.04 68.99 54.10
5 60.37 47.82 71.34 55.66
7.5 63.50 54.10 75.26 60.37
10 69.78 57.23 79.18 65.86
12.5 75.26 63.50 87.81 68.99
Type 1- Tyre shread passing through 4.75mm sieve
% tyre shread
CBR (un-soak) value CBR (soak) value At 2.5mm At 5mm At 2.5mm At 5mm
0 3.49 2.94 1.95 1.45
3% 5.49 4.73 3.61 2.71
6% 7.21 5.61 5.26 4.01
9% 7.95 5.70 5.61 5.07
12% 5.78 4.50 4.18 3.74
Type 2- tyre shread retain on 4.75mm sieve
% tyre shread
CBR (un-soak) value CBR (soak) value At 2.5mm At 5mm At 2.5mm At 5mm
0 3.49 2.94 1.95 1.45
3% 4.46 4.01 2.92 2.33
6% 5.09 4.54 3.95 3.47
9% 4.92 4.08 3.03 2.71
878
©IJRASET: All Rights are Reserved
Graph no. 11 shows the CBR value of plain soil with different percentage of Tyre Shread which is passing through 4.75 mm Is Sieve in Unsoak and Soak Condition. Graph no.12 shows the CBR value of plain soil with different percentage of Tyre Shread which is retained on 4.75 mm Is Sieve in Unsoak and Soak Condition.
V. CONCLUSION
On the basis of results and analysis the MDD is increases by increasing the percentage of tyre shread upto 9% by weight of soil of a size passing through 4.75mm sieve and further increasing tyre shread MDD decreases.
The MDD value for size retain on 4.75mm sieve is increases upto 6% by weight of soil further increasing tyre percentage MDD value decreases.
The CBR value increases by increasing percentage of tyre shread upto 9% by weight of soil for tyre shread size passing through 4.75mm sieve and CBR value for size of tyre shread retain on 4.75mm sieve is increases by increasing percentage of tyre shread upto 6% further increasing CBR value decreases.
Increasing CBR value decreases overall thickness of road pavement through which economy can be achieve.
VI. ACKNOWLEDGMENT
I would like to express my gratitude towards my guide Prof. S. M. VAIJWADE for the useful comments, remarks and for giving his valuable guidance and inspiration throughout the learning process of this report.. Furthermore I would like to thank our HOD (Prof. U. L. SALVE) for making available all the facilities for the successful completion of this work and other staff members of Civil Department for their valuable help. It is with humble gratitude & sense of indebtedness; I thank my respected and esteemed Principal (Dr. B. M. PATIL) for his valuable guidance, suggestion and constant support which lead towards successful completion of this work.
REFERENCES
[1] P.T. Ravichandran el at (2016) “Effect of addition of waste tyre crumb rubber on weak soil stabilization”, Indian journal of science and technology. [2] Tanveer asif zerdi “utilization of shreaded rubber tire in soil stabilization”, International journal of scientific research.
[3] A.Venkata Ratnam “Influence of Waste Tyre Rubber Chips on Strength and Settlements of Soils”, International Journal of Engineering Innovation & Research. [4] Umar Jan el at (2015) “soil stabilization using shreaded rubber tyre”’ International research journal of Engineering and technology.
[5] Jagtar Singh el at (2016), “A study of improvement properties of clayey soil using waste shredded rubber tyre”, International journal of theoretical and applied sciences.
[6] Swarna Surya Teja el at (2015) “Stabilization of sub grade soil of highway pavement using waste tyre pieces”, International research of innovative esearch in science engineering and technology.
[7] Preetpal Singh el at (2016) “Influence of tire chips on the behaviour of soil a review”, Journal of civil engineering and environmental technology. [8] R. Ayothiraman el at (2011) “Improvement of sub grade soil with shredded waste tyre chips”, Indian geotechnical society.