M E T H O D O L O G Y A R T I C L E
Open Access
Detection of three closely located single
nucleotide polymorphisms in the EAAT2 promoter:
comparison of single-strand conformational
polymorphism (SSCP), pyrosequencing and Sanger
sequencing
Shavanthi Rajatileka
1, Karen Luyt
2,4, Maggie Williams
3, David Harding
4, David Odd
2,5, Elek Molnár
6and Anikó Váradi
1*Abstract
Background:Single-strand conformational polymorphism (SSCP) is still a frequently used genotyping method across different fields for the detection of single nucleotide polymorphisms (SNPs) due to its simplicity, requirement for basic equipment accessible in most laboratories and low cost. This technique was previously used to detect rs4354668:A > C (g.-181A > C) SNP in the promoter of astroglial glutamate transporter (EAAT2) and the same approach was initially used here to investigate this promoter region in a cohort of newborns.
Results:Unexpectedly, four distinct DNA migration patterns were identified by SSCP. Sanger sequencing revealed two additional SNPs: g.-200C > A and g.-168C > T giving a rise to a total of tenEAAT2promoter variants. SSCP failed to distinguish these variants reliably and thus pyrosequencing assays were developed. g.-168C > T was found in heterozygous form in one infant only with minor allele frequency (MAF) of 0.0023. In contrast, g.-200C > A and -181A > C were more common (with MAF of 0.46 and 0.49, respectively) and showed string evidence of linkage disequilibrium (LD). In a systematic comparison, 16% of samples were miss-classified by SSCP with 25-31% errors in the identification of the wild-type and homozygote mutant genotypes compared to pyrosequencing or Sanger sequencing. In contrast, SSCP and pyrosequencing of an unrelated single SNP (rs1835740:C > T), showed 94% concordance.
Conclusion:Our data suggest that SSCP cannot always detect reliably several closely located SNPs. Furthermore, caution is needed in the interpretation of the association studies linking only one of the co-inherited SNPs in the EAAT2promoter to human diseases.
Keywords:EAAT2promoter, Single nucleotide polymorphism, Genotyping, Pyrosequencing, SSCP, Premature newborns, Dried blood spots, Glutamate regulation
* Correspondence:[email protected]
1Centre for Research in Biosciences, Department of Biological, Biomedical and Analytical Sciences, Faculty of Health and Applied Sciences, University of the West of England, Bristol BS16 1QY, UK
Full list of author information is available at the end of the article
Background
Genetic analysis is one of the fastest-growing areas of clinical diagnostics. Changes to a single nucleotide, known as single nucleotide polymorphism (SNP) is one of the major types of variants identified in the human genome. On average, in the human genome SNPs are distributed at 1 SNP per 1000 base pairs [1,2]. Some of these inherited SNPs play an important role in human diseases, while others are less relevant clinically and are phenotypically silent.
PCR amplification followed by Sanger DNA sequencing is one of the most commonly used methods of identifying SNPs in a sample cohort [3,4]. However, the cost per sam-ple is still relatively high [5] and typically the sequencing run length is ~3 hours (based on genotyping ~700 bp amplicon using capillary array electrophoresis technology) [6]. Due to these drawbacks single-strand conformation polymorphism (SSCP) is still very frequently used across many different fields for SNP detection [7-15]. SSCP is a rapid, reproducible and quite simple method that does not require specialised expensive equipment or reagents. The SSCP process involves PCR amplification of the target fragment, denaturation of the double-stranded PCR product with heat and formamide and electrophoresis on a non-denaturing polyacrylamide gel. During elec-trophoresis the single-stranded DNA (ssDNA) frag-ments fold into three-dimensional shape depending on their primary sequence [7]. DNA fragments can then be genotyped as a result of their different migration pat-terns and then confirmed by Sanger sequencing. SSCP sensitivity varies considerably from 70% to 95% [16-19]. The disadvantages of this technique are that it is rela-tively labour intensive, low throughput and requires Sanger sequencing of a representative sample cohort to confirm the nucleotide sequence.
Pyrosequencing [20], a non-gel based, real-time, DNA sequencing-by-synthesis technique that is based on the luminometric detection of released pyrophosphate (PPi) during nucleotide incorporation, has also been used extensively for sample genotyping [21-26]. Pyrosequencing relies on a cascade of enzymatic reactions that yields detectable light, which is proportional to the incorpo-rated nucleotides. The resulting pyrograms produce peak patterns in short stretches of the DNA sequence analysed, which vary between genotypes, and can distinguish between the different alleles at a named position. A large number of samples can therefore be analysed in a cost and time effective manner.
In this study, we investigated a previously identified SNP (rs4354668:A > C; [11]) in the promoter of the astroglial glutamate transporter EAAT2 (SLC1A2) at position -181bp (g.-181A > C) in genomic DNA of newborn infants. The rational for looking at this particular SNP was that previous studies using SSCP found association
of this SNP with increased extracellular glutamate levels and neurodegeneration in adult stroke patients [11]; with a higher risk of relapsing multiple sclerosis [27] and the progression of migraines into chronic daily headaches [28]. Unexpectedly, we identified two additional SNPs in the EAAT2 promoter; g.-200C > A and g.-168C > T. The g.-168C > T SNP was only found in one individual in a heterozygous form in the entire cohort. In contrast, g.-200C > A and g.-181A > C sequence variants were much more common and they were in Linkage Disequilibrium (LD). SSCP was not discriminatory enough to clearly show differences between the various genotypes and 31% of homozygote mutants (mutant/mutant; MT/MT) and 25% wild-type (WT/WT) genotypes were identified incorrectly using this technique when compared to sequencing data. In contrast, pyrosequencing detected all naturally occur-ring variants in the highly GC-rich region and showed 100% concordance with Sanger sequencing suggesting that it can be used successfully to detect closely posi-tioned and linked SNPs. Our data also indicate that the interpretation of the studies [11] attributing a causal link between g.-181A > C and adult neurological diseases is incomplete as the SNP was potentially misclassified and the LD with another SNPs not considered.
Methods
Sample collection and processing
Newborn dried blood spots (DBS) were collected from predominantly Caucasian infants (91.6% white, 8.4% non-white) born in the greater Bristol area (UK) participating in an association study to investigate the genetic back-ground of newborn infants to white matter brain injury. The study received ethical approval in April 2008 from the National Research Ethics Service, UK (REC reference number 10/H0106/10 [29]). Samples, collected from 239 infants within the past 3-22 years, were used in the study. All blood spot screening cards were stored in the biobank in boxes at room temperature. Whole blood samples were collected from nine healthy adult volunteers to optimise protocols used in the study. Genomic DNA was isolated and quantified as we described previously [29].
PCR amplification of EAAT2 promoter for SSCP analysis
Previously described primers EAAT2F and EAAT2R were used to amplify the EAAT2 promoter fragment (GeneBank accession AF510107.1; Figure 1 and Table 1 [11]). All PCR reactions were carried out for 35 cycles in a total volume of 25μl, containing 1× high fidelity reac-tion buffer - (500 mM KCl, 100 mM Tris-HCl, pH 8.3), 1 mM of MgCl2, 200 μM of each dNTP, 100 pmol of
of 1× GC-rich solution (Roche Diagnostics Limited, West Sussex, UK) was added to each reaction. Reaction parameters were 95°C for 5 min followed by 35 cycles of 95°C for 30 s, 60°C for 45 s and 72°C for 1 min. A final extension at 72°C was carried out for 10 min.
SSCP analysis
SSCP was performed as previously described [8]. PCR samples were resolved on 0.5× acrylamide gels containing 12.5 ml MDE® (Mutation Detection Enhancement) gel solution (Lonza Group Ltd., Basel, Switzerland), 3 ml of 10× TBE (Tris/Borate/EDTA, pH 8.3) buffer, 34.28 ml deionised water, 20 μl tetramethylethylenediamine (TEMED; Sigma-Aldrich, St Louis, Missouri, UK) and 200 μl of freshly prepared 10% ammonium persulfate (APS; Sigma-Aldrich, St Louis, Missouri, UK). PCR samples were prepared for electrophoresis as follows; 3μl of PCR product was mixed with 7μl of denaturing load-ing buffer (95% formamide, 0.025% bromophenol blue, 0.025% xylene cyanol and 20 mM EDTA) (all reagents from Sigma-Aldrich, St Louis, Missouri, UK). The mix-ture was heated to 95°C for 5 min, rapidly cooled on ice and then 10 μl was loaded and run for 30 min at 300 V. The voltage was then reduced to 150 V and the DNA strands separated for 14 h at room temperature (~20°C).
The gel was washed twice in distilled water for 10 s and then incubated in 0.5% glacial acetic acid (Fisher Scientific, Loughborough, UK) and 10% molecular grade ethanol (Sigma-Aldrich, St Louis, Missouri, UK). The gel was then incubated in 0.1% silver nitrate (Sigma-Aldrich, St Louis, Missouri, UK) solution for 20 min and rinsed with distilled water twice. The gel was then washed with developing solution, 1.5% NaOH (Fisher Scientific, Loughborough, UK) and 0.15% molecular grade formaldehyde (Sigma-Aldrich, St Louis, Missouri, UK) for 20 min. The gel was fixed in 0.75% sodium carbonate (Fisher Scientific, Loughborough, UK) solution for 10 min. The DNA bands were visualized on a light box and the samples were scored.
Generation of biotinylated PCR products for pyrosequencing
Two sequence-specific primers (EAAT2PyroF-BIO and EAAT2PyroR; Figure 1, Table 1) were designed to flank all SNPs in the EAAT2 promoter using the software provided by Qiagen Pyrosequencing, with the forward primer biotinylated. PCR reactions contained 1× PCR buffer (500 mM KCl, 100 mM Tris-HCl, pH 8.3), 1.5 mM MgCl2, 200μM of each dNTP, 100 pmol of each
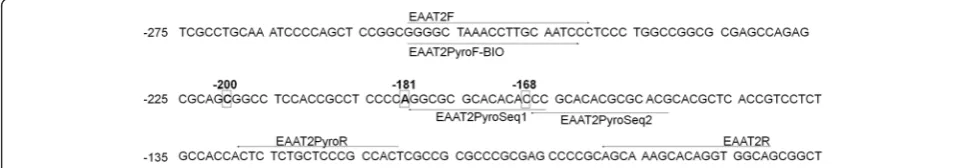
[image:3.595.56.533.91.175.2]oligo-nucleotide and 1 unit of high fidelity Taq polymerase Figure 1Promoter sequence of the humanEAAT2(Accession AF510107.1).The primers and the positions of the three SNPs at -200bp (g.-200C > A), -181bp (g.-181A > C) and -168bp (g.-168C > T) are indicated. Numbering is relative to the transcription start site. Primers EAAT2F and EAAT2R were used for standard PCR and Sanger sequencing while EAAT2PyroF-BIO and EAAT2Pyro-R were used to generate biotinylated PCR products and EAAT2PyroSeq1 and EAAT2PyroSeq2 for pyrosequencing (see also Table 1).
Table 1 Pyrosequencing primers and conditions used in the study
Oligonucleotide Sequence 5′-3′ Product (bp) Annealing T (°C) Annealing T (°C)
EAAT2F GGGGCTAAACCTTGCAATCC 180 65 None
EAAT2R CTGCCACCTGTGCTTTGC
EAAT2PyroF-BIO GGGGCTAAACCTTGCAATC 166 60 5′Biotin
EAAT2PyroR GAGTGGCGGGAGCAGAGA None
EAAT2PyroSeq1 GGGTGTGTGCGCGCC N/A None
EAAT2PyroSeq2 CCGCACACGCGCACG N/A None
Target sequence for pyrosequencing (1) T/GGGGGAGGCGGTGGAGGCCG/TCTG
Nucleotide dispensation order (1) CGTGCAGCGTGAGCGTGC
Target sequence for pyrosequencing (2) G/ATGTGTGCGCGCC
Nucleotide dispensation order (2) CAGTGTGT
[image:3.595.60.543.553.707.2](FastStart High Fidelity Taq Polymerase, Roche Diag-nostics Limited, West Sussex, UK) per reaction. Two microlitres of genomic DNA (containing 4-6 ng DNA) was used per reaction. Amplification was performed with the following conditions: 95°C for 5 min; 50 cycles of 94°C for 30 s, 60°C for 30 s and elongation at 72°C for 30 s; followed by the final extension for 10 min at 72°C. Pyrosequencing and Sanger sequencing were carried out as we described previously [29]. The target sequence for analysis and the nucleotide dispensation order for the pyrosequencing assay are shown in Table 1. Purified PCR products were Sanger sequenced using primer EAAT2R (Table 1).
Results
Analysis of the EAAT2 promoter using SSCP
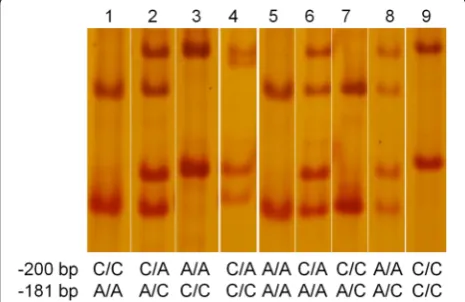
A SNP was detected in theEAAT2promoter at -181bp by SSCP [11]. Since we were interested in this promoter re-gion and already had considerable expertise in this method [8], we used SSCP for our initial experiments. Although it is not possible to predict the three-dimensional structure from the primary sequence of the ssDNA [19], it is ex-pected that the wild-type (WT/WT), mutant (MT/MT) and heterozygote (WT/MT) would have a unique elec-trophoretic mobility. Indeed, our SSCP result showed the expected three distinct patterns (Figure 2, Lanes 1-3). However, one sample (Figure 2, Lane 4) showed some unexpected extra bands. Sanger sequencing of samples scored based on their migration pattern as wild type (n = 4, Lane 1), heterozygotes (n = 2, Lane 2), homozy-gote mutants (n = 2, Lane 3) and the sample with an unusual DNA migration (n = 1, Lane 4) revealed a pre-viously unpublished polymorphism C to A transition at -200bp (g.-200C > A), 19 bp upstream from the A to C transition observed at -181 bp (g.-181A > C; [11]).
Sanger sequencing also revealed that the following additional genotypes exist (sequence is given in -200 bp and -181bp order): A/A and A/A (Figure 2, Line 5); C/A and A/A (Figure 2, Line 6); C/C and A/C (Figure 2, Lane 7); A/A and A/C (Figure 2; Line 8); C/C and C/C (Figure 2, Line 9). These variants did not migrate differ-ently compared to the three main types (Figure 2, Lines 1-3), even when the SSCP running conditions were further optimised suggesting that this technique is un-suitable for the detection of all nine possible EAAT2 variants (Figure 2).
Optimization of pyrosequencing to detect all EAAT2 variants
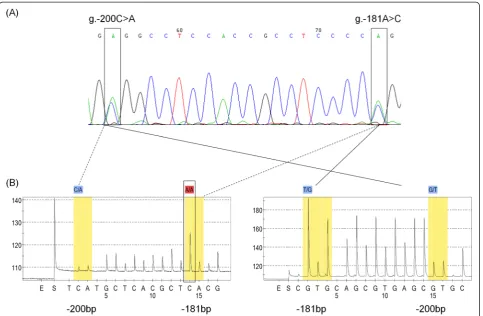
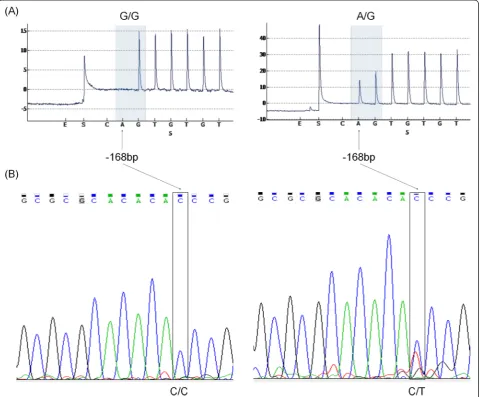
The SSCP revealed that it was essential to get sequen-cing data for all samples for accurate genotyping. Thus, we used pyrosequencing, which is suitable for the amplifi-cation of this short region and provides exact sequence data for a large number of samples. Pyrosequencing was optimised and evaluated using genomic DNA prepared from blood from healthy adult volunteers. The initial assay was designed to use the forward strand but this approach was unsuccessful and the reading failed at the SNP g.-181A > C (Figure 1, Figure 3A and B left panel). Therefore, pyrosequencing was carried out on the reverse strand which generated clear pyrograms (Figure 3B right panel, Figure 4). Note that the se-quence is given in reverse orientation.
Polymorphism analysis of the EAAT2 promoter using pyrosequencing
Successful amplification was obtained in 209 samples (87.5% success rate). Failure of the remaining samples was likely due to low quality genomic DNA. Some of the samples were 22 years old and showed DNA degradation [29]. Overall in 89% of the samples the polymorphisms g.-200C > A;-181A > C were inherited together (Table 2). While the SSCP data indicates that the genotype distri-bution of these SNPs is in Hardy Weinberg Equilibrium (HW), the pyrosequencing results suggest the opposite (Table 3). Measures of LD (D’and r2), the non-random association between alleles of different loci, are consist-ent with the SNPs being linked (Table 3). The analysis and interpretation of LD is difficult due to the lack of HW and the presence of only one mutation at the -168 loci. Haplotype predictions are also shown in Table 4. A 100% concordance was observed when compared with Sanger sequencing (n = 51 samples were sequenced with both methods).
Comparison of sample genotyping using pyrosequencing and SSCP
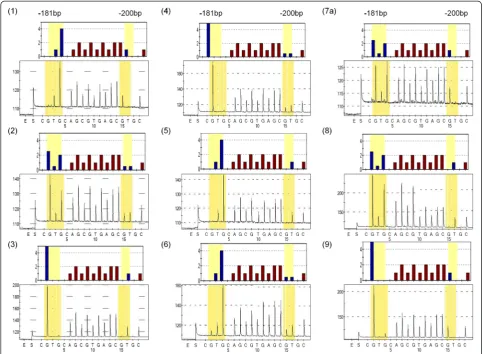
[image:4.595.57.290.524.675.2]All nine sequence combinations have been success-fully amplified and pyrosequenced (Figure 4; Note Figure 2SSCP patterns of theEAAT2promoter genotypes.
that genotypes six and nine were only found in the adult control samples hence they are not presented in Tables 2, 5 and 6). 239 samples from newborn infants were initially used and 209 could be classified for SSCP and pyrosequencing. Because different samples failed to produce clear PCR products for SSCP and pyrosequenc-ing, a total of 183 samples generated result with both genotyping methods. With SSCP a total of 29 samples (16%) were incorrectly genotyped (Table 5). While 51 samples were classified as homozygote wild type using SSCP, pyrosequencing revealed that 25% of these sam-ples do not belong to this group (Table 5). There was surprisingly little error in the identification of the het-erozygotes with SSCP and 96% of the samples were correctly genotyped. In contrast, 12 homozygote mu-tants (31%) were incorrectly identified (Table 5). We also genotyped a small number of samples (n = 15) that failed to produce a clear PCR product with the EAAT2F and EAAT2R primers (hence could not be used for SSCP, Figure 1) but resulted in clear pyrograms with the EAAT2PyroSeq1 primer. A second SSCP was carried out with EAAT2F and EAAT2PyroR primers (Table 6) and found that with these primers similar
proportion (20%versus16%) of samples were misclassi-fied as with the EAAT2F and EAAT2R primers.
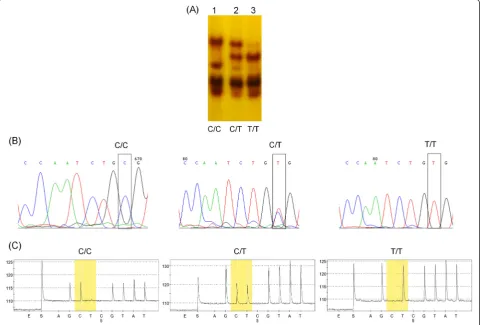
To compare the concordance between SSCP and pyrosequencing for a single SNP, SNP rs1835740 was analysed in the same 239 samples. Three distinct SSCP patterns were observed for the different genotypes (Figure 5A) which were confirmed by a random Sanger sequencing (Figure 5B) and pyrosequencing (Figure 5C) of the whole cohort. The concordance rate between SSCP and pyrosequencing was 94% for this SNP.
[image:5.595.58.542.88.404.2]one sample was a heterozygote (C/T) for this SNP. The MAF was 0.0023 in our cohort.
Discussion
Identification of additional SNPs in the EAAT2 promoter
We identified a polymorphism at -200bp in the EEAT2 promoter, 19bp upstream of the previously reported and characterised polymorphism at -181bp (rs4354668:A > C or g.-181A > C) [11]. Our data indicates that these SNPs are in LD (Table 3). While our study was close to completion, the g.-200C > A was added to the NCBI SNP Database (1000 Genome Project, Human Build 137; rs111885243:C > A) confirming our sequencing and pyrose-quencing data. The MAF in our predominantly Caucasian cohort for g.-200C > A and g.-181A > C is 0.46 and 0.49, respectively. The Global MAF available from the SNP Database are 0.39 and 0.41, respectively. More recently another SNP in theEAAT2promoter at position -168bp was added to the NCBI SNP Database (Human Build
137; rs116392274:C > T). In the 51 samples that we sequenced only the C allele was present. Furthermore, in the entire cohort (n = 214) only one T allele was found in a heterozygous form (Table 2). To date, these newly identified SNPs (g.-200C > A and g.-168C > T) have not been investigated in association studies or cited in the literature.
SSCP is not sensitive enough to reliably distinguish between the various EAAT2 promoter genotypes
[image:6.595.56.540.89.443.2]SSCP was used initially in this study because this method has previously been applied to genotype exactly the same region of the EAAT2 promoter [11]. We used the same primers and PCR conditions as reported [11] but modified the SSCP running conditions that provided better separation of the DNA strands. Previously, ap-proximately 2 h at a high voltage was used to resolve the amplicons. In contrast, in the current study the PCR products were resolved for 14 h at a relatively low Figure 4Predicted (top panels) and observed (bottom panels) pyrograms forEAAT2promoter SNPs.The position of the SNPs is
voltage (150V) at a constant temperature (20°C). This allowed better separation and visualization of the ssDNA bands and lead to the identification of an add-itional genotype (Figure 2, Lane 4). Sequencing of sev-eral samples lead to the identification of g.-200C > A, which was not reported in a previous study of this region [11]. Our SSCP, pyrosequencing and Sanger sequencing highlighted that although four clear migration patterns can be seen (Figure 2, Lanes 1-4) several of the other variants (Figure 2, genotypes 5-9,) could not be identi-fied by SSCP. Note that the reproducibility of SSCP was 100% for the samples that were used as controls (one
sample from each of the three main genotypes were always run on each gel, in total n = 45 samples).
Studies using SSCP showed that the position of the substitution within a codon and the nucleotide itself can determine whether a SNP is detected [31]. A G to A or G to T nucleotide change at the second position of a codon caused a shift in ssDNA migration while failed to do so if it occurred in the first position [31]. In our case the SNP at -181bp is located on the second base, while the SNP at -200bp is on the first base of a codon. Fur-thermore, some nucleotide changes are detected at lower rates than others. For example, A to C transver-sions were detected at a higher rate (95%) compared to C to A transversions (82%) [31]. The SNP at -200bp is a C to A whilst the SNP at -181bp is an A to C transver-sion. It is also documented that some point mutations are not detected because of the nucleotide composition (e.g. A + T or G + C richness) of a DNA region being analysed [32]. Indeed, the EAAT2 promoter is highly GC-rich (Figure 1). The amplicon used in both the pre-vious study [11] and this study for SSCP analysis has a GC content of ~73%. Furthermore, some mutations may cause relatively small changes in electrophoretic mobility [33] and might remain undetected by SSCP [34-36]. These factors could explain that the SSCP pat-terns for theEAAT2promoter resemble that of a single SNP instead of multiple SNPs. However, the banding pattern does not fully correspond to the genotype of the SNP at -181bp. While genotypes 5 and 8 followed the -181bp SNP migration pattern, genotypes 6 and 7 resembled the migration of the -200bp SNP.
Based on the SSCP analysis, 25-31% of the WT/WT and MT/MT samples were mis-classified (Table 5 and 6). The previous study of the EAAT2 promoter region [11] identified only three SSCP patterns in their cohort. How-ever, considering the MAF of g.-200C > A and g.-181A > C in the population (0.46 and 0.49 in the current predomin-antly Caucasian cohort; 0.39 and 0.41 in the SNP Data-base), it is expected that some of the additional variants described here, should have been identified in the previous study (Table 4). Indeed, a similar allele frequency and LD levels are expected in Caucasian cohorts [37]. Furthermore, numerous subsequent studies [27,28,38,39] understandably continued with only investigating the association of this single SNP (rs4354668:A > C or g.-181A > C) with various diseases.
[image:7.595.58.291.101.303.2]Many studies across different fields still use SSCP ex-tensively as a genotyping method and about 1040 studies are listed on PubMed that used SSCP since 2010 to date. It is a simple, user-friendly, low cost method of SNP de-tection which does not require specialist equipment and can be adapted to a high-throughput format. It can work very effectively when a single SNP is investigated as we have demonstrated for an unrelated single SNP,
Table 3 Hardy Weinberg equilibrium and LD variance for the threeEAAT2SNPs using pyrosequencing or SSCP
Pyrosequencing SSCP Hardy-Weinberg
for -168 p > 0.99 N/A
for -181 p = 0.0188 p = 0.4063
for -200 p = 0.0256 p = 0.3325
Lewontin’s D’
−168 and -181 0.49 N/A
−168 and -200 1 N/A
−181 and -200 0.94 1
r2
−168 and -181 0 N/A
−168 and -200 0 N/A
−181 and -200 0.79 0.99
Lewontin’s D’and r2
[image:7.595.55.290.527.708.2]both give ordinal measures of Linkage Disequilibrium (LD). Please note only one mutation was found at -168 making interpretation difficult for these associations.
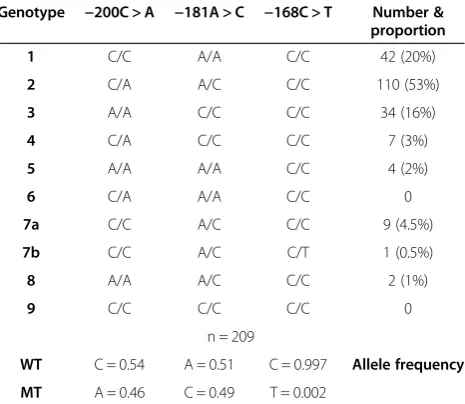
Table 2 Distribution of genotypes in the sample cohort
Genotype −200C > A −181A > C −168C > T Number & proportion
1 C/C A/A C/C 42 (20%)
2 C/A A/C C/C 110 (53%)
3 A/A C/C C/C 34 (16%)
4 C/A C/C C/C 7 (3%)
5 A/A A/A C/C 4 (2%)
6 C/A A/A C/C 0
7a C/C A/C C/C 9 (4.5%)
7b C/C A/C C/T 1 (0.5%)
8 A/A A/C C/C 2 (1%)
9 C/C C/C C/C 0
n = 209
WT C = 0.54 A = 0.51 C = 0.997 Allele frequency MT A = 0.46 C = 0.49 T = 0.002
rs1835740:C > T (Figure 5). However, our results also highlight that SSCP cannot always be used effectively when several SNPs are located in the target sequence. Although it is well recognised that a representative sam-ple with distinct SSCP pattern needs to be sequenced to validate the method, it is also crucial that the entire sequence of the PCR product used for SSCP is scruti-nised carefully. Generation of shorter PCR products for SSCP can sometimes help to uncover previously unnoticed variants [36,40]. If SSCP is used for genotyp-ing (not for mutational screengenotyp-ing) and all SNPs in the regions are known, covering some of them with primers may eliminate them from the SSCP pattern making the analysis of the remainders easier. The PCR products for theEAAT2promoter are already short, generating even shorter targets thus would not solve the problem seen with this particular target sequence but might offer solution for other troublesome targets.
Pyrosequencing as an alternative to detect closely positioned SNPs
In our study g.-200C > A;-181A > C could simultaneously be analysed by pyrosequencing (Figures 3, 4 and Table 2). The detection limit of this method is dependent on how well the dispensation profile can be set up. This in turn depends on the nucleotide change within the SNP and
[image:8.595.56.547.100.252.2]the nucleotides adjacent to the SNP(s) [41]. Indeed, the latter caused problems in the genotyping of g.-181A > C using a primer in 5′-3′orientation (Figure 3B, left panel). A four C mononucleotide repeat precedes this SNP and the non-linear light generation of the mononucleotide repeat made it impossible for the software to interpret the correct number of incorporated identical nucleo-tides [42,43] and as a consequence the assay failed at the g.-181A > C SNP (in 100% of the 96 samples ana-lysed). This problem was overcome by re-designing the assay on the reverse strand and sequencing the nucleotide change prior to the C mononucleotide repeats (Figure 3B, right panel). Similarly, g.-168C > T was also sequenced on the reverse strand (Figure 1). Both pyrosequencing assays generated sequences immediately downstream of the primer (Figure 1, 3 and 6), which cannot be achieved with Sanger sequencing that lays a reading gap of 20-30 bp from the sequencing primer [44]. Pyrosequencing can only analyse a few positions simultaneously [41], which was the main reason for developing two separate assays to detect g.-200C > A;-181A > C and g.-168C > T (Figure 1). This approach resulted in clear and distinguishable pyro-grams for each genotype for each assay. g.-168C > T was found in a heterozygote form in one infant with no clinical evidence of white matter injury (Rajatileka et al. unpub-lished observation). The MAF of the g.-168C > T (0.0023
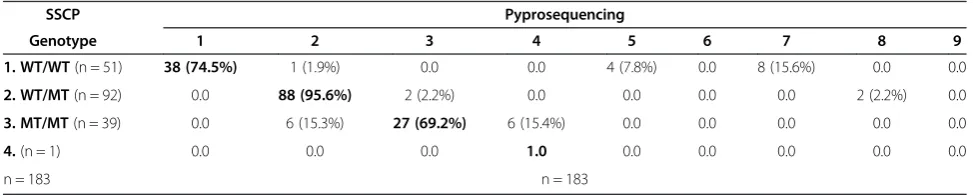
Table 5 Comparison of genotypes identified by SSCP and pyrosequencing
SSCP Pyprosequencing
Genotype 1 2 3 4 5 6 7 8 9
1. WT/WT(n = 51) 38 (74.5%) 1 (1.9%) 0.0 0.0 4 (7.8%) 0.0 8 (15.6%) 0.0 0.0
2. WT/MT(n = 92) 0.0 88 (95.6%) 2 (2.2%) 0.0 0.0 0.0 0.0 2 (2.2%) 0.0
3. MT/MT(n = 39) 0.0 6 (15.3%) 27 (69.2%) 6 (15.4%) 0.0 0.0 0.0 0.0 0.0
4.(n = 1) 0.0 0.0 0.0 1.0 0.0 0.0 0.0 0.0 0.0
n = 183 n = 183
[image:8.595.55.542.619.717.2]For the SSCP EAAT2F and EAAT2R primers were used and pyrosequencing was done with EAAT2PyroSeq1 primer (Figure1and Table1). The genotypes that were correctly identified by both methods are indicated in bold. The genotype numbers indicated under pyrosequencing corresponds to those used in Table2.
Table 4 Predicted haplotype frequencies in the cohort using pyrosequencing or SSCP
Pyrosequencing
SNP Haplotype C allele Total alleles
−168 C > T T T T T C C C C 417 418
−181 A > C A A C C A A C C 204 418
−200 C > A A C A C A C A C 225 418
% 0.0 0.0 0.0 0.2 1.5 49.8 44.6 3.9
SSCP
SNP Haplotype C allele Total alleles
−181 A > C A A C C 208 414
−200 C > A A C A C 205 414
% 0.2 49.5 50.2 0.0
in our study and 0.017 on the SNP Database) is very low in the general population which makes it challenging to assess in association studies. SNP-SNP interactions have been suggested to have a great impact on unveiling the underlying mechanism of complex diseases [45]. Thus, future clinical investigations of the impact of g.-200C > A;-181A > C on the promoter function of EAAT2 and their association with various diseases will need to be assessed simultaneously.
Currently, the detection of g.-200C > A;-181A > C cost £1.79 and £1.43 by pyrosequencing and SSCP, respectively.
[image:9.595.55.545.99.182.2]For pyrosequencing the cost includes all reagents and a charge for the use of the pyrosequencer. For SSCP the cost was calculated from the reagents and Sanger sequencing of 10% of the samples. Following PCR amplification, the pyrosequencing required 1 h prepar-ation time and 21 min run time for the two SNPs for 96 samples. For a single SNP (such as rs1835740:C > T) the run time is usually ~10 min for 96 samples. In con-trast, SSCP analysis of 100 samples requires 2-3 h post-PCR preparation time, 12-16 h gel electrophoresis and 0.45-1.5 h silver staining. In addition, at least 10%
[image:9.595.58.539.372.697.2]Figure 5Detection of an unrelated SNP, rs1835740, by SSCP, Sanger sequencing and pyrosequencing. (A)Genotype of each sample determined by Sanger sequencing is shown at the bottom of each lane.(B)SNP is indicated in rectangles on the Sanger sequence.(C)The position of the SNP on the pyrogram is highlighted in yellow boxes.
Table 6 Comparison of genotypes identified by SSCP and pyrosequencing
SSCP PYROSEQUENCING
Genotype 1 2 3 4 5 6 7 8 9
1. WT/WT(n = 3) 2 (66.7%) 0.0 0.0 0.0 0.0 0.0 1 (33.3%) 0.0 0.0
2. WT/MT(n = 11) 0.0 9 (81.8%) 1 (9.1%) 0.0 0.0 0.0 1 (9.1%) 0.0 0.0
3. MT/MT(n = 1) 0.0 0.0 1 (100%) 0.0 0.0 0.0 0.0 0.0 0.0
n = 15 n = 15
of the samples need to be prepared for Sanger sequen-cing. Whilst pyrosequencing provides a less labour intensive, low cost and high throughput platform to genotype samples, in laboratories with no access to this facility SSCP may be used reliably for genotyping if(i) all mutations in the region are known, (ii) the SSCP genotype readout is validated by another method, and (iii)in case of two SNPs in the region the indica-tive bands for both mutations are clearly and easily distinguishable.
Conclusion
Our data suggest that SSCP cannot always detect reliably several closely located SNPs. Furthermore, caution is needed in the interpretation of the association studies linking only one of the co-inherited SNPs in the EAAT2 promoter to human diseases.
Competing interest
The authors declare that they have no competing interests.
Authors’contributions
SR designed and carried out all experimental work and data analysis. DO carried out the statistical analysis. KL and DH arranged access to the adult and newborn clinical samples, and contributed to clinical study design. KL obtained research ethics, NHS R&D permissions, University of Bristol research sponsorship for use of human tissue and consenting processes. MW assisted with the pyrosequencing analysis. EM and AV advised on experimental design. SR and AV wrote the manuscript and all authors reviewed the manuscript prior to submission. All authors read and approved the final manuscript.
Acknowledgements
[image:10.595.59.540.90.487.2]Author details 1
Centre for Research in Biosciences, Department of Biological, Biomedical and Analytical Sciences, Faculty of Health and Applied Sciences, University of the West of England, Bristol BS16 1QY, UK.2Neonatal Neuroscience, School of Clinical Sciences, University of Bristol, St Michael’s Hospital, Southwell Street, Bristol BS2 8EG, UK.3Bristol Genetics Laboratory, Pathology Sciences, Blood Sciences and Bristol Genetics, Southmead Hospital, Bristol BS10 5NB, UK.4Regional Neonatal Intensive Care Unit, St Michael’s Hospital, University Hospitals NHS Trust, Bristol BS2 8EG, UK.5Neonatal Intensive Care Unit, Southmead Hospital, North Bristol NHS Trust, Bristol BS10 5NB, UK.6School of Physiology and Pharmacology University of Bristol, Medical Sciences Building, University Walk, Bristol BS8 1TD, UK.
Received: 20 January 2014 Accepted: 2 July 2014 Published: 5 July 2014
References
1. Landegren U, Nilsson M, Kwok PY:Reading bits of genetic information: methods for single-nucleotide polymorphism analysis.Genome Res1998,
8:769–776.
2. Wang DG, Fan JB, Siao CJ, Berno A, Young P, Sapolsky R, Ghandour G, Perkins N, Winchester E, Spencer J, Kruglyak L, Stein L, Hsie L, Topaloglou T, Hubbell E, Robinson E, Mittmann M, Morris MS, Shen N, Kilburn D, Rioux J, Nusbaum C, Rozen S, Hudson TJ, Lipshutz R, Chee M, Lander ES:Large-scale identification, mapping, and genotyping of single-nucleotide polymorphisms in the human genome.Science1998,280:1077–1082. 3. Marzinotto S, Sessa F, Franzoni A, Anselmi A, Gastaldo LR, Mason S,
Damante G, Beltrami CA, Mariuzzi L:KRAS codons 12 and 13 mutation analysis: a comparative study between direct sequencing and a new sensitive real-time PCR assay.Sequencing2011,2011:895709. 4. Angulo B, Conde E, Suárez-Gauthier A, Plaza C, Martínez R, Redondo P,
Izquierdo E, Rubio-Viqueira B, Paz-Ares L, Hidalgo M, López-Ríos F:
A comparison ofEGFRmutation testing methods in lung carcinoma: direct sequencing. Real-time PCR and immunohistochemistry.PLoS ONE
2012,7:e43842.
5. Kircher M, Kelso J:High-throughput DNA sequencing concepts and limitations.Bioessays2010,32:524–536.
6. Morozova O, Marra MA:Applications of next-generation sequencing technologies in functional genomics.Genomics2008,92:255–264. 7. Orita M, Iwahana H, Kanazawa H, Hayashi K, Sekiya T:Detection of
polymorphisms of human DNA by gel electrophoresis as single-strand conformation polymorphisms.Proc Natl Acad Sci U S A1989,86:2766–2770. 8. Varadi A, Lebel L, Hashim Y, Mehta Z, Ashcroft SJ, Turner R:Sequence
variants of the sarco(endo)plasmic reticulum Ca(2+)-transport ATPase 3 gene (SERCA3) in Caucasian type II diabetic patients (UK Prospective Diabetes Study 48).Diabetologia1999,42:1240–1243.
9. Bettinaglio P, Galbusera A, Caprioli J, Orisio S, Perna A, Arnoldi F, Bucchioni S, Noris M:Single strand conformation polymorphism (SSCP) as a quick and reliable method to genotype M235T polymorphism of angiotensinogen gene.Clin Biochem2002,35:363–368.
10. Daly AK, King BP, Leathart JB:Genotyping for cytochrome P450 polymorphisms.Methods Mol Biol2006,320:193–207.
11. Mallolas J, Hurtado O, Castellanos M, Blanco M, Sobrino T, Serena J, Vivancos J, Castillo J, Lizasoain I, Moro MA, Dávalos A:A polymorphism in theEAAT2promoter is associated with higher glutamate concentrations and higher frequency of progressing stroke.J Exp Med2006,203:711–717. 12. Abbasi S, Rasouli M, Nouri M, Kalbasi S:Association of estrogen receptor-α A908G (K303R) mutation with breast cancer risk.Int J Clin Exp Med2013,
6:39–49.
13. Hu F, Li D, Wang Y, Yao X, Zhang W, Liang J, Lin C, Ren J, Zhu L, Wu Z, Li S, Li Y, Zhao X, Cui B, Dong X, Tian S, Zhao Y:Novel DNA variants and mutation frequencies of hMLH1 and hMSH2 genes in colorectal cancer in the Northeast China population.PLoS ONE2013,8:e60233.
14. Janke T, Schwaiger K, Ege M, Fahn C, von Mutius E, Bauer J, Mayer M:
Analysis of the fungal flora in environmental dust samples by PCR-SSCP.
Meth Curr Microbiol2013,67:156–169.
15. Legrand S, Marque G, Blassiau C, Bluteau A, Canoy AS, Fontaine V, Jaminon O, Bahrman N, Mautord J, Morin J, Petit A, Baranger A, Rivière N, Wilmer J, Delbreil B, Lejeune-Hénaut I:Combining gene expression and genetic analyses to identify candidate genes involved in cold responses in pea.
J Plant Physiol2013,170:1148–1157.
16. Choy YS, Dabora SL, Hall F, Ramesh V, Niida Y, Franz D, Kasprzyk-Obara J, Reeve MP, Kwiatkowski DJ:Superiority of denaturing high performance liquid chromatography over single-stranded conformation and conformation-sensitive gel electrophoresis for mutation detection in TSC2.Ann Hum Genet1999,63:383–391.
17. Gross E, Arnold N, Goette J, Schwarz-Boeger U, Kiechle M:A comparison of BRCA1 mutation analysis by direct sequencing, SSCP and DHPLC.Hum Genet1999,105:72–78.
18. Dobson-Stone C, Cox RD, Lonie L, Southam L, Fraser M, Wise C, Bernier F, Hodgson S, Porter DE, Simpson AH, Monaco AP:Comparison of fluorescent single-strand conformation polymorphism analysis and denaturing high-performance liquid chromatography for detection of EXT1 and EXT2 mutations in hereditary multiple exostoses.Eur J Hum Genet2000,8:24–32.
19. Kakavas VK, Plageras P, Vlachos TA, Papaioannou A, Noulas VA:PCR-SSCP: a method for the molecular analysis of genetic diseases.Mol Biotechnol
2008,38:155–163.
20. Ronaghi M, Uhlén M, Nyrén P:A sequencing method based on real-time pyrophosphate.Science1998,281:363–365.
21. Ahmadian A, Lundeberg J, Nyrén P, Uhlén M, Ronaghi M:Analysis of the p53 tumor suppressor gene by pyrosequencing.Biotechniques2000,
28:140–144. 146-147.
22. Alderborn A, Kristofferson A, Hammerling U:Determination of single-nucleotide polymorphisms by real-time pyrophosphate DNA sequencing.Genome Res2000,10:1249–1258.
23. Nordström T, Ronaghi M, Forsberg L, de Faire U, Morgenstern R, Nyrén P:
Direct analysis of single-nucleotide polymorphism on double-stranded DNA by pyrosequencing.Biotechnol Appl Biochem2000,31:107–112. 24. Ronaghi M, Elahi E:Pyrosequencing for microbial typing.J Chromatogr B
Analyt Technol Biomed Life Sci2002,782:67–72.
25. Doostzadeh J, Shokralla S, Absalan F, Jalili R, Mohandessi S, Langston JW, Davis RW, Ronaghi M, Gharizadeh B:High throughput automated allele frequency estimation by pyrosequencing.PLoS ONE2008,3:e2693. 26. Akca H, Demiray A, Yaren A, Bir F, Koseler A, Iwakawa R, Bagci G, Yokota J:
Utility of serum DNA and pyrosequencing for the detection of EGFR mutations in non-small cell lung cancer.Cancer Genet2013,206:73–80. 27. Pampliega O, Domercq M, Villoslada P, Sepulcre J, Rodríguez-Antigüedad A,
Matute C:Association of anEAAT2polymorphism with higher glutamate concentration in relapsing multiple sclerosis.J Neuroimmunol2008,
195:194–198.
28. Shin HE, Han SJ, Lee KS, Park JW:Polymorphism of the glutamate transporter proteinEAAT2and migraine transformation into chronic daily headache.J Clin Neurol2011,7:143–147.
29. Rajatileka S, Luyt K, El-Bokle M, Williams M, Kemp H, Molnár E, Váradi A:
Isolation of human genomic DNA for genetic analysis from premature neonates: a comparison between newborn dried blood spots, whole blood and umbilical cord tissue.BMC Genet2013,14:105.
30. Sherry ST, Ward MH, Kholodov M, Baker J, Phan L, Smigielski EM, Sirotkin K:
dbSNP: the NCBI database of genetic variation.Nucleic Acids Res2001,
29:308–311.
31. Sheffield VC, Beck JS, Kwitek AE, Sandstrom DW, Stone EM:The sensitivity of single-strand conformation polymorphism analysis for the detection of single base substitutions.Genomics1993,16:325–332.
32. Gasser RB, Hu M, Chilton NB, Campbell BE, Jex AJ, Otranto D, Cafarchia C, Beveridge I, Zhu X:Single-strand conformation polymorphism (SSCP) for the analysis of genetic variation.Nat Protoc2006,1:3121–3128. 33. Cooper PC, Rezende SM:An overview of methods for detection of factor
V Leiden and the prothrombin G20210A mutations.Int J Lab Hematol
2007,29:153–162.
34. Shikanai T, Silverman ES, Morse BW, Lilly CM, Inoue H, Drazen JM:
Sequence variants in the FcepsilonRI alpha chain gene.J Appl Physiol
2002,93:37–41.
35. Hasegawa M, Nishiyama C, Nishiyama M, Akizawa Y, Mitsuishi K, Ito T, Kawada H, Furukawa S, Ra C, Okumura K, Ogawa H:A novel -66T/C polymorphism in Fc epsilon RI alpha-chain promoter affecting the transcription activity: possible relationship to allergic diseases.J Immunol
2003,171:1927–1933.
36. Potaczek DP, Sanak M, Mastalerz L, Setkowicz M, Kaczor M, Nizankowska E, Szczeklik A:The alpha-chain of high-affinity receptor for IgE
(FcepsilonRIalpha) gene polymorphisms and serum IgE levels.
37. Shifman S, Kuypers J, Kokoris M, Yakir B, Darvasi A:Linkage disequilibrium patterns of the human genome across populations.Hum Mol Genet2003,
12:771–776.
38. Dallaspezia S, Poletti S, Lorenzi C, Pirovano A, Colombo C, Benedetti F:
Influence of an interaction between lithium salts and a functional polymorphism in SLC1A2 on the history of illness in bipolar disorder.
Mol Diagn Ther2012,16:303–309.
39. Spangaro M, Bosia M, Zanoletti A, Bechi M, Cocchi F, Pirovano A, Lorenzi C, Bramanti P, Benedetti F, Smeraldi E, Cavallaro R:Cognitive dysfunction and glutamate reuptake: effect ofEAAT2polymorphism in schizophrenia.
Neurosci Lett2012,522:151–155.
40. Natkaniec M, Potaczek DP, Sanak M:Single-stranded conformation polymorphism (SSCP)-driven indirect sequencing in detection of short deletion.Mol Biol Rep2009,36:1545–1547.
41. Sivertsson A, Platz A, Hansson J, Lundegerg J:Pyrosequencing as an alternative to single-strand conformation polymorphism analysis for detection of N-ras mutations in human melanoma metastases.Clin Chem
2002,48:2164–2170.
42. Unemo M, Olcén P, Jonasson J, Fredlund H:Molecular typing of Neisseria gonorrhoeae isolates by pyrosequencing of highly polymorphic segments of the porB gene.J Clin Microbiol2004,42:2926–2934.
43. Schentrup AM, Allayee H, Lima JJ, Johnson JA, Langaee TY:Genotyping the GGGCGG tandem repeat promoter polymorphism in the 5-lipoxygenase enzyme gene (ALOX5) by pyrosequencing assay.Genet Test Mol Biomarkers2009,13:361–365.
44. Fakruddin, Chowdhury A:Pyrosequencing an alternative to traditional Sanger sequencing.Am J Biochem Biotechnol2012,8:14–20.
45. Dinu I, Mahasirimongkol S, Liu Q, Yanai H, Sharaf Eldin N, Kreiter E, Wu X, Jabbari S, Tokunaga K, Yasui Y:SNP-SNP interactions discovered by logic regression explain Crohn’s disease genetics.PLoS ONE2012,7:e43035.
doi:10.1186/1471-2156-15-80
Cite this article as:Rajatilekaet al.:Detection of three closely located single nucleotide polymorphisms in the EAAT2 promoter: comparison of single-strand conformational polymorphism (SSCP), pyrosequencing and Sanger sequencing.BMC Genetics201415:80.
Submit your next manuscript to BioMed Central and take full advantage of:
• Convenient online submission
• Thorough peer review
• No space constraints or color figure charges
• Immediate publication on acceptance
• Inclusion in PubMed, CAS, Scopus and Google Scholar
• Research which is freely available for redistribution