Open Access
Research article
The molecular portraits of breast tumors are conserved across
microarray platforms
Zhiyuan Hu
1,2, Cheng Fan
1, Daniel S Oh
1,2, JS Marron
3, Xiaping He
1,2,
Bahjat F Qaqish
4, Chad Livasy
5, Lisa A Carey
6, Evangeline Reynolds
6,
Lynn Dressler
6, Andrew Nobel
3, Joel Parker
7, Matthew G Ewend
6,
Lynda R Sawyer
6, Junyuan Wu
1, Yudong Liu
1, Rita Nanda
8,
Maria Tretiakova
8, Alejandra Ruiz Orrico
9, Donna Dreher
9, Juan P Palazzo
9,
Laurent Perreard
10, Edward Nelson
11, Mary Mone
11, Heidi Hansen
11,
Michael Mullins
12, John F Quackenbush
12, Matthew J Ellis
13,
Olufunmilayo I Olopade
8, Philip S Bernard
12and Charles M Perou*
1,2,5 Address: 1Lineberger Comprehensive Cancer Center, University of North Carolina, Chapel Hill, NC 27599, USA, 2Department of Genetics,University of North Carolina, Chapel Hill, NC 27599, USA, 3Department of Statistics and Operations Research, University of North Carolina,
Chapel Hill, NC 27599, USA, 4Department of Biostatistics, University of North Carolina, Chapel Hill, NC 27599, USA, 5Department of Pathology
and Laboratory Medicine, University of North Carolina, Chapel Hill, NC 27599, USA, 6Department of Medicine, University of North Carolina,
Chapel Hill, NC 27599, USA, 7Constella Health Sciences, 2605 Meridian Parkway, Durham, NC 27713, USA, 8Section of Hematology/Oncology,
Department of Medicine, Committees on Genetics and Cancer Biology, University of Chicago, 5841 South Maryland Avenue, Chicago, IL 60637-1463, USA, 9Department of Pathology, Thomas Jefferson University, 132 South 10th Street Philadelphia, PA 19107, USA, 10The ARUP Institute
for Clinical and Experimental Pathology, 500 Chipeta Way, Salt Lake City, Utah 84108, USA, 11Department of Surgery, University of Utah School
of Medicine, 30 N 1900 E, Salt Lake City, Utah 84132, USA, 12Department of Pathology, University of Utah School of Medicine, 30 N 1900 E, Salt
Lake City, Utah 84132, USA and 13Department of Medicine, Division of Oncology, Washington University School of Medicine and Siteman Cancer
Center, St Louis, Missouri, USA
Email: Zhiyuan Hu - [email protected]; Cheng Fan - [email protected]; Daniel S Oh - [email protected]; JS Marron - [email protected]; Xiaping He - [email protected]; Bahjat F Qaqish - [email protected];
Chad Livasy - [email protected]; Lisa A Carey - [email protected]; Evangeline Reynolds - [email protected]; Lynn Dressler - [email protected]; Andrew Nobel - [email protected]; Joel Parker - [email protected];
Matthew G Ewend - [email protected]; Lynda R Sawyer - [email protected]; Junyuan Wu - [email protected]; Yudong Liu - [email protected]; Rita Nanda - [email protected];
Maria Tretiakova - [email protected]; Alejandra Ruiz Orrico - [email protected];
Donna Dreher - [email protected]; Juan P Palazzo - [email protected]; Laurent Perreard - [email protected]; Edward Nelson - [email protected]; Mary Mone - [email protected]; Heidi Hansen - [email protected]; Michael Mullins - [email protected]; John F Quackenbush - [email protected]; Matthew J Ellis - [email protected]; Olufunmilayo I Olopade - [email protected]; Philip S Bernard - [email protected];
Charles M Perou* - [email protected] * Corresponding author
Abstract
Background: Validation of a novel gene expression signature in independent data sets is a critical
step in the development of a clinically useful test for cancer patient risk-stratification. However, validation is often unconvincing because the size of the test set is typically small. To overcome this problem we used publicly available breast cancer gene expression data sets and a novel approach Published: 27 April 2006
BMC Genomics2006, 7:96 doi:10.1186/1471-2164-7-96
Received: 15 February 2006 Accepted: 27 April 2006 This article is available from: http://www.biomedcentral.com/1471-2164/7/96
© 2006Hu et al; licensee BioMed Central Ltd.
This is an Open Access article distributed under the terms of the Creative Commons Attribution License (http://creativecommons.org/licenses/by/2.0), which permits unrestricted use, distribution, and reproduction in any medium, provided the original work is properly cited.
to data fusion, in order to validate a new breast tumor intrinsic list.
Results: A 105-tumor training set containing 26 sample pairs was used to derive a new breast
tumor intrinsic gene list. This intrinsic list contained 1300 genes and a proliferation signature that was not present in previous breast intrinsic gene sets. We tested this list as a survival predictor on a data set of 311 tumors compiled from three independent microarray studies that were fused into a single data set using Distance Weighted Discrimination. When the new intrinsic gene set was used to hierarchically cluster this combined test set, tumors were grouped into LumA, LumB, Basal-like, HER2+/ER-, and Normal Breast-like tumor subtypes that we demonstrated in previous datasets. These subtypes were associated with significant differences in Relapse-Free and Overall Survival. Multivariate Cox analysis of the combined test set showed that the intrinsic subtype classifications added significant prognostic information that was independent of standard clinical predictors. From the combined test set, we developed an objective and unchanging classifier based upon five intrinsic subtype mean expression profiles (i.e. centroids), which is designed for single sample predictions (SSP). The SSP approach was applied to two additional independent data sets and consistently predicted survival in both systemically treated and untreated patient groups.
Conclusion: This study validates the "breast tumor intrinsic" subtype classification as an objective
means of tumor classification that should be translated into a clinical assay for further retrospective and prospective validation. In addition, our method of combining existing data sets can be used to robustly validate the potential clinical value of any new gene expression profile.
Background
The classification of human tumors using microarray data has been an area of intense research, but it remains a daunting task to validate a new profile and generate a clin-ically useful test. Many different gene expression-based predictors have been developed for breast cancer [1-9], and two different gene expression predictors have reached the final step of prospective clinical trial testing [10,11]. Using cDNA microarrays, we previously identified five distinct subtypes of breast tumors arising from at least two distinct cell types (basal-like and luminal epithelial cells) [1-3]. This molecular taxonomy was based upon an "intrinsic" gene set, which was identified using a super-vised analysis to select genes that showed little variance within repeated samplings of the same tumor, but which showed high variance across tumors [1]. We showed that an intrinsic gene set reflects the stable biological proper-ties of tumors and typically identifies distinct tumor sub-types that have prognostic significance, even though no knowledge of outcome was used to derive this gene set [3,12-14].
A major challenge for microarray studies, especially those with clinical implications, is validation [15,16]. Due to the practical barriers of cost and access to large numbers of fresh frozen tumor samples with associated clinical information, very few microarray studies have analyzed enough samples to allow promising initial findings to be sufficiently validated to justify the major investment required for clinical testing. An efficient approach would be to use public gene expression data repositories as test sets; however, it has been difficult to compare and/or
combine data sets from independent laboratories due to differences in sample preparation, experimental design, and microarray platforms. An accepted method for valida-tion is to derive a prognostic/predictive gene set from a "training set" and then apply it to a completely independ-ent "test set" [17]. The "purest" test sets are comprised of samples not generated by the primary investigators to remove any possibility of bias [18]. In this study, we illus-trate the successful application of these principles by (1) deriving a new breast tumor intrinsic gene list that identi-fies the "intrinsic" biological features of breast tumors and (2) validating this predictor using a combined test set of 311 breast tumor samples compiled from the public domain. These analyses show that the breast tumor intrin-sic subtypes are significant predictors of outcome when correcting for standard clinical parameters, and that com-mon patterns of expression and outcome predictions can be identified in data sets generated by independent labs.
Results
Identification of the Intrinsic/UNC gene set
Our goals were to (1) create a new breast tumor intrinsic list, (2) validate this list on an independent dataset to show the clinical significance of the "intrinsic" classifica-tions, and (3) to derive an objective "intrinsic subtype" classifier that could be used clinically (see Figure 1 for overview of analyses performed). An intrinsic analysis is a "within class" versus "across classes" analysis that identi-fies genes that show low variability within a group (i.e. a tumor-metastasis pair), but which show high variation in expression across different tumors; in essence, one is selecting for genes that are consistently expressed when
Overview of the analysis methods and datasets used in this paper Figure 1
Overview of the analysis methods and datasets used in this paper.
Training Set
A dataset of 105 breast tumor samples, 9 normal breast samples,
and 26 sample pairs (each pair of samples is taken from
the same patient), represented by 146 arrays, is used to
derive the 1300-gene "Intrinsic/UNC" gene set.
Combined Test Set
A test set of 311 tumors and 4 normal breast
samples represented by 315 arrays and 2800 genes in
common, was created by combining the datasets of
Sorlie et al. (2001; 2003), van't Veer et al. (2002) and
Sotiriou et al. (2003). This "combined test set" was
analyzed by hierarchical clustering using the subset
of "Intrinsic/UNC" genes that were present within
the combined test set (306 genes).
Single Sample Predictor (SSP)
The hierarchical clustering of the "combined test set" is
used to create 5 Subtype Mean expression profiles
(i.e. Centroids) based upon the expression of the
306 Intrinsic/UNC genes. New samples are then assigned
to the nearest subtype/centroid as determined by
Spearman correlation.
Validation of the SSP using 2 test datasets
The SSP is used to make subtype predictions on
2 test sets of homogenously treated patients.
The resulting classifications were then analyzed
using Kaplan-Meier Survival plots.
RFS m onths p = 0.040 0.2 0.4 0.6 0.8 1 1.2 0 50 100 150 200 Pr o b ab il it y Censored LumA LumB NormalBst 0 0.2 0.4 0.6 0.8 1 1.2 0 50 100 150 200 250 OS months P roba bi li ty Censored Basal HER2+/ER-Luminal A Luminal B normal-like p = 0.0001
individual tumors are examined, but that vary in expres-sion across different tumors. To develop a new breast tumor intrinsic gene set (Intrinsic/UNC), we assayed a training set of 105 breast tumor samples and 9 normal breast samples, which contained 26 sample pairs (See Additional file 2, 146 microarray experiments in total), using Agilent oligo microarrays. Using the intrinsic analy-sis method as described in Sorlie et al. 2003[3], we identi-fied an intrinsic gene set of 1410 microarray elements representing 1300 genes. We felt it important to create a new intrinsic list because first, we wanted to take advan-tage of newer microarrays (Agilent arrays with 17,000 genes vs. 8,000 gene cDNA microarrays previously used[3]), and second, we wanted to use paired tumor samples that were not before-and-after chemotherapy
pairs, but were instead pre-treatment tumor pairs. The Intrinsic/UNC gene set showed overlap with a previous breast tumor intrinsic gene set (108 genes in common with the Intrinsic/Stanford gene set of Sorlie et al. 2003[3]), but also showed a significant increase in gene number likely due to the greater number of genes present on current microarrays.
Validation of the Intrinsic/UNC gene list
To evaluate the Intrinsic/UNC gene set on an independent test dataset, we applied it to a "combined test set" of 315 breast samples (311 tumors and 4 normal breast samples) using hierarchical clustering methods as have been done previously [1-3]. The "combined test set" of 315 breast samples was a single data set created by combining
Hierarchical cluster analysis of the 315-sample combined test set using the Intrinsic/UNC gene set reduced to 306 genes Figure 2
Hierarchical cluster analysis of the 315-sample combined test set using the Intrinsic/UNC gene set reduced to 306 genes. (A) Overview of complete cluster diagram. (B) Experimental sample-associated dendrogram. (C) Luminal/ER+ gene cluster with
GATA3-regulated genes highlighted in pink. (D) HER2 and GRB7-containing expression cluster. (E) Interferon-regulated cluster
containing STAT1. (F) Basal epithelial cluster. (G) Proliferation cluster.
chitinase 3-like 1 cartilage glycoprotein-39 fatty acid binding protein 7, brain cysteine and glycine-rich protein 2 inhibitor of DNA binding 4
v-kit
secreted frizzled-related protein 1 matrix metalloproteinase 7 matrilysin, uterine
forkhead box C1
chemokine C-X3-C motif ligand 1 nuclear factor I/B
prion protein p27-30 Creutzfeld-Jakob disease
cadherin 3, type 1, P-cadherin placental
ceruloplasmin ferroxidase cellular retinoic acid binding protein 1 mucin 1, transmembrane DAZ associated protein 2 transcription elongation factor A SII-like 1 hypothetical protein FLJ21827
solute carrier family 9 sodium/hydrogen exchanger, isoform 3 keratin 18
programmed cell death 4 neoplastic transformation inhibitor cyclin G2
v-myb myeloblastosis viral oncogene homolog avian complement component 4A
fucosyltransferase 8 alpha 1,6 fucosyltransferase trefoil factor 3 intestinal
basic transcription factor 3
X-box binding protein 1 estrogen receptor 1 GATA binding protein 3
solute carrier family 39 metal ion transporter, member 6 LPS-responsive vesicle trafficking, beach and anchor containing rabaptin, RAB GTPase binding effector protein 1 J domain containing protein 1 glutathione S-transferase M3 brain DKFZp564J157 protein TNF receptor-associated factor 4 hypothetical protein FLJ10700 ATP-binding cassette, sub-family C CFTR/MRP, member 3
v-erb-b2
growth factor receptor-bound protein 7
non-metastatic cells 2, protein NM23B expressed in non-metastatic cells 1, protein NM23A expressed in CGI-48 protein
ATP synthase, H+ transporting, mitochondrial F0 complex hypothetical protein FLJ13855 clathrin, heavy polypeptide Hc H3 histone, family 3B H3.3B interferon, gamma-inducible protein 30 interferon induced transmembrane protein 1 9-27 interferon-stimulated transcription factor 3, gamma 48kDa interferon, alpha-inducible protein clone IFI-6-16 interferon, alpha-inducible protein clone IFI-15K
signal transducer and activator of transcription 1
interferon stimulated gene 20kDa chemokine C-X-C motif ligand 9 caspase 1 N-myc and STAT interactor
v-yes-1 Yamaguchi sarcoma viral related oncogene superoxide dismutase 2, mitochondrial
proliferating cell nuclear antigen
chromosome 21 open reading frame 45 centromere protein F, 350/400ka mitosin Fanconi anemia, complementation group A BUB1 budding uninhibited by benzimidazoles 1 homolog yeast
v-myb myeloblastosis viral oncogene homolog avian-like 2
cyclin-dependent kinase inhibitor 3
serine/threonine kinase 6
cell division cycle 2, G1 to S and G2 to M baculoviral IAP repeat-containing 5 survivin CDC28 protein kinase regulatory subunit 2 pituitary tumor-transforming 1 MAD2 mitotic arrest deficient-like 1 yeast CDC28 protein kinase regulatory subunit 1B
topoisomerase DNA II alpha 170kDa replication factor C activator 1 4, 37kDa
chromatin assembly factor 1, subunit B p60 LGN protein
GTP binding protein 4 SFRS protein kinase 1
Luminal A Basal-like
HER2+/ER-Normal Breast-like 1:1 >2 >4 >6 >2 >4 >6
relative to median expression
B
C
D
E
A
F
G
IFN Luminal Btogether the data from Sorlie et al. 2001 and 2003 (cDNA microarrays)[2,3], van't Veer et al. 2002 (custom Agilent oligo microarrays)[5] and Sotiriou et al.2003 (cDNA microarrays)[19]. We created a single data table of these three sets by first identifying the common genes present across all three microarray data sets (2800 genes). Next, we used Distance Weighted Discrimination (DWD) to combine these three data sets together [20]. DWD is a multivariate analysis tool that is able to identify system-atic biases present in separate data sets and then make a global adjustment to compensate for these biases; in essence, each separate data set is a multi-dimensional cloud of data points, and DWD takes two points clouds and shifts one such that it more optimally overlaps the other. Finally, we determined that 306 of the 1300 unique Intrinsic/UNC genes were present in the combined test set and performed a hierarchical clustering analysis of these 306 genes and 315 samples (Figure 2; see Additional file 1, for the complete cluster diagram). We analyzed the combined test set instead of analyzing each of the 3 data-sets separately because we believed this would provide more statistical power to perform multivariate analysis, and would yield more meaningful results because any finding would need to be shared/present across all 3 data-sets. Remarkably, despite the loss of genes in the Intrinsic/ UNC list due to the requirement of having to be present on 4 different microarray platforms, the hierarchical clus-tering analysis in Figure 2 identified the five main sub-types/groups corresponding to the previously defined HER2+/ER-, Basal-like, LumA, LumB and Normal Breast-like tumor groups [2,3].
As shown in previous studies, a HER2+ expression cluster was observed in the cluster analysis of the "combined test set" and contained multiple genes from the 17q11 ampli-con including HER2/ERBB2 and GRB7 (Figure 2D). The HER2+ intrinsic subtype (pink dendrogram branch in Fig-ure 2B) was predominantly ER-negative (i.e. HER2+/ER-) as previously shown. A Basal-like expression cluster was also present and contained genes (i.e. c-KIT, FOXC1 and
P-Cadherin) previously identified to be characteristic of
basal epithelial cells (Figure 2F). Using the program EASE[21], the Gene Ontology (GO) categories "extracellu-lar space" and "extracellu"extracellu-lar region" were over-repre-sented relative to chance in the Basal epithelial gene cluster. As shown in previous studies, a Luminal/ER+ expression cluster was present and contained ER, XBP1,
FOXA1 and GATA3 (Figure 2C). GATA3 has recently been
shown to be somatically mutated in some ER+ breast tumors, and some of the genes in Figure 2C are GATA3-regulated (FOXA1 and TFF3)[22], thus showing the func-tional clustering of a transcription factor and some of its direct targets. The Gene Ontology (GO) categories "tran-scription regulator activity" and "DNA binding" were
over-represented relative to chance in the Luminal/ER+ gene cluster.
The most significant difference between the previous Intrinsic/Stanford gene lists and the new Intrinsic/UNC gene list was that the latter contained a large proliferation signature (Figure 2G) [23-25]. As expected, EASE analysis showed that the GO categories "mitotic cell cycle" and "M phase" were over-represented relative to chance in the proliferation signature. The inclusion of proliferation genes in the Intrinsic/UNC gene set, but not in the Intrin-sic/Stanford gene set, is likely due to the fact that the Intrinsic/Stanford lists were based upon before-and-after chemotherapy paired samples of the same tumor, while the Intrinsic/UNC list was based upon paired samples taken at the same time point with respect to chemother-apy (22/26 were pre-treatment pairs). This finding sug-gests that tumor cell proliferation rates do vary before and after chemotherapy, but that proliferation is a reproduci-ble and intrinsic feature of a tumor's expression profile. A possible new tumor group (IFN) characterized by the high expression of Interferon (IFN)-regulated genes was observed in the combined test set analysis (Figure 2E). According to EASE, the GO categories "immune response" and "defense response" were over-represented relative to chance in the interferon-regulated gene cluster. This clus-ter contained STAT1, which is thought to be the transcrip-tion factor responsible for mediating IFN-regulatranscrip-tion of gene expression [26,27]. Genes in the IFN cluster have been linked to lymph node metastasis and poor prognosis [7,13]. In summary, the Intrinsic/UNC list contained more genes than previous lists, encompasses most fea-tures of the Intrinsic/Stanford list (i.e. Basal, Luminal/ ER+, and HER2-amplicon gene clusters) and adds the bio-logically and clinically relevant proliferation signature.
Tumor subtypes identified by the Intrinsic/UNC gene set are predictive of outcome
To determine how many biologically relevant tumor sub-types/groups might be present within the cluster in Figure 2, we used 3 criteria, which resulted in the identification of 6 potential subtypes/groups. The first criterion was the simple and obvious dendrogram branching pattern (Fig-ure 2B) suggesting six groups. Second was the observation that each of the six groups uniquely expressed distinct sets of known biologically relevant genes including the basal, luminal/ER+, HER2-amplicon, IFN-regulated, and prolif-eration-associated signatures. Third was our knowledge of the previous classifications made by the Sorlie et al. 2003 Intrinsic/Stanford list of the Stanford/Norway samples (these samples are identified in Additional file 1): there was a high concordance (78%) between the classification of these samples made using either the Sorlie et al. 2003 Intrinsic/Stanford list or the Intrinsic/UNC list (excluding
the IFN samples). Therefore, the 311 tumors/patients were stratified into six groups, and we proceeded to look for differences in outcomes and associations with other clinical parameters between these six groups. The Intrin-sic/UNC gene set identified tumor groups/subtypes that were predictive of Relapse-Free Survival (RFS, Figure 3A) and Overall Survival (OS, p = 0.000001, data not shown) in Kaplan-Meier survival analysis on the combined test set. As previously seen in Sorlie et al. (2001 and 2003), the LumA group had the best outcome while the HER2+/ER-, Basal-like, and LumB groups had significantly worse out-comes. The new IFN class had a Kaplan-Meier survival curve similar to that of LumB, and both showed elevated proliferation rates when compared to LumA (Figure 2G). In the combined test set, the standard clinical parameters of ER status, node status, grade, and tumor size (note: data for clinical HER2 status was not available) were significant
predictors of RFS using Kaplan-Meier analysis (Figure 4), thus showing that the act of combining three different patient sets together did not destroy the prognostic abili-ties of these standard markers. In a multivariate Cox pro-portional hazards analysis of the combined test set using these standard clinical parameters, size, grade and ER sta-tus were significant predictors of RFS (Table 1A).
To further evaluate the prognostic/predictive value of the intrinsic subtype classification, we performed multivariate Cox proportional hazards analysis of the combined test set using the six intrinsic subtypes/groups defined above and the five standard clinical parameters with RFS, OS, or DSS as the endpoint (Table 1B shows analysis for RFS). The intrinsic subtypes, when added to the multivariate model containing the standard clinical variables, resulted in a model significantly more predictive of RFS, OS, and DSS (p = 0.01, 0.009, and 0.04 respectively, by the
likeli-Kaplan-Meier survival curves of breast tumors classified by intrinsic subtype Figure 3
Kaplan-Meier survival curves of breast tumors classified by intrinsic subtype. Survival curves are shown for (A) the 315-sample combined test set classified by hierarchical clustering using the Intrinsic/UNC gene set and (B) the 60-sample Ma et al., (C) 96-sample Chang et al., and (D) 105-96-sample (used to derive the Intrinsic/UNC gene set) datasets classified by the Nearest-Cen-troid predictor (Single Sample Predictor).
0 0.2 0.4 0.6 0.8 1 1.2 0 50 100 150 200 250 RFS m onths P ro b a b ilit y Censored Basal-like HER2+/ER-LumA LumB NormBst
p=1.1x10⁻⁷
A
Ma et al. dataset
0 0.2 0.4 0.6 0.8 1 1.2 0 50 100 150 200 RFS m onths P ro b a b ilit y Censored Basal-like HER2+/ER-LumA LumB IFN NormBst RFS m onthsp=0.04
0 0.2 0.4 0.6 0.8 1 1.2 0 50 100 150 200 P ro b a b ilit y Censored LumA LumB NormalBstC
96-sample Chang et al. dataset
0 0.2 0.4 0.6 0.8 1 1.2 0 50 100 150 RFS m onths Censored Basal-like HER2+/ER-LumA LumB NormBst
p=0.02
D
B
p=2.1x10⁻⁵
105-sample UNC dataset
315-sample combined test set
P
roba
bi
li
hood-ratio test). In multivariate analysis for RFS (Table 1B), the Basal-like, LumB and HER2+/ER- subtypes had hazard ratios significantly greater than 1 (LumA served as the reference group), while the IFN and Normal Breast-like groups were not significant. Thus, the intrinsic sub-types classifications of LumA, LumB, Basal-like and HER2+/ER- add new and important prognostic informa-tion beyond what the standard clinical predictors provide.
Associations of the intrinsic subtypes with clinical and biological parameters
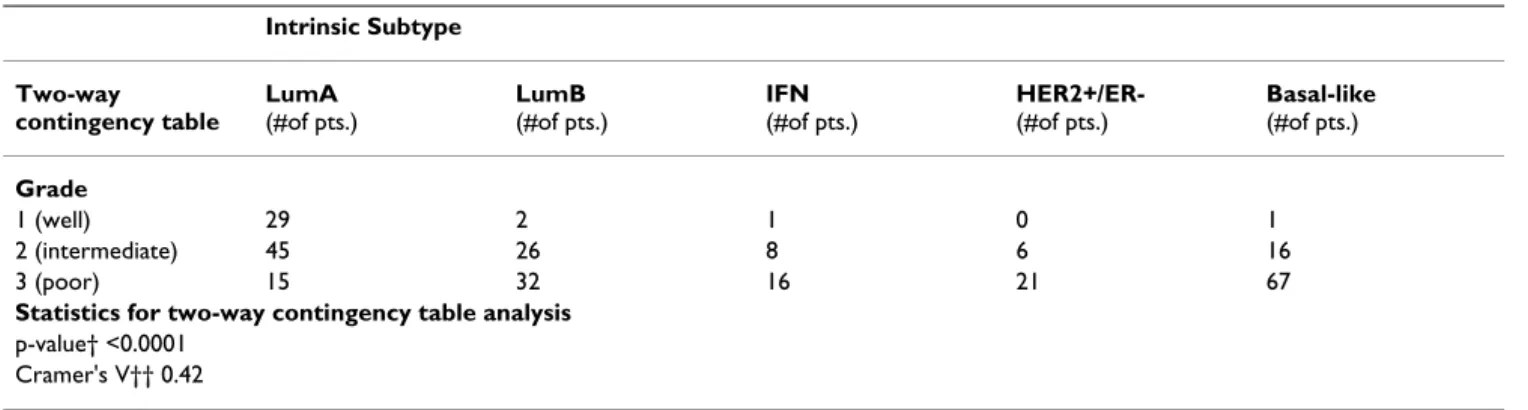
To further characterize and better understand the intrinsic subtypes, we determined whether an association existed between intrinsic subtype and grade, node status, ER sta-tus, age, and tumor size in the combined test set. Two-way contingency table analysis showed significant association between grade and subtype, with HER2+/ER- and Basal-like tumors more Basal-likely to be grade 3 (Table 2). The Cramer's V statistic[28], which measures the strength of association between two variables in a contingency table,
indicated a substantial association (Cramer's V > 0.36) between grade and subtype. Two-way contingency table analysis did not show significant association between node status and subtype (p = 0.44), but did show signifi-cant association between ER status and subtype (p < 0.0001; Cramer's V = 0.72) and between tumor size and subtype (p = 0.01; Cramer's V = 0.17). As would be expected, ER+ tumors were more likely to be LumA or LumB. As indicated by the low Cramer's V (Cramer's V < 0.19 indicates a low relationship), tumor size and subtype were not strongly correlated.
To determine association between age and subtype, we used an unpaired Student's t-test to compare the average ages of diagnosis of each tumor subtype. Interestingly, the average age of diagnosis for HER2+/ER- tumors was signif-icantly less than that for all other tumor types. The average age of diagnosis for LumA tumors was significantly greater than that for LumB tumors.
Kaplan-Meier survival curves using RFS as the endpoint, for the common clinical parameters present within the 315-sample combined test set
Figure 4
Kaplan-Meier survival curves using RFS as the endpoint, for the common clinical parameters present within the 315-sample combined test set. Survival curves are shown for (A) ER status, (B) node status, (C) histologic grade (1 = well-differentiated, 2 = intermediate, 3 = poor), and (D) tumor size (1 = diameter of 2 cm or less; 2 = diameter greater than 2 cm and less than or equal to 5 cm; 3 = diameter greater than 5 cm; 4 = any size with direct extension to chest wall or skin).
ER status p < 0.00001
A
0 0.2 0.4 0.6 0.8 1 1.2 0 50 100 150 200 RFS m onths P ro b a b ilit y Censored ER-neg ER+ Node status p < 0.000004B
0 0.2 0.4 0.6 0.8 1 1.2 0 50 100 150 200 RFS m onths Pr o b a b il it y Censored Node -Node + Tumor Size p < 0.00000001D
0 0.2 0.4 0.6 0.8 1 1.2 0 50 100 150 200 RFS m onths P ro b a b ilit y Censored 1 2 3 4C
Tumor Grade p < 0.0000001 0 0.2 0.4 0.6 0.8 1 1.2 0 50 100 150 200 RFS m onths P ro b a b ilit y Censored Grade 1 Grade 2 Grade 3 Grade 3Derivation and application of a Single Sample Predictor
A caveat to the above analyses is that our classifications were based upon hierarchical clustering, which is a pow-erful tool for intrinsic class discovery, but which is not suited for individual sample classification because to clas-sify a new sample would require a reanalysis of all sam-ples. Therefore, we wanted to create an unchanging and objective method to classify tumors according to intrinsic subtype that could be clinically applicable. To this end, we developed a Single Sample Predictor (SSP) using the com-bined test set hierarchically clustered using the 306 Intrin-sic/UNC genes (Figure 1). For the SSP, a mean expression profile (i.e. centroid) was created for each subtype that was significant in the multivariate analysis (LumA, LumB, Basal-like, HER2+/ER-) and for the Normal Breast-like group using the combined test set (Figure 2). Next, any new sample is then compared to each Centroid and assigned by the SSP to the nearest subtype/centroid as determined by Spearman correlation (note: this SSP is based on methods developed by Tibshirani and
col-leagues[3,29,30]); thus, the SSP contains five different idealized profiles, and any new sample is compared to each of the five profiles and assigned a profile label (i.e. subtype name) based upon the single idealized profile it most resembled.
To validate the SSP, we tested it on two additional datasets not used previously. The first was the 60-patient Ma et al. dataset, which represents a group of early stage ER+ tamoxifen-treated patients [6]. The SSP classified these samples as follows: 2 Basal-like, 2 HER2+/ER-, 12 Normal Breast-like, 34 LumA, and 9 LumB. The 2 Basal-like and 2 HER2+/ER- assigned samples were excluded from a sur-vival analysis because they were too few for a meaningful survival analysis and possibly were misclassified ER-nega-tive tumors. Among the remaining samples the SSP classi-fication was a significant predictor of RFS (p = 0.04, Figure 3B), due to the poor outcome of the LumB group. Next, we applied the SSP to a 96-sample test set of local only (surgery)-treated patients from Chang et al. [31]. The tumor groups identified by the SSP showed significant dif-ferences in RFS (Figure 3C, p = 0.0006) and OS (p = 0.001, data not shown) in Kaplan-Meier analysis, with the poor outcome groups as expected: LumB, Basal-like, and HER2+/ER-. Thus, the SSP identified tumor groups that are truly prognostic and have significantly different out-comes as was seen before: namely, LumA always has the most favorable outcome, while LumB, Basal-like and HER2+/ER- do poorly[2,3,9,19].
We also applied the SSP onto the 105-sample dataset used to derive the Intrinsic/UNC gene list, which is technically not a test set for the SSP because it was used to derive the Intrinsic/UNC gene set. The tumor groups identified by the SSP showed significantly different RFS (Figure 3D, p = 0.02) and OS (p = 0.03, data not shown) in Kaplan-Meier analysis with the poor outcome groups again being LumB, Basal-like, and HER2+/ER-. A subset of the 105-sample dataset (48 in total) had been previously characterized using an immunohistochemical (IHC) analysis[32], which showed that (1) all 18 Basal-like tumors were ER-negative and HER2-ER-negative (defined as not having a 3+ score on HER2 IHC analysis), (2) all 18 luminal subtype tumors were ER-positive and HER2-negative, and (3) all 12 HER2+/ER- subtype tumors were ER-negative and 11 out of these 12 showed HER2-overexpression (defined as having a 3+ score on HER2 IHC analysis). Thus, the SSP correlated with many standard clinical parameters, and was also able to identify clinically relevant groups (i.e. LumA vs. LumB) not identifiable using the standard clin-ical assays, thus indicating potential value as an objective classification method that should be developed further as a clinically applicable test.
Table 1: Multivariate Cox proportional hazards analysis of (A) standard clinical factors alone, or with (B) the Intrinsic Subtypes in relation to Relapse-Free Survival for the 315-sample combined test set. Size was a binary variable (0 = diameter of 2 cm or less, 1 = greater than 2 cm); node status was a binary variable (0 = no positive nodes, 1 = one or more positive nodes); age was a continuous variable formatted as decade-years. Hazard ratios for Intrinsic Subtypes were calculated relative to the Luminal A subtype. Variables found to be significant (p < 0.05) in the Cox proportional hazards model are shown in bold.
A. Relapse-Free survival
Variable Hazard Ratio (95% CI) p-value
Age, per decade 1.04 (0.90–1.20) 0.64 ER status 0.59 (0.41–0.83) 0.003 Node status 1.41 (0.98–2.04) 0.07 Tumor grade 2 vs. 1 2.41 (1.08–5.36) 0.032 Tumor grade 3 vs. 1 3.98 (1.80–8.82) 0.0007 Size 1.60 (1.31–1.95) <0.0001 B. Relapse-Free survival
Variable Hazard Ratio (95% CI) p-value
Age, per decade 1.08 (0.94–1.24) 0.29 ER status 0.69 (0.42–1.13) 0.14 Node status 1.35 (0.92–1.98) 0.13 Tumor grade 2 vs. 1 1.88 (0.82–4.32) 0.14 Tumor grade 3 vs. 1 2.58 (1.08–6.12) 0.03 Size 1.59 (1.30–1.95) <0.0001 Basal-like vs. LumA 2.02 (1.05–3.90) 0.036 HER2+/ER- vs. LumA 3.47 (1.78–6.76) 0.0003 LumB vs. LumA 1.92 (1.07–3.45) 0.028 IFN vs. LumA 1.40 (0.67–2.91) 0.37 Normal-like vs. LumA 1.56 (0.59–4.16) 0.37
Discussion
The development and validation of gene sets for cancer patients requires significant resources because large train-ing and test sets are required to achieve robust results. In fact, microarray studies are often criticized for a lack of rig-orous validation due to small sample sizes [17,18]. There-fore, we utilized a previously described microarray data set combining method (Distance Weighted Discrimination) to create a large validation test set of over 300 tumors, and used it to validate a newly derived gene list for breast cancer prognostication and prediction. This approach allowed us to perform a multivariate analysis in which we show for the first time that the intrinsic subtype classification adds valu-able information in the presence of five standard clinical parameters. We believe this combined test set is a valid test set for use in our analysis because after the multiple data sets were combined, the prognostic abilities of the standard clinical variables such as ER and grade remained intact. The remarkable power of our DWD-based approach is indicated by the fact that although samples came from dif-ferent platforms, hierarchical clustering analysis of the combined data set managed to group samples and genes based upon biology, and not some artifact caused by com-bining the data sets together. Evidence that this grouping reflected biology and not some artifact comes from (1) the finding that various Gene Ontology terms were signifi-cantly over-represented relative to chance in individual gene clusters seen in this analysis and (2) the groupings of the samples showed inter-dataset mixing and were signif-icant predictors of outcome in univariate Kaplan-Meier and multivariate Cox analysis. It is also remarkable that this classification was successful in predicting outcome despite the fact that the Intrinsic/UNC gene set was reduced from 1300 genes to 306 genes in the combined test set; this indicates the robust nature of the intrinsic subtypes as defined by the new Intrinsic/UNC gene list.
One of the accomplishments of this manuscript was to develop an unchanging and objective intrinsic subtype predictor that could be used routinely in the clinical set-ting. This was accomplished by first identifying a new intrinsic gene set and then using this set to develop the Single Sample Predictor (SSP) that was shown here to be both prognostic on the local therapy-only patient subset from Chang et al. [31] and predictive of outcomes on the ER+ tamoxifen-treated data set of Ma et al. [6]. Many other gene expression based predictors for breast cancer patients have been developed, and in a complementary publica-tion[33], we tested the intrinsic subtype SSP developed here, relative to those predictions made by four other pre-viously published breast cancer prognostic/predictive gene sets using a single patient/tumor set of 295 cases; the four other expression-based predictors used were (1) the "70-gene" Good vs. Poor outcome predictor developed by van't Veer and colleagues[5,11], (2) the "Wound-Response" profile developed by Chang et al[31,34], (3) the "Recurrence Score (RS)" profile developed by Paik et al. [10], and (4) the 2-gene (HOXB13:IL17BR) ratio pre-dictor developed by Ma et al. [6]. The results showed that of samples classified as Basal-like, HER2+/ER-, or LumB by the SSP, 93–100% were classified by the 70-gene, RS and Wound-Response predictors as being in each predic-tor's bad prognosis group. These data suggest that a high concordance exists across these multiple predictors, in particular the RS, 70-gene and Intrinsic Subtypes; thus, the new intrinsic gene list and classification method devel-oped here, when compared to other predictors as accom-plished in Fan et al. [33], showed that a high concordance across predictors exists, which provides additional valida-tion for each predictor.
Conclusion
The results of this study advance our current knowledge of the intrinsic breast tumor subtypes and provides an objec-tive method (SSP) for prospecobjec-tively classifying tumors Table 2: Association between tumor histologic grade and intrinsic subtype in the 315-sample combined test set.
Intrinsic Subtype Two-way contingency table LumA (#of pts.) LumB (#of pts.) IFN (#of pts.) HER2+/ER- (#of pts.) Basal-like (#of pts.) Grade 1 (well) 29 2 1 0 1 2 (intermediate) 45 26 8 6 16 3 (poor) 15 32 16 21 67
Statistics for two-way contingency table analysis
p-value† <0.0001 Cramer's V†† 0.42
†p-value calculated from Chi-square test on contingency table. ††Cramer's V statistic (value can range from 0 to 1) measures the strength of association between the two variables analyzed in the contingency table, with 1 indicating perfect association and 0 indicating no association.
that could be used in the clinical setting. More broadly speaking, our findings show that while the individual brushstrokes (i.e. genes) may sometimes show discord-ance across data sets, the portraits created by the com-bined patterns of the individual brushstrokes is conserved and recognizable across datasets because of the similari-ties to the family portrait [24]. Moreover, these data show that the breast tumor intrinsic subtypes identified using the Intrinsic/UNC gene list can be generalized to many different patient sets, both treated and untreated.
Methods
Sample collection, RNA isolation and microarray hybridization
105 fresh frozen breast tumor samples and 9 normal breast samples were obtained using IRB-approved proto-cols at 4 institutions: the University of North Carolina at Chapel Hill (UNC-CH), The University of Utah, Thomas Jefferson University, and the University of Chicago. This sample set represents an ethnically and geographically diverse cohort. Additional file 2 contains clinical data for these samples. Patients were heterogeneously treated according to the standard of care dictated by disease stage, ER and HER2 status.
Total RNA was purified from each sample using the Qia-gen RNAeasy Kit. RNA integrity was determined using the RNA 6000 Nano LabChip Kit and Agilent 2100 Bioana-lyzer. Total RNA amplification and labeling were done as previously described in [35]. Microarray hybridizations were performed using Agilent Human oligonucleotide (1Av1, 1Av2 and custom designed 1Av1-based) microar-rays using 2 µg of Cy3-labeled common reference sample that is a modified version of the Stratagene Human Uni-versal Reference[36], and 2 µg of Cy5-labeled experimen-tal sample. Microarrays were hybridized overnight, washed, dried, and scanned as described in [35]. The image files were analyzed with GenePix Pro 4.1 and loaded into the UNC-CH Microarray Database[37] where a Lowess normalization procedure was performed to adjust the Cy3 and Cy5 channels[38]. All primary micro-array data associated with this study are available at [39], 2006 #2192} and in the GEO[40] under the accession number of GSE1992, series GSM34424-GSM34568.
Identification of the intrinsic gene set
We derived a new breast tumor intrinsic gene set, referred to as the "Intrinsic/UNC" list, using a training set com-posed of the 105 tumor samples described above, 9 nor-mal breast samples, and 26 sample pairs (in total, represented by 146 microarrays). 15, 9, and 2 of the 26 sample pairs were different physical pieces of the same tumor (taken at the same time point), tumor-metastasis pairs and normal sample pairs, respectively. The back-ground subtracted, Lowess normalized log2 ratio of Cy5 to
Cy3 intensity values were first filtered to select genes that had a signal intensity of at least 30 units above back-ground in both the Cy5 and Cy3 channels. Only genes that met these criteria in at least 70% of the 146 microar-rays were included for subsequent analysis. Next, we per-formed an "intrinsic" analysis as described previously[3] using the 26 sample pairs and 86 additional microarrays. An intrinsic analysis identifies genes showing low bility in expression within paired samples but high varia-bility in expression across different tumors; for each gene a ratio of "within-pair variance" to "between-subject vari-ance" is computed. Genes with ratios below one standard deviation of the mean ratio were defined as "intrinsic". This analysis resulted in 1410 microarray elements repre-senting 1300 genes being identified as "intrinsic". In order to obtain an estimate of the number of false-positive intrinsic genes, we permuted the sample labels to generate 26 random pairs and 86 non-paired samples. This permu-tation was performed 100 times and the intrinsic scores were calculated for each. These permuted scores were used to determine a threshold on the intrinsic score corre-sponding to a false discovery rate (FDR) less than 1%. The selected threshold resulted in 1410 microarray features being called significant with a median FDR = 0.3% and 90th percentile FDR = 0.5%. (See Tusher et al. for a com-plete description of this calculation [41]).
Creation and analyses of the combined test set
The independent test set was a 315-sample "combined test set" consisting of three DNA microarray datasets (Sor-lie et al. 2001 and 2003[2,3], van't Veer et al. 2002[5] and Sotiriou et al. 2003[19]). To combine these datasets obtained from different microarray platforms, we per-formed the following pre-processing methods. First, the R/G ratios in each dataset were log2 transformed and Low-ess normalized[38]. Next, missing values were k-NN imputed[42]. Gene annotations from each dataset were converted into UniGene Cluster IDs (UCIDs, Build 161) using the SOURCE database[43], and multiple occur-rences of a UCID were collapsed by taking the median value for that ID within each experiment and platform, which resulted in ~2800 genes having expression data in all three datasets. Next, Distance Weighted Discrimina-tion[20] was performed in a pair-wise fashion by first combining the Sorlie et al. and Sotiriou et al. datasets, and then combining this with the van't Veer et al. dataset to make a single dataset. In the final pre-processing step, each microarray experiment was normalized such that each column/experimental sample was standardized to N(0,1), and each row/gene was median centered. 306 of the 1300 Intrinsic/UNC genes had microarray data present in the combined test set and were used in a two-way average-linkage hierarchical cluster analysis [44]. Cluster results were visualized using the program "Treeview".
Derivation of the Single Sample Predictor
The Single Sample Predictor (SSP) is a Nearest Centroid-based method Centroid-based upon the work of Hastie and Tib-shirani [3,45,46]. Our SSP classifies an individual sample according to its nearest centroid as determined by Spear-man correlation. To derive our SSP, we utilized the 315-sample combined test set from Figure2 to create centroids for each of the five intrinsic subtypes (LumA, LumB, HER2+/ER-, Basal-like and Normal Breast-like). Please note that we did not create a centroid for the IFN group because it failed significance in multivariate testing, but did create a centroid for the Normal Breast-like group because we feel it is important to be able to identify true normal samples; an H&E examination of most tumor samples falling into the Normal Breast-like category shows that this is occurring mainly because of too much normal tissue contamination. To create each intrinsic subtype centroid, we averaged the gene expression profiles for samples clearly assigned to each subtype (limiting the analysis to 249 of the 315 sam-ples) using the hierarchical clustering dendrogram as a guide (Figure 2). We then applied the SSP to two inde-pendent test datasets: (1) the Ma et al. 60-sample ER+ tamoxifen-treated tumor dataset and (2) the Chang et al. 96-sample local only-treated tumor dataset. By matching UCIDs, microarray data for as many as possible of the 306 Intrinsic/UNC genes was obtained from these 2 datasets. To remove microarray platform/source systematic biases, we applied DWD to the 2 test datasets relative to the com-bined test set. The SSP was then used to classify tumors by intrinsic subtype in these 2 test datasets. Using similar methods, the SSP was also applied to the 105-sample training set used to derive the intrinsic/UNC gene set.
Survival analyses
Kaplan-Meier survival plots were compared using the Cox-Mantel log-rank test in WinSTAT for Excel (R. Fitch Software). Two-way contingency table analysis and unpaired Student's t-test were done using WinSTAT. For the "combined test set", multivariate Cox proportional hazards analysis was performed using SAS (Cary, NC).
Authors' contributions
C.M.P. was the Principal Investigator and instigated the study, helped with design and wrote the paper, while J.P., O.I.O, and P.S.B. were the Principal Investigators at each of the three other participating institution and were involved in the study design, implementation and manu-script writing. C.F., J.S.M., B.F.Q., A.N., and J.P. were responsible for the statistical analyses and some writing. Z.H and X.H. performed all of the tumor RNA preparation and microarray experiments and were involved in the writing. J.W. and Y.L. were responsible for all data man-agement and some data analysis. C.L. was responsible for the pathological assessment of most tumor samples and
was involved in the writing. M.E. and D.O. were involved in data analysis, interpretation and writing. Tumor sample collection, clinical data acquisition and interpretation was accomplished by L.C., M.E., R.N., M.T., A.R.O., D.D., L.P., E.N., M.M., H.H., M.M., J.F.Q., L.R.S., E.R., and L.D., and it should be noted that this was separately accomplished at four institutions.
Additional material
Acknowledgements
C.M.P. was supported by funds from the NCI Breast SPORE program to UNC-CH (P50-CA58223-09A1), by the National Institute of Environmen-tal Health Sciences (U19-ES11391-03) and by NCI (RO1-CA-101227-01). P.S.B. was supported by NCI R33-CA97769-01, O.I.O. by the National Institute of Environmental Health Sciences (P50 ESO12382), A.N by NSF Grant DMS 0406361, J.S.M. by NSF Grant DMS-0308331, and L.A.C. by NIH M01RR00046. The Breast Cancer Research Foundation supported C.M.P., O.I.O and L.R.S.
References
1. Perou CM, Sorlie T, Eisen MB, van de Rijn M, Jeffrey SS, Rees CA, Pol-lack JR, Ross DT, Johnsen H, Akslen LA, et al.: Molecular portraits of human breast tumours. Nature 2000, 406(6797):747-752. 2. Sorlie T, Perou CM, Tibshirani R, Aas T, Geisler S, Johnsen H, Hastie
T, Eisen MB, van de Rijn M, Jeffrey SS, et al.: Gene expression pat-terns of breast carcinomas distinguish tumor subclasses with clinical implications. Proc Natl Acad Sci U S A 2001, 98(19):10869-10874.
3. Sorlie T, Tibshirani R, Parker J, Hastie T, Marron JS, Nobel A, Deng S, Johnsen H, Pesich R, Geisler S, et al.: Repeated observation of breast tumor subtypes in independent gene expression data sets. Proc Natl Acad Sci U S A 2003, 100(14):8418-8423.
4. Sotiriou C, Powles TJ, Dowsett M, Jazaeri AA, Feldman AL, Asser-sohn L, Gadisetti C, Libutti SK, Liu ET: Gene expression profiles derived from fine needle aspiration correlate with response to systemic chemotherapy in breast cancer. Breast Cancer Res 2002, 4(3):R3.
5. van 't Veer LJ, Dai H, van de Vijver MJ, He YD, Hart AA, Mao M, Peterse HL, van der Kooy K, Marton MJ, Witteveen AT, et al.: Gene expression profiling predicts clinical outcome of breast can-cer. Nature 2002, 415(6871):530-536.
6. Ma XJ, Wang Z, Ryan PD, Isakoff SJ, Barmettler A, Fuller A, Muir B, Mohapatra G, Salunga R, Tuggle JT, et al.: A two-gene expression
Additional File 2
Supplemental Table 1. Clinical and microarray information associated with each patient in the 105-sample training dataset.
Click here for file
[http://www.biomedcentral.com/content/supplementary/1471-2164-7-96-S2.pdf]
Additional File 1
Supplemental Figure 1. Complete hierarchical cluster diagram of the 315-sample combined test set analyzed using the Intrinsic/UNC gene set, which was reduced to 306 genes based upon the gene overlap between datasets. Sorlie et al. sample names begin with the letters "BC", Sotiriou et al. sample names begin with "Exp", and van't Veer et al. sample names
begin with "sample".
Click here for file
[http://www.biomedcentral.com/content/supplementary/1471-2164-7-96-S1.pdf]
ratio predicts clinical outcome in breast cancer patients treated with tamoxifen. Cancer Cell 2004, 5(6):607-616. 7. Huang E, Cheng SH, Dressman H, Pittman J, Tsou MH, Horng CF, Bild
A, Iversen ES, Liao M, Chen CM, et al.: Gene expression predic-tors of breast cancer outcomes. Lancet 2003,
361(9369):1590-1596.
8. Zhao H, Langerod A, Ji Y, Nowels KW, Nesland JM, Tibshirani R, Bukholm IK, Karesen R, Botstein D, Borresen-Dale AL, et al.: Differ-ent gene expression patterns in invasive lobular and ductal carcinomas of the breast. Mol Biol Cell 2004, 15(6):2523-2536. 9. Bertucci F, Finetti P, Rougemont J, Charafe-Jauffret E, Cervera N,
Tarpin C, Nguyen C, Xerri L, Houlgatte R, Jacquemier J, et al.: Gene expression profiling identifies molecular subtypes of inflam-matory breast cancer. Cancer Res 2005, 65(6):2170-2178. 10. Paik S, Shak S, Tang G, Kim C, Baker J, Cronin M, Baehner FL, Walker
MG, Watson D, Park T, et al.: A multigene assay to predict recurrence of tamoxifen-treated, node-negative breast can-cer. N Engl J Med 2004, 351(27):2817-2826.
11. van de Vijver MJ, He YD, van't Veer LJ, Dai H, Hart AA, Voskuil DW, Schreiber GJ, Peterse JL, Roberts C, Marton MJ, et al.: A gene-expression signature as a predictor of survival in breast can-cer. N Engl J Med 2002, 347(25):1999-2009.
12. Bhattacharjee A, Richards WG, Staunton J, Li C, Monti S, Vasa P, Ladd C, Beheshti J, Bueno R, Gillette M, et al.: Classification of human lung carcinomas by mRNA expression profiling reveals dis-tinct adenocarcinoma subclasses. Proc Natl Acad Sci U S A 2001, 98(24):13790-13795.
13. Chung CH, Parker JS, Karaca G, Wu J, Funkhouser WK, Moore D, Butterfoss D, Xiang D, Zanation A, Yin X, et al.: Molecular classifi-cation of head and neck squamous cell carcinomas using pat-terns of gene expression. Cancer Cell 2004, 5(5):489-500. 14. Garber ME, Troyanskaya OG, Schluens K, Petersen S, Thaesler Z,
Pacyna-Gengelbach M, van de Rijn M, Rosen GD, Perou CM, Whyte RI, et al.: Diversity of gene expression in adenocarcinoma of the lung. Proc Natl Acad Sci U S A 2001, 98(24):13784-13789. 15. Michiels S, Koscielny S, Hill C: Prediction of cancer outcome
with microarrays: a multiple random validation strategy.
Lancet 2005, 365(9458):488-492.
16. Jenssen TK, Hovig E: Gene-expression profiling in breast can-cer. Lancet 2005, 365(9460):634-635.
17. Simon R, Radmacher MD, Dobbin K, McShane LM: Pitfalls in the use of DNA microarray data for diagnostic and prognostic classification. J Natl Cancer Inst 2003, 95(1):14-18.
18. Ioannidis JP: Microarrays and molecular research: noise dis-covery? Lancet 2005, 365(9458):454-455.
19. Sotiriou C, Neo SY, McShane LM, Korn EL, Long PM, Jazaeri A, Mar-tiat P, Fox SB, Harris AL, Liu ET: Breast cancer classification and prognosis based on gene expression profiles from a popula-tion-based study. Proc Natl Acad Sci U S A 2003, 100(18):10393-10398.
20. Benito M, Parker J, Du Q, Wu J, Xiang D, Perou CM, Marron JS: Adjustment of systematic microarray data biases.
Bioinformat-ics 2004, 20(1):105-114.
21. Hosack DA, Dennis G Jr, Sherman BT, Lane HC, Lempicki RA: Iden-tifying biological themes within lists of genes with EASE.
Genome Biol 2003, 4(10):R70.
22. Usary J, Llaca V, Karaca G, Presswala S, Karaca M, He X, Langerod A, Karesen R, Oh DS, Dressler LG, et al.: Mutation of GATA3 in human breast tumors. Oncogene 2004, 23(46):7669-7678. 23. Perou CM, Jeffrey SS, van de Rijn M, Rees CA, Eisen MB, Ross DT,
Pergamenschikov A, Williams CF, Zhu SX, Lee JC, et al.: Distinctive gene expression patterns in human mammary epithelial cells and breast cancers. Proc Natl Acad Sci U S A 1999, 96(16):9212-9217.
24. Chung CH, Bernard PS, Perou CM: Molecular portraits and the family tree of cancer. Nat Genet 2002, 32(Suppl):533-540. 25. Whitfield ML, Sherlock G, Saldanha AJ, Murray JI, Ball CA, Alexander
KE, Matese JC, Perou CM, Hurt MM, Brown PO, et al.: Identification of genes periodically expressed in the human cell cycle and their expression in tumors. Mol Biol Cell 2002, 13(6):1977-2000. 26. Bromberg JF, Horvath CM, Wen Z, Schreiber RD, Darnell JE Jr: Transcriptionally active Stat1 is required for the antiprolifer-ative effects of both interferon alpha and interferon gamma.
Proc Natl Acad Sci U S A 1996, 93(15):7673-7678.
27. Matikainen S, Sareneva T, Ronni T, Lehtonen A, Koskinen PJ, Julkunen I: Interferon-alpha activates multiple STAT proteins and
upregulates proliferation-associated IL-2Ralpha, c-myc, and pim-1 genes in human T cells. Blood 1999, 93(6):1980-1991. 28. Van Belle G, Fisher L: Biostatistics: a methodology for the
health sciences. 2nd edition. Hoboken, NJ: Wiley-Interscience John Wiley & Sons; 2004.
29. Bullinger L, Dohner K, Bair E, Frohling S, Schlenk RF, Tibshirani R, Dohner H, Pollack JR: Use of gene-expression profiling to iden-tify prognostic subclasses in adult acute myeloid leukemia. N
Engl J Med 2004, 350(16):1605-1616.
30. Bair E, Tibshirani R: Semi-supervised methods to predict patient survival from gene expression data. PLoS Biol 2004, 2(4):E108.
31. Chang HY, Nuyten DS, Sneddon JB, Hastie T, Tibshirani R, Sorlie T, Dai H, He YD, van't Veer LJ, Bartelink H, et al.: Robustness, scala-bility, and integration of a wound-response gene expression signature in predicting breast cancer survival. Proc Natl Acad
Sci U S A 2005, 102(10):3738-3743.
32. Livasy CA, Karaca G, Nanda R, Tretiakova MS, Olopade OI, Moore DT, Perou CM: Phenotypic evaluation of the basal-like subtype of invasive breast carcinoma. Mod Pathol 2005.
33. Fan C, Oh DS, Wessels L, Weigelt B, Nuyten DSA, Nobel AB, van't Veer LJ, Perou CM: Different gene expression-based predictors for breast cancer patients are concordant. N Engl J Med in press.
34. Chang HY, Sneddon JB, Alizadeh AA, Sood R, West RB, Montgomery K, Chi JT, van de Rijn M, Botstein D, Brown PO: Gene expression signature of fibroblast serum response predicts human can-cer progression: similarities between tumors and wounds.
PLoS Biol 2004, 2(2):E7.
35. Hu Z, Troester M, Perou CM: High reproducibility using sodium hydroxide-stripped long oligonucleotide DNA microarrays.
Biotechniques 2005, 38(1):121-124.
36. Novoradovskaya N, Whitfield ML, Basehore LS, Novoradovsky A, Pesich R, Usary J, Karaca M, Wong WK, Aprelikova O, Fero M, et al.: Universal Reference RNA as a standard for microarray experiments. BMC Genomics 2004, 5(1):20.
37. UNC Microarray Database [https://genome.unc.edu/] 38. Yang YH, Dudoit S, Luu P, Lin DM, Peng V, Ngai J, Speed TP:
Nor-malization for cDNA microarray data: a robust composite method addressing single and multiple slide systematic vari-ation. Nucleic Acids Res 2002, 30(4):e15.
39. UNC Breast Tumor Data [https://genome.unc.edu/pubsup/ breastTumor/]
40. Gene Expression Omnibus [http://www.ncbi.nlm.nih.gov/geo/] 41. Tusher VG, Tibshirani R, Chu G: Significance analysis of
micro-arrays applied to the ionizing radiation response. Proc Natl
Acad Sci U S A 2001, 98(9):5116-5121.
42. Troyanskaya O, Cantor M, Sherlock G, Brown P, Hastie T, Tibshirani R, Botstein D, Altman RB: Missing value estimation methods for DNA microarrays. Bioinformatics 2001, 17(6):520-525.
43. Diehn M, Sherlock G, Binkley G, Jin H, Matese JC, Hernandez-Bous-sard T, Rees CA, Cherry JM, Botstein D, Brown PO, et al.: SOURCE: a unified genomic resource of functional annotations, ontol-ogies, and gene expression data. Nucleic Acids Res 2003, 31(1):219-223.
44. Eisen MB, Spellman PT, Brown PO, Botstein D: Cluster analysis and display of genome-wide expression patterns. Proc Natl
Acad Sci U S A 1998, 95(25):14863-14868.
45. Hastie T, Tibshirani R, Friedman JH: The elements of statistical learning: data mining, inference, and prediction. New York: Springer; 2001.
46. Tibshirani R, Hastie T, Narasimhan B, Chu G: Diagnosis of multiple cancer types by shrunken centroids of gene expression. Proc