High-Resolution Solid-State
13C NMR Spectroscopy of the Paramagnetic
Metal-Organic Frameworks, STAM-1 and HKUST-1
Daniel M. Dawson, Lauren E. Jamieson, M. Infas H. Mohideen, Alistair C. McKinlay,
Iain A. Smellie, Romain Cadou, Neil S. Keddie, Russell E. Morris and Sharon E. Ashbrook*
School of Chemistry and EaStCHEM, University of St Andrews, North Haugh, St Andrews KY16 9ST, UK
*Author to whom correspondence should be addressed.
Electronic mail: [email protected]
Abstract
Solid-state 13C magic-angle spinning (MAS) NMR spectroscopy is used to
investigate the structure of the Cu(II)-based metal-organic frameworks (MOFs), HKUST-1
and STAM-1, and the structural changes occurring within these MOFs upon activation
(dehydration). NMR spectroscopy is an attractive technique for the investigation of these
materials, owing to its high sensitivity to local structure, without any requirement for
longer-range order. However, interactions between nuclei and unpaired electrons in
paramagnetic systems (e.g., Cu(II)-based MOFs) pose a considerable challenge, not only for spectral acquisition, but also in the assignment and interpretation of the spectral
resonances. Here, we exploit the rapid T1 relaxation of these materials to obtain 13
C NMR
spectra using a spin-echo pulse sequence at natural abundance levels, and employ
frequency-stepped acquisition to ensure uniform excitation of resonances over a wide
frequency range. We then utilise selective 13
C isotopic labelling of the organic linker
molecules to enable an unambiguous assignment of NMR spectra of both MOFs for the
first time. We show that the monomethylated linker can be recovered from STAM-1 intact,
demonstrating not only the interesting use of this MOF as a protecting group, but also the
ability (for both STAM-1 and HKUST-1) to recover isotopically-enriched linkers, thereby
reducing significantly the overall cost of the approach.
Keywords
13C MAS NMR, paramagnetic MOFs, coordination polymer, isotopic enrichment, selective
Introduction
Metal-organic frameworks (MOFs) are an important class of porous crystalline materials, with a range of useful applications. Their structures are composed of inorganic metal-based units connected by polytopic organic “linkers”. The chemistry of MOFs is extremely versatile, with framework motifs forming from many different combinations of metals and linkers, and with many linkers capable of post-synthetic modification to introduce further chemical functionality.[1-4] The ability to tailor the chemistry of a particular structure, combined with the typically high porosity and high concentration of active sites, gives MOFs relevance to many areas of modern life, e.g., medicine, industry and the environment.[5,6]
In many cases, the structure of MOFs may be studied using Bragg diffraction techniques; an approach well suited to the study of the framework itself, in which atoms normally have well-defined positions on the diffraction timescale. However, applications of MOFs generally involve so-called “guest” species entering the pores of the MOF, and Bragg diffraction techniques may only be utilised when these occupy locations with long-range periodic regularity.[7,8] Guest molecules are, however, often disordered, either dynamically or orientationally, or present in sub-stoichiometric loading levels (i.e., not every unit cell or active site of the MOF contains a guest molecule),[2,9,10] again posing a challenge for structural analysis.
electrons.[11] The through-bond transferred hyperfine (or Fermi contact) interaction is mechanistically similar to a J coupling, but rapid flipping of the electronic spins generally means that this interaction is observed as a large isotropic shift, the magnitude of which typically decreases rapidly as the length of the bonding pathway between the unpaired electron and the nucleus in question increases. In addition, the through-space pseudocontact interaction results in a (typically smaller) contribution to the isotropic shift (when the electronic g tensor is asymmetric) and an anisotropic broadening.[12,13] The isotropic shift contribution(s) cannot be removed by magic angle spinning (MAS), and while the large paramagnetic shift anisotropy (PSA) has a similar orientation dependence to the CSA meaning that, in principle, it may be removed by MAS, its magnitude is often hundreds of kHz, and complete removal may not be practically possible with the available hardware. For spectra of nuclei with spin quantum number I = 1/2, the PSA (when present) is generally the dominant line-broadening effect. An additional factor to consider when acquiring NMR spectra of paramagnetic systems is the extremely rapid transverse (T2) and longitudinal (T1) nuclear relaxation induced by coupling to the electron spins,
which are typically several orders of magnitude faster than for diamagnetic analogues.[11]
Despite these additional complications inherent in the acquisition of 13
C NMR spectra of paramagnetic materials, several such spectra have been reported for systems ranging from metalloproteins (low concentration of non-connected metal centres)[14] to simple complexes of paramagnetic ions (high concentration of non-connected centres)[15-18] and to MOFs (high concentration of interconnected metal centres).[19-21] From these
reports, a general strategy emerges for the successful acquisition of 13
C NMR spectra of paramagnetic materials. This strategy is centred on the use of rapid MAS (to reduce the number of spinning sidebands, predominantly arising from the PSA) and extensive signal averaging (enabled by the rapid transverse relaxation induced by unpaired electrons). For diamagnetic materials typical 13
C NMR experiments are carried out with cross polarisation (CP) from 1
H (to overcome the sensitivity issues associated with the moderate gyromagnetic ratio and ca. 1 % natural abundance), followed by decoupling of 1
(described by the time constant, T1ρ) leads to very poor or no signal enhancement and, unlike the diamagnetic case, dipolar interactions are only a minor contribution to the linewidth (especially when fast MAS is employed). By omitting cross polarisation and decoupling, rapid experimental repeat rates (on the order of tens of times per second) are possible without causing damage to the probe hardware.[18] This allows extensive signal averaging to be carried out (typically averaging over tens or hundreds of thousands of transients) to overcome the inherently low sensitivity of 13
C. The use of rapid MAS allows for a rotor-synchronised spin echo with a short τ delay, which is essential for observing undistorted lineshapes for particularly broad resonances. In addition to these considerations, the large shift ranges often observed in paramagnetic materials mean that, in many cases, variable-offset experiments are required, as the spectral resonances can be several times wider than the excitation bandwidth of the pulses applied. In such experiments, a number of separate sub-spectra are acquired with systematically-incremented transmitter offsets, and then summed to give the complete spectrum.[16,22,23] In this work we employ a spin-echo based approach, with short recycle intervals to exploit the rapid longitudinal relaxation rates, and utilise frequency-stepped acquisition to ensure uniform excitation of all spectral resonances, to study the local structure of the Cu(II)-based MOFs, HKUST-1 and STAM-1.
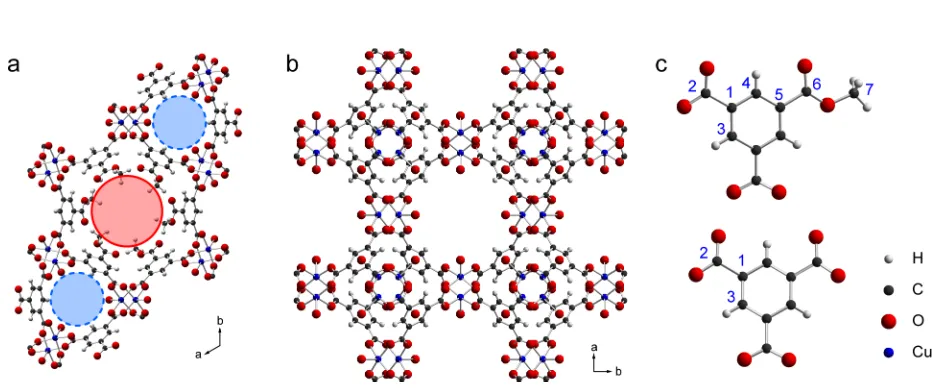
The synthesis of STAM-1 was recently reported,[24,25] and its structure is based on copper “paddlewheel” dimers connected by monomethyl benzene-1,3,5-tricarboxylate (mmbtc) linkers. This gives rise to a hexagonal structure containing two types of one-dimensional pores, both running parallel to the crystallographic c axis, as shown in Figure 1(a). One set of pores is lined by the hydrophobic methyl ester moieties, while the other is
lined by hydrophilic Cu-bound H2O in the as-made material. This unusual
“double-barrelled” structure imparts dual-adsorption properties to the material with applications in gas separation and in the storage of multiple guest species. Furthermore, the in-situ esterification of benzene-1,3,5-tricarboxylic acid (trimesic acid, H3btc) and subsequent
groups. The mmbtc can be recovered by careful alkaline hydrolysis of STAM-1 and used in the preparation of further MOFs[25] or, potentially, dendrimers.[26] A partial 13
C NMR spectrum of as-made STAM-1 was reported in Ref. [24], and confirmed the presence of the methyl ester. The other resonances observed in the spectrum were not assigned – a task addressed in the present work.
HKUST-1 is a well-known copper-based MOF, first reported by Chui et al. in 1999.[27] While topologically unrelated to STAM-1, its synthesis is very similar, differing only in the choice of reaction medium. The use of 1 : 1 H2O : EtOH as a solvent, rather than
the 1 : 1 H2O : MeOH used in the synthesis of STAM-1, means that in-situ esterification is
much slower in the synthesis of HKUST-1 and the unmodified benzene-1,3,5-tricarboxylate (btc) is incorporated into the framework rather than its ethyl ester. This leads to a cubic structure with a three-dimensional network of pores, as shown in Figure 1(b). However, a key feature of the HKUST-1 structure is that it contains the same copper
dimers as STAM-1, and the three crystallographically-distinct carbon sites may be considered, at least superficially, to be chemically similar to three of those present in STAM-1, as shown by the numbering scheme in Figure 1(c). Previously, there have been two reported sets of 1
H and 13
C MAS NMR spectra and assignments for HKUST-1, making this an ideal system for comparison with STAM-1 in the present work.[20,21] The aim of this work is to acquire and fully assign complete 13
C MAS spectra of as-made forms of the two MOFs, and to investigate the sensitivity of these spectra to chemical and physical changes within the two materials.
Experimental Details
Synthesis of isotopically-enriched linker molecules: Benzene-1[13
C],3,5-tricarboxylic acid and [U-13
C]benzene-1,3,5-tricarboxylic acid were prepared by KMnO4-mediated oxidation of
the parent 13
Synthesis of MOFs: STAM-1 and HKUST-1 were prepared according to previously-published procedures.[24,29] Isotopically-labelled MOFs were also prepared using the appropriate labelled reagents (benzene-1[13
C],3,5-tricarboxylic acid, [U-13
C]benzene-1,3,5-tricarboxylic acid or CD3OD) in place of the corresponding natural-abundance reagents.
Synthetic details are provided in the ESI (Section S2).
Dehydration of MOFs: Flame-sealable vials of the as-made MOFs were heated at 120°C under vacuum overnight, cooled and sealed under argon.
Rehydrated and ethanol-loaded MOFs: Portions of the dehydrated MOFs were exposed to either atmospheric moisture (H2O-loaded) or liquid ethanol (HKUST-1).
EtOH-HKUST-1 was recovered by suction filtration.
Solid-state NMR: Solid-state NMR spectra of Cu-based MOFs were acquired using a Bruker Avance III spectrometer equipped with a 14.1 T wide-bore superconducting magnet, at Larmor frequencies of 600.1 and 150.9 MHz for 1
H and 13
C, respectively. Samples were packed in standard 1.3 mm ZrO2 rotors and rotated at a MAS rate of ~60 kHz using a
double-resonance HX probe. Where required (see main text for details), spectra are the result of co-adding two individual sub-spectra acquired using two different frequency offsets. Typical radiofrequency (rf) nutation rates were ~100 kHz for both 13
C and 1
H. The majority of 13
C and 1
H MAS spectra were acquired using a spin echo pulse sequence, with typical τ durations of one rotor period (~16.7 µs), and a recycle interval of 20-100 ms. To aid assignment, 13
C spectra were also acquired using cross polarisation (CP) from 1
H, with a contact pulse duration of between 50 and 2500 µs (ramped for 1
H). A (rotor-synchronised) spin echo was added prior to acquisition to ensure undistorted spectra were obtained. No decoupling was applied during acquisition, allowing a recycle interval of 100 ms to be used. Conventional 13
C CP MAS NMR spectra were also acquired for solid samples of trimethyltrimesate (tmbtc) and trimesic acid. Samples were packed in 4 mm ZrO2 rotors and rotated at a MAS rate of 12.5 kHz. A contact pulse of between 1 and 5 ms
(ramped for 1
(TPPM) 1
H decoupling (100 kHz nutation frequency) was applied during acquisition. All NMR spectra were referenced to TMS using L-alanine as a secondary reference (δ(CH3) = 20.5 ppm, δ(NH3) = 8.5 ppm).
Lower-field NMR spectra of Cu-based MOFs were acquired using a Bruker Avance III spectrometer equipped with a 9.4 T wide-bore superconducting magnet, at a Larmor frequency of 100.6 MHz for 13
C. Samples were packed in standard 4 mm outer-diameter ZrO2 rotors and rotated at an MAS rate of 10-14 kHz using a standard Bruker 4 mm MAS
probe.
High-field NMR spectra of Cu-based MOFs were acquired at the UK 850 MHz Solid-State NMR Facility, based at the University of Warwick, using a Bruker Avance III spectrometer equipped with a 20.0 T wide-bore superconducting magnet, at a Larmor frequency of 213.8 MHz for 13
C. Samples were packed in standard 1.3 mm outer-diameter ZrO2 rotors and rotated at an MAS rate of ~60 kHz using a triple-resonance HXY probe
operating in double-resonance mode. Variable-temperature experiments were conducted with the temperature monitored externally (i.e., by an external thermocouple within the probe) and set to values between 250 and 303 K. Prior to acquisition, the temperature was allowed to equilibrate until a stability of ±0.1 K was achieved for a period of at least five minutes. Calibration was not carried out to account for frictional heating arising from the drive and bearing gas flows (i.e., the actual temperature inside the rotor) and, therefore, absolute sample temperatures are not known. Further experimental details are provided in figure captions.
Dehydrated samples were packed into rotors under a flowing argon atmosphere in the minimum time possible. Uptake of atmospheric water on the timescale of the packing (~1 minute) was negligible, as shown by 1
H MAS NMR (ESI, Section S3).
Acquisition of complete 13
C MAS NMR spectra of STAM-1 and HKUST-1
The crystal structures of HKUST-1 and STAM-1 (Figure 1) exhibit three and seven crystallographically-distinct C species, respectively, (i.e., one distinct type of linker species in each MOF, with crystallographic equivalence of all chemically-equivalent carbons), each of which might be expected to result in a resonance in the 13
C NMR spectrum. The pores of the “as-made” samples will also contain a mixture of water and any residual solvent molecules. The previously-reported 13
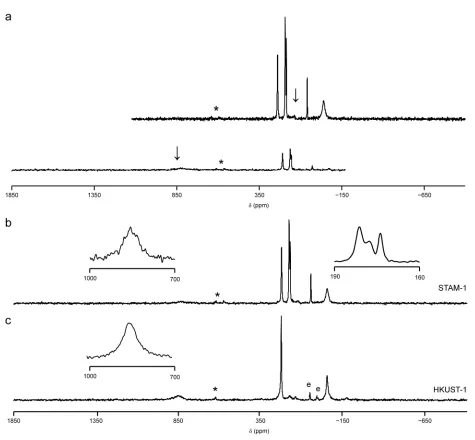
C NMR spectrum of as-made STAM-1, acquired using CP at a relatively slow MAS rate (12.5 kHz) contained four resonances at 181, 178, 174 and 49 ppm, with the latter used as evidence for the presence of the esterified linker molecule in the MOF.[24] For as-made HKUST-1, two resonances have been observed in previous work,[21] at ~227 and –50 ppm; assigned to the aromatic (i.e., C1/C3) and carboxylate (C2) carbons, respectively. However, Figure 2 shows that by using a combination of fast (60 kHz) MAS, a spin-echo pulse sequence, and frequency-stepped acquisition, seven resonances can be observed in the 13
C MAS NMR spectrum of as-made STAM-1, with isotropic shifts of 853, 227, 181, 178, 174, 49 and –50 ppm, while for HUKST-1, three resonances are observed, at 853, 228 and –50 ppm. It would appear that the resonance at 853 ppm was not observed in previous work[21] owing to the slower MAS rate (10 kHz) used and the smaller frequency range considered. No further resonances were observed within the region between 2000 and –2000 ppm for either MOF. All subsequent 13
C MAS NMR spectra were, therefore, acquired as two sub-spectra, with the transmitter frequency offset by 100 and 850 ppm, respectively. Each sub-spectrum was acquired with the same number of transients and, although the number of transients acquired varied for different samples, it was generally on the order of 105
- 106
.
In order to ensure that the spectra contained all resonances with the maximum intensity (i.e., no resonances were being saturated or lost completely as a consequence of the short recycle intervals employed), T1 relaxation constants were measured for all
generally shorter than 20 ms (although some slightly longer T1 values, on the order of 80
ms, were observed for dehydrated STAM-1 – see later).
Assignment of 13
C MAS NMR spectra of as-made MOFs
Assignment of framework 13
C resonances of MOFs is often non-trivial, even in the absence of unpaired electrons, owing to factors such as framework flexibility, multiple solvation states, the presence of disordered or dynamic guest molecules within the pores, and crystallographic inequivalence of nominally chemically-equivalent environments. Such assignments, however, are crucial in understanding the local structure (and, hence, the properties and applications) of MOFs. The use of ab initio or first-principles calculations to assist in the assignment of NMR spectra has been demonstrated for a wide range of microporous materials[30-34] but, owing to the complications outlined above, such an approach is not yet widely applied to MOFs.[35,36] Indeed, this approach is currently unfeasible for many MOFs, as their unit cells are often too large for such calculations to be performed with current computational hardware. In addition, the presence of unpaired electrons in paramagnetic MOFs can lead to unusual shifts of the spectral resonances presenting a challenge for assignment; yet the difficulty in describing adequately the ground-state configuration can hinder computational study. This is a particular problem for STAM-1 and HKUST-1 (i.e., MOFs containing Cu dimers), which have an open-shell singlet ground state. Furthermore, as the population of low-lying excited states must be considered at temperatures above 0 K, calculation of NMR parameters for paramagnetic MOFs with large unit cells can be extremely computationally expensive. For the two MOFs studied here, there is no complication arising from crystallographic inequivalence of chemically-equivalent sites, but the observed range of positive and negative isotropic paramagnetic shifts and lack of theoretical support means that spectral assignment remains a significant challenge.
Comparison of the 13
and 853 ppm) as the three resonances observed for HKUST-1 (–50, 228 and 853 ppm), enabling these to be assigned to C1-C3. The resonance at 49 ppm in STAM-1 is characteristic of a (diamagnetic) methyl ester, supporting its previous assignment as C7.[24] The remaining three resonances in the STAM-1 spectrum, at 181, 178 and 174 ppm, can therefore be assigned to C4-C6.
Many previous assignments of 13
C NMR spectra of paramagnetic MOFs have been based predominantly on the principle that nuclei closer to the paramagnetic centre are expected to have a larger paramagnetic contribution to the observed isotropic shift.[19-21] This intuitive approach assumes that the transferred hyperfine interaction is the dominant contribution to the resonance position and its magnitude should reduce as the length of the bonding pathway between the unpaired electron and the nucleus in question is increased. However, the resonances in the spectra of HKUST-1 and STAM-1 are shifted both upfield and downfield from the normal 13
C shift range, and so, in order to gain insight into how much a particular resonance is affected by any paramagnetic interactions, it would be useful if NMR spectra of chemically-similar diamagnetic analogues were available for comparison. Attempted syntheses of Zn-containing analogues of HKUST-1 and STAM-1 were unsuccessful, forming instead a phase resembling the recently-reported MOF, Zn-BTC.[37,38] As an alternative, solution- and solid-state 13
C NMR spectra of the simple molecular analogues, H3btc (for HKUST-1) and tmbtc (for STAM-1), were
considered, as discussed in the ESI (Section S5). However, the molecular rather than framework nature of these materials, crystallographic inequivalence of sites in the solid state,[39] and presence of concentration-dependent shifts in solution precludes detailed spectral analysis in this case.
Based on the isotropic shifts, T1 values and linewidths, the three resonances in the
suggests the same assignments for C1, C2 and C3, but the resonances associated with C4, C5 and C6 occur within 7 ppm of each other, with very similar linewidths and T1
relaxation constants (see the ESI (Section S6) for further details) and it proved impossible to assign these resonances with any degree of confidence by this approach alone.
The assignment of 13
C NMR spectra is often assisted by CP MAS NMR experiments, in which magnetisation is transferred from 1
H to 13
C during a spin-locking period (or “contact time”). The intensity of the observed 13
C resonances observed is a function of the contact time, and dependent upon the spatial proximity of nearby protons and the relaxation processes affecting both 1
H and 13
C. Previous reports of CP MAS NMR spectra of HKUST-1 and other paramagnetic solids have noted that maximum signal intensity is observed for much shorter contact times than would be expected for diamagnetic solids, owing to the rapid loss of magnetisation during spin-locking, described by the relaxation constant, T1ρ.[21] In this work, 13C CP MAS NMR spectra of HKUST-1 and STAM-1 were acquired using 60 kHz MAS (with a single transmitter offset of 100 ppm), using a modified pulse sequence with the addition of a refocusing π pulse to allow the observation of broader resonances, if present. Typical spectra are shown in Figure 3(a). As discussed above, rapid MAS is essential for the acquisition of a spectrum uncluttered by spinning sidebands, and also allows for shorter rotor-synchronised echo delays. However, the heteronuclear dipolar interaction, through which magnetisation is transferred during CP, is effectively removed by fast MAS, significantly reducing the efficiency of the transfer. For the two Cu-based MOFs a maximum signal intensity of 36% was observed (the theoretical maximum enhancement is γ(1
H)/γ(13
relaxation and the reduced dipolar couplings owing to the fast MAS rate and relatively large 1
H-13
C separation. This is in contrast to the work in Ref. [21], in which the resonance at –50 ppm in HKUST-1 was observed at longer contact times, although those experiments were carried out with a MAS rate of 10 kHz, providing more efficient transfer of magnetisation.
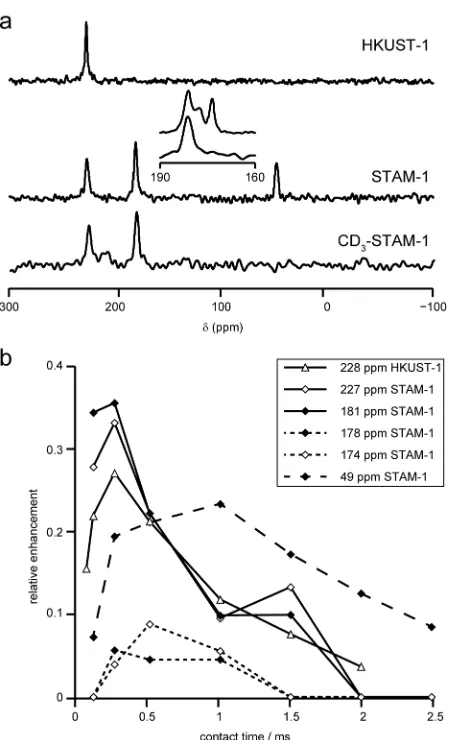
The CP “build-up” curves plotted in Figure 3(b) confirm the assignment of the resonances at 227 and 228 ppm (in STAM-1 and HKUST-1, respectively) as C3, and the resonance at 49 ppm in STAM-1 as the methyl group, C7. Additionally, the resonance at 181 ppm can be identified as C4 (the only other protonated carbon in STAM-1). Confirmation of the assignment of C3, C4 and C7 in STAM-1 was obtained from NMR spectra of CD3-STAM-1 (i.e., STAM-1 in which the methyl ester is deuterated; prepared as
described in the ESI (Section S2)). The intensities of the signals assigned as C3 and C4 were essentially unchanged from those in protonated STAM-1, while the resonance assigned to C7 was absent from the spectrum at short contact times (Figure 3(b)), confirming the absence of protons bonded to this carbon species only when the CH3 group is replaced by
CD3.
Unambiguous assignment of signals resulting from C5 and C6 in STAM-1, and C1 and C3 in both MOFs is not possible by CP, as C5 and C6 (174 and 178 ppm) were observed only with very low intensity and exhibit almost identical behaviour with variable contact time, and C1 and C2 (853 and –50 ppm in both MOFs) are not observed at all. Previous attempts to increase the efficiency of CP in cases of rapid T1ρ relaxation and fast MAS, in order to increase sensitivity, have employed short, high-power adiabatic pulses to great effect.[40-41] However, this approach was not attempted here, as the pulses would have been several times longer than a single rotor period, making their mechanism of action unclear, thus precluding definitive assignment of resonances by considering the variation of the CP intensity with contact time.
13
Even with a consideration of the isotropic shifts and linewidths, CP experiments and T1 measurements, the
13
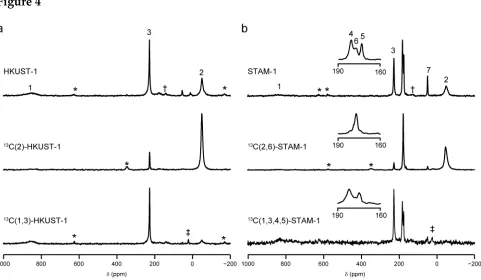
C MAS NMR spectra of HKUST-1 and STAM-1 can only be partially assigned, with ambiguity between C5 and C6, and only tentative assignment of C1 and C2. In order to provide unambiguous assignments, selectively 13
C-labelled linker molecules were synthesised and used to produce HKUST-1 and STAM-1, as described in the ESI (Section S2). Benzene-1[13
C],3,5-tricarboxylic acid was used to prepare 13
C(2,6)-STAM-1 and 13
C(2)-HKUST-1, with one enriched carboxylate carbon per molecule. The enriched linker was diluted 1 : 1 with natural-abundance trimesic acid, yielding an average enrichment of approximately 17% 13
C. Figure 4 compares 13
C MAS NMR spectra of the natural-abundance MOFs and 13
C(2,6)-STAM-1 and 13
C(2)-HKUST-1. For 13
C(2)-HKUST-1 the resonance at –50 ppm is significantly increased in intensity in the enriched material, unambiguously confirming its assignment, somewhat surprisingly, not as C1 but as C2. This would suggest that the resonance at 853 ppm, with a much greater linewidth is not the C2, directly adjacent to the paramagnetic centre, but is actually C1, one bond further away. Similarly, for 13
C(2,6)-STAM-1, there is a significant increase in intensity of the peak at –50 ppm (C2) and, in addition, of the resonance at 178 ppm, enabling its assignment as C6.
Although these results suggested a complete assignment of the 13
C spectra of both MOFs, the somewhat surprising conclusion (and the lack of observation of the resonance at 853 ppm in previous work) required confirmation that all resonances do, indeed, result from the MOFs. 13
C(1,3,4,5)-STAM-1 and 13
C(1,3)-HKUST-1 were synthesised from
[U-13
C]benzene-1,3,5-tricarboxylic acid (with an average enrichment of 6% after dilution, although any given benzene ring in the material was either fully labelled, or fully natural abundance), and the corresponding 13
complete assignment of the two spectra is given in Table 1, and is also shown in Figure 4. The integrated intensity ratio of the resonances at 853 and 228 ppm in HKUST-1 remains at 0.8 : 1 in 13
C(1,3)-HKUST-1 (rather than the crystallographically-expected 1 : 1, owing to relaxation-related losses during the spin echo). However, for 13
C(1,3,4,5)-STAM-1, the relative intensities of the resonances at 227 and 181 ppm were not the same as the natural-abundance MOF, indicating the presence of a small amount of 13
C(1,3)-HKUST-1 in the material; this was later confirmed by X-ray diffraction (see Section S8 of the ESI).
The use of isotopic enrichment has enabled a complete and unambiguous assignment of the 13
C NMR spectra of HKUST-1 and STAM-1, and also highlighted the danger of making assignments for paramagnetic MOFs simply by the seemingly intuitive consideration of shifts or linewidths. This is a consequence of the large number of connected paramagnetic ions that are present within the infinite network structures of MOFs, resulting in the localisation of significant spin density on atoms several bonds away from the paramagnetic centre. It is clear that the development of improved theoretical approaches for the prediction of NMR spectra of paramagnetic solids is required, and would assist significantly in the assignment of NMR spectra such as those presented here.
Recovery of selectively-labelled mmbtc
One of the interesting, but less well-studied, applications of MOFs is as a protecting group in the synthesis of compounds that would otherwise be difficult to produce.[25] It has been shown that STAM-1 can act as a protecting group in the formation of mmbtc (specifically as its disodium salt, Na2mmbtc).[24,25] The synthesis of Na2mmbtc by
conventional synthetic approaches would be challenging, requiring either the selective esterification of one of three chemically-identical carboxylic acids or the selective hydrolysis of two of three identical esters.[43] However, this selective monomethylation is facile and occurs in almost quantitative yield using STAM-1.[24,25] In order to confirm the successful incorporation of 13
C-labelled mmbtc in 13
C(2,6)-STAM-1 and 13
C(1,3,4,5)-STAM-1, the enriched linker was also extracted as Na2mmbtc following alkaline hydrolysis.
While all care was taken to hydrolyse the MOFs without hydrolysis of the ester moieties, a small amount of Na3btc was also present, arising from the presence of small amounts of
HKUST-1 in the original MOF. Further details of the experiments and solution-state NMR spectra can be found in the ESI (Section S9). The fact that the selectively-enriched linker can be recovered intact from STAM-1 (and also from HKUST-1, although yielding in this case exclusively Na3btc) means that the labelling strategy presented here need not be
excessively costly, as labelled H3btc and H2mmbtc may recycled, potentially several times.
Furthermore, this strategy presents a facile route for the preparation of selectively 13
C-enriched mmbtc, a material with potential applications in the synthesis of functional dendrimers.[26,43]
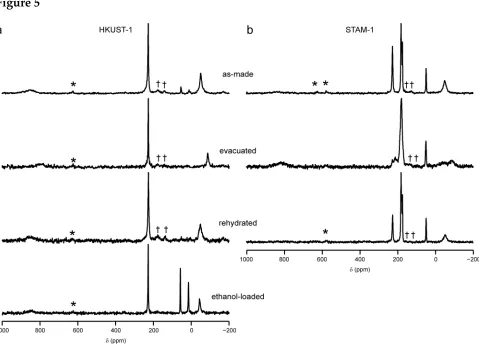
Comparison between as-made, dehydrated and hydrated MOFs
In many as-made MOFs, 13
C NMR spectra are complicated by the presence of solvent molecules within the pores of the framework. These molecules are rarely located by diffraction, owing to factors such as disorder, dynamics and the use of mixed-solvent systems. In the 13
C NMR spectra of HKUST-1 shown previously, four minor resonances were observed at approximately 4.5, 11.2, 52.7 and 54.6 ppm, most probably arising from small amounts of ethanol remaining from synthesis, although the possibility of a very low level of esterification (i.e., ethylation analogous to the methylation in STAM-1) cannot be ruled out completely. Evacuation of both STAM-1 and HKUST-1 is possible, however, resulting in the removal of all guest molecules from within the pores. 13
C MAS spectra of these evacuated forms (denoted deh-) are shown in Figure 5, along with spectra for samples that were subsequently rehydrated (denoted H2O-) and loaded with ethanol
(HKUST-1 only). It can be seen that no “ethyl” resonances are observed at all in the deh- or H2O-HKUST-1, leading to the conclusion that the ethyl ester has not formed, and the
et al. demonstrated the existence of a rapid exchange between H2O bound to Cu and bulk
H2O in the pores of H2O-HKUST-1, leading to only one resonance being observed in the 1
H MAS NMR spectrum.[21] It is possible that the adsorption/desorption kinetics of ethanol may be slower, owing to its larger mass and bulk, or a different affinity for the Cu site in HKUST-1, although further work would be required to confirm this. There are significant shifts in both the C1 and C2 resonances (a change of –58 and –37 ppm, respectively) upon dehydration of HKUST-1 (as observed previously in Refs. [20 and 21] for C2), a change that is reversed upon rehydration or ethanol loading, as shown in Figure 5. This suggests that the spin and electron distribution (responsible for the paramagnetic
shifts) changes upon dehydration, allowing solid-state 13
C NMR spectroscopy to act as an indirect probe of the coordination environment of the Cu atom. It should be noted that Peterson et al. claimed that, upon 1
H decoupling, two additional resonances were observed at 212 and 240 ppm; both of which were assigned to C1.[20] However, no such resonances were observed in work presented here, or in Ref. [21] and it is, therefore, assumed that these resonances instead arise from some impurity phase or experimental artefact in the earlier work.
Unlike HKUST-1, the more flexible framework of STAM-1 undergoes significant changes upon evacuation, with a lowering of symmetry from trigonal to triclinic, closing of the hydrophobic pores and an increase in disorder.[24,25] While the structure of dehydrated STAM-1 has not yet been fully determined from crystallography, it is clear from the 13
C MAS NMR spectrum in Figure 5 that there are at least two resonances in the C2 region (–54 and –88 ppm), with an integrated intensity ratio of approximately 1 : 1. The presence of magnetically-inequivalent C2 sites (confirmed with dehydrated 13
C(2,6)-STAM-1, see Section S10 of the ESI for details) is consistent with a lowering of symmetry. A similar splitting of the C3 resonance is observed, with shifts of 227 and 213 ppm in the dehydrated material. Changes in isotropic shifts for C4, C5 and C6 lead to a broad region of signal between 160 and 195 ppm and, although there are clearly multiple contributions to this resonance, deconvolution was not possible, even with the 13
affected, any splitting appears less than the linewidth at 14.1 T (~8-10 kHz). The C7 resonance is broadened (~900 Hz in deh-1 compared to ~400 Hz in as-made STAM-1), but not notably split. This broadening is attributed to disorder, rather than any increased interaction with unpaired electrons, as T1 for this resonance is 80 ms (c.f. 118 ms
for the CH3 resonance of (diamagnetic) L-alanine under comparable experimental
conditions). Further work is required in order to understand fully both the structure of deh-STAM-1 and its 13
C NMR spectrum. As noted previously by Mohideen et al.,[24] the phase change is fully reversible upon hydration and the 13
C MAS NMR spectrum of H2
O-STAM-1 is essentially identical to that of the as-made material (Figure 5).
The effects of changing the B0 field strength and temperature
13
C NMR spectra were acquired for STAM-1 and HKUST-1 at B0 field strengths of
9.4 T (14 kHz MAS), 14.1 T (60 kHz MAS) and 20.0 T (58 kHz MAS). No significant changes were observed in the isotropic shifts or T1 values measured at different fields.
Further details are provided in the ESI (Section S11). The minor differences observed at different fields can be attributed to experimental error and small variations in temperature arising from different frictional heating of the rotors, as a consequence of the different MAS rates and rotor sizes used. Variable-temperature experiments (carried out at 20.0 T) showed that, although the position of the resonances in deh-HKUST-1 are temperature dependent, the observed changes in shifts (approximately +20(2) ppm for C1, –7(1) ppm for C2 and 3.5(5) ppm for C3, over a 53 K temperature range (changes are quoted relative to the lowest-temperature experiment)) are far smaller than the shift differences at room temperature. This confirms that there will be no change in the order of the resonances in the spectrum at easily-accessible temperatures (or with the small temperature changes resulting from frictional heating. A similar analysis was not carried out for dehydrated STAM-1, owing to the increased complexity of the 13
dependence was not investigated) over the same temperature range. Further investigation of the temperature-dependence of these systems is ongoing, but is not the focus of the present work.
Perhaps a more important field-dependent parameter is the sensitivity of the experiment, which will increase with increasing nuclear polarisation at higher fields. In this work, the increased sensitivity obtained with higher field was offset by the need for additional frequency steps in order to achieve uniform excitation across the whole spectrum and the overall experimental time required to achieve comparable signal-to-noise ratios at 14.1 T and 20.0 T was similar. However, the increased chemical shift dispersion, while detrimental to frequency-stepped mapping of spectra, will be advantageous when studying a particularly crowded region of a spectrum, e.g., in guest-loaded MOFs, where resonances arising from the guest may be close to those of the framework. Therefore, in general, lower-field spectrometers (and higher MAS rates) are preferable for the initial task of acquiring a complete spectrum for these paramagnetic MOFs, while higher fields will prove valuable for the investigation of more complicated MOF-guest systems.
Conclusions
Using a simple experimental approach, combining a spin echo with frequency-stepped acquisition and fast MAS, all resonances in the 13
C MAS spectra of the Cu-based MOFs, HKUST-1 and STAM-1, were observed for the first time. In particular, a hitherto-unreported resonance at ~853 ppm was present for both materials. As the number of resonances observed for each material using this technique agrees with the reported numbers of crystallographically-unique C atoms, it was assumed that these spectra were complete and could, therefore, be assigned. This was tackled initially using a consideration of the resonance positions (i.e., the magnitude of paramagnetic shifts), linewidths, T1 relaxation and signal intensity in CP experiments. However, unambiguous
assignment was not possible even for the simpler case of HKUST-1, and 13
labelling of the organic linker was undertaken to enable confident assignment of the spectra. The use of specifically-labelled trimesic acids in the MOF synthesis was able to provide an unambiguous, if somewhat surprising, answer, highlighting the danger of making simple assumptions when investigating these complex materials.
In addition to assignment by 13
C-labelling experiments, the use of CD3OD in the
synthesis of STAM-1 provided unambiguous evidence that the methyl groups incorporated into STAM-1 arise from the solvent. This finding supports the previously-proposed mechanism of esterification, although a Cu-catalysed mechanism cannot be unambiguously confirmed by this work. It was also demonstrated that the monomethylated linker could be recovered from STAM-1 intact (as the disodium salt), demonstrating not only the use of this MOF as a protecting group, but also the ability (for both STAM-1 and HKUST-1) to recover isotopically-enriched linkers. It is possible, therefore, to use an enriched linker a number of times in different synthetic procedures, thereby reducing significantly the overall cost of the approach.
Owing to the rapid T1 relaxation of these materials it is possible to acquire many
transients rapidly and, hence, acquire spectra with good sensitivity in a relatively short time even at natural abundance. The 13
C MAS NMR spectra have been demonstrated to contain a wealth of physical and chemical information for these two MOFs, and it is now hoped to extend this information content to include locations of guest molecules within the pores of the MOFs. It is anticipated that a combination of the rapid and straightforward NMR experiments and the sensitivity of the resulting spectra will allow
13
C MAS NMR spectroscopy to play an important role in the molecular-level understanding of host-guest interactions in important medically- and industrially-relevant MOFs.
The authors wish to thank EPSRC for the award of a studentship to DMD and for funding part of this work. Professor M. Bertmer and Dr R. Alan Aitken are thanked for helpful discussions. The UK 850 MHz solid-state NMR Facility used in this research was funded by EPSRC and BBSRC, as well as the University of Warwick including via part funding through Birmingham Science City Advanced Materials Projects 1 and 2 supported by Advantage West Midlands (AWM) and the European Regional Development Fund (ERDF). REM is a Royal Society Industry Fellow.
Electronic Supplementary Information
Electronic supplementary information (ESI) available: synthesis details, analysis of in-situ hydration during NMR experiments, information on inversion recovery experiments, solution- and solid-state spectra of diamagnetic model systems, further NMR spectra of CD3-STAM-1, XRD pattern for
13
C(1,3,4,5)-STAM-1, details of extraction of 13
C-enriched Na2mmbtc from enriched STAM-1,
13
C spectra of dehydrated isotopically-enriched MOFs, and isotropic shifts and T1 relaxation constants measured at different B0
References
[1] M. Eddaoudi, J. Kim, N. L. Rosi, D. Vodak, J. Wachter, M. O’Keeffe, O. M. Yaghi,
Science, 2002, 295, 469.
[2] N. L. Rosi, J. Kim, M. Eddaoudi, B. Chen, M. O’Keeffe, O. M. Yaghi, J. Am. Chem. Soc., 2005, 127, 1504.
[3] K. K. Tanabe, S. M. Cohen, Chem. Soc. Rev., 2011, 40, 498. [4] G. Férey, C. Serre, Chem. Soc. Rev., 2009, 38, 1380.
[5] J. R. Long, O. M. Yaghi, Chem. Soc. Rev., 2009, 38, 1213.
[6] P. Horcajada, R. Gref, T. Baati, P. K. Allan, G. Maurin, P. Couvreur, G. Férey, R. E.
Morris, C. Serre, Chem. Rev., 2012, 112, 1232.
[7] A. C. McKinlay, B. Xiao, D. S. Wragg, P. S. Wheatley, I. L. Megson, R. E. Morris, J. Am. Chem. Soc., 2008, 130, 10440.
[8] M. Meilikhov, K. Yusenko, R. A. Fischer, Dalton Trans., 2010, 39, 10990.
[9] I. M. Hauptvogel, R. Biedermann, N. Klein, I. Senkovska, A. Cadiau, D. Wallacher, R.
Feyerherm, S. Kaskel, Inorg. Chem., 2011, 50, 8367.
[10] K. Uemura, F. Onishi, Y. Yamasaki, H. Kita, J. Solid State Chem., 2009, 182, 2852.
[11]. V. I. Bakhmutov, Solid-State NMR in Materials Science Principles and Applications, CRC Press, Boca Raton, FL, 1st edn., 2012.
[12] M. Kaupp, F. H. Köhler, Coord. Chem. Rev., 2009, 253, 2376. [13] A. Nayeem, J. P. Yesinowski, J. Chem. Phys., 1988, 89, 4600.
[14] C. Luchinat, G. Parigi, E. Ravera, M. Rinaldelli, J. Am. Chem. Soc., 2012, 134, 5006. [15] A. R. Brough, C. P. Grey, C. M. Dobson, J. Am. Chem. Soc., 1993, 115, 7318.
[16] J. Kim, D. S. Middlemiss, N. A. Chernova, B. X. Y. Zhu, C. Masquelier, C. P. Grey, J. Am. Chem. Soc., 2010, 132, 16825.
[19] G. de Combarieu, M. Morcrette, F. Millange, N. Guillou, J. Cabana, C. P. Grey, I.
Margiolaki, G. Férey, J.-M. Tarascon, Chem. Mater., 2009, 21, 1602.
[20] G. W. Peterson, G. W. Wagner, A. Balboa, J. Mahle, T. Sewell, C. J. Karwacki, J. Phys. Chem. C, 2009, 113, 13906.
[21] F. Gul-E-Noor, B. Jee, A. Pöppl, M. Hartmann, D. Himsl, M. Bertmer, Phys. Chem. Chem. Phys., 2011, 13, 7783.
[22] Y. Y. Tong, J. Magn. Reson., 1996, A119, 22.
[23] G. Mali, A. Ristić, V. Kaučič, J. Phys. Chem. B, 2005, 109, 10711.
[24] M. I. H. Mohideen, B. Xiao, P. S. Wheatley, A. C. McKinlay, Y. Li, A. M. Z. Slawin, D.
W. Aldous, N. F. Cessford, T. Düren, X. Zhao, R. Gill, K. M. Thomas, J. M. Griffin, S. E.
Ashbrook, R. E. Morris, Nature Chem., 2011, 3, 304.
[25] M. I .H. Mohideen, Ph.D. Thesis, University of St Andrews, 2011.
[26] S. M. Grayson, J. M. J. Fréchet, Chem. Rev.2011, 101, 3819.
[27] S. S-Y. Chui, S. M.-F. Lo, J. P. H. Charmant, A. G. Orpen, I. D. Williams, Science, 1999, 283, 1148.
[28] B. Juršić, Can. J. Chem., 1989, 67, 1381.
[29] B. Xiao, P. S. Wheatley, A. J. Fletcher, S. Fox, A. G. Rossi, I. L. Megson, S. Bordiga, L.
Regli, K. M. Thomas, R. E. Morris, J. Am. Chem. Soc., 2007, 129, 1203.
[30] S. E. Ashbrook, M. Cutajar, C. J. Pickard, R. I. Walton, S. Wimperis, Phys. Chem. Chem. Phys.2008, 10, 5754.
[31] D. H. Brouwer, I. L. Moudrakovski, R. J. Darton, R. E. Morris, Magn. Reson. Chem., 2010, 48, S113.
[32] M. Castro, V. R. Seymour, D. Carnevale, J. M. Griffin, S. E. Ashbrook, P. A. Wright, D.
C. Apperley, J. E. Parker, S. P. Thompson, A. Fecant, N. Bats, J. Phys. Chem. C, 2010, 114, 12698.
[33] J. M. Griffin, L. Clark, V. R. Seymour, D. W. Aldous, D. M. Dawson, D. Iuga, R. E.
[34] F. Pourpoint, C. Gervais, L. Bonhomme-Coury, T. Azaïs, C. Coelho, F. Mauri, B.
Alonso, F. Babonneau, C. Bonhomme, Appl. Magn. Reson., 2007, 32, 435.
[35] J. P. S. Mowat, S. R. Miller, J. M. Griffin, V. R. Seymour, S. E. Ashbrook, S. P.
Thompson, D. Fairen-Jimenez, A.-M. Banu, T. Düren, P. A. Wright, Inorg. Chem., 2011, 50, 10844.
[36] J. P. S. Mowat, V. R. Seymour, J. M. Griffin, S. P. Thompson, A. M. Z. Slawin, D.
Fairen-Jimenez, T. Düren, S. E. Ashbrook, P. A. Wright, Dalton. Trans., 2012, 41, 3937. [37] T. Cendak, T. B. Čelič, M. Rangus, N. Z. Logar, G. Mali, V. Kaučič, presented at the 7th
Alpine Conference on Solid-State NMR, Chamonix-Mont Blanc, France, 2011.
[38] T. B. Čelič, M. Mazaj, N. Guillou, V. Kaučič, N. Z. Logar, presented at the3rd
Croatian-Slovenian Symposium on Zeolites, Zagreb, Croatia, 2010.
[39] D. J. Duchamp, R. E. Marsh, Acta Cryst., 1969, B25, 5.
[40] G. Kervern, G. Pintacuda, L. Emsley, Chem. Phys. Lett., 2007, 453, 157.
[41] S. Laage, A. Marchetti, J. Sein, R. Pierattelli, H. J. Saas, S. Grzesiek, A. Lesage, G.
Pintacuda, L. Emsley, J. Am. Chem. Soc., 2008, 130, 17216.
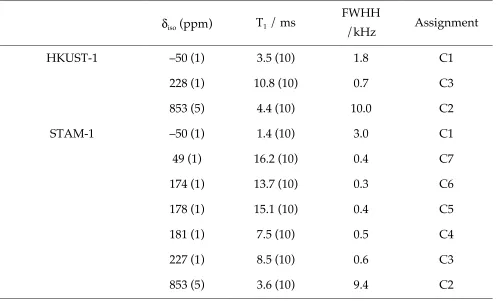
Table 1. Isotropic shifts, δiso, approximate T1 relaxation constants, linewidths (full width at
half height, FWHH) and assignment of resonances observed in 13C MAS NMR spectra of
HKUST-1 and STAM-1. All values are reported for samples spinning at 60 kHz MAS at
14.1 T at room temperature.
δiso (ppm) T1 / ms
FWHH
/kHz Assignment
HKUST-1 –50 (1) 3.5 (10) 1.8 C1
228 (1) 10.8 (10) 0.7 C3
853 (5) 4.4 (10) 10.0 C2
STAM-1 –50 (1) 1.4 (10) 3.0 C1
49 (1) 16.2 (10) 0.4 C7
174 (1) 13.7 (10) 0.3 C6
178 (1) 15.1 (10) 0.4 C5
181 (1) 7.5 (10) 0.5 C4
227 (1) 8.5 (10) 0.6 C3
Figure Captions
Figure 1. Crystal structures of (a) STAM-1 and (b) HKUST-1, both viewed along the crystallographic c axis. All CH3 groups in STAM-1 are shown occupying one of two
(equally-occupied) crystallographically-equivalent orientations. The hydrophobic and
hydrophilic pores of STAM-1 are highlighted in pink (solid line) and pale blue (dashed
line), respectively. In parts (a) and (b), free molecules of water and H atoms of Cu-bound
water are omitted for clarity. Part (c) shows the structures of mmbtc (top) and btc (bottom)
linkers and the numbering scheme used throughout this work.
Figure 2. 13
C MAS NMR spectra (14.1 T, 60 kHz MAS) of (a and b) STAM-1 and (c)
HKUST-1. In (a), spectra acquired with different transmitter offsets (denoted by an arrow)
are shown separately and are then co-added to produce the final spectrum (shown in (b)).
The two spectra are plotted using the same vertical scale. For (b) and (c), spectra are the
result of co-adding two spectra (with transmitter offsets of 100 and 850 ppm). Each
individual spectrum was acquired with signal averaging over 327,680 transients using a 20
ms recycle interval. Asterisks denote spinning sidebands. The downfield inset in parts (b)
and (c) shows a spectrum acquired with a single transmitter offset of 850 ppm and signal
averaging carried out for (b) 2160000 and (c) 2010112 transients. The upfield inset in part
(b) shows an expansion of the three resonances in the 160-190 ppm region of the spectrum
of STAM-1. Resonances marked e correspond to ethanol in HKUST-1 (see text for further
details).
Figure 3. (a) 13
C CP MAS NMR spectra (14.1 T, 60 kHz MAS) of HKUST-1, STAM-1 and
CD3-STAM-1, acquired with a contact time of 250 µs. As described in the text the pulse
sequence was modified to include a spin echo prior to acquisition. Each spectrum was
The resonance at 853 ppm was not observed in any of the spectra, so a smaller spectral
width is shown for clarity. The inset shows an expansion of the spectral region between
160 and 190 ppm for STAM-1 using a spin echo (top) and CP (bottom). (b) Plot of the 13C
CP signal intensity (relative to comparable spectra acquired using a spin echo) as a
function of the contact time for resonances in STAM-1 and HKUST-1.
Figure 4. 13C MAS NMR spectra (14.1 T, 60 kHz MAS) of (a) HKUST-1 and (b) STAM-1,
with spectra corresponding to natural abundance samples (top), 13C(2)-HKUST-1 and
13
C(2,6)-STAM-1 (middle) and 13
C(1,3)-HKUST-1 and 13
C(1,3,4,5)-STAM-1 (bottom).
Spectra were acquired in two frequency steps, as described in the text. Each step was
acquired with signal averaging of 327,680 (top), 32,768 (middle) and 40,960 (bottom)
transients with a repeat interval of 20 ms (top) and 100 ms (middle and bottom). The inset
shows a comparison of the regions between 160 and 190 ppm for STAM-1 (lab = labeled
material, n.a. = natural abundance). Assignments for all framework resonances are also
shown. Asterisks denote spinning sidebands, † denotes a btc-based impurity present in
low amounts in many samples, and ‡ denotes resonances arising from traces of the
surfactant used in synthesis of the labeled linkers.
Figure 5. 13
C MAS NMR spectra (14.1 T, 60 kHz MAS) of (a) HKUST-1 and (b) STAM-1 for
as-made, evacuated, rehydrated and ethanol loaded (for HKUST-1 only) MOFs. All
spectra were acquired in two frequency steps as described in the text. For each step, signal
averaging was carried out over 327,680 transients with a repeat interval of 20 ms (as-made
MOFs), 51,200 transients with a repeat interval of 100 ms (dehydrated and ethanol-loaded
MOFs) or 102,400 transients with a repeat interval of 100 ms (rehydrated MOFs). Asterisks
denote spinning sidebands and † denotes a btc-based impurity present in low amounts in
Figure 5